Openshift Data Foundation Performance Benchmarking guide
This article aims to discuss the various tools and procedures available to perform a benchmark on your Openshift Data Foundation cluster. By analyzing the resulting dataset, you should be able to predict a reasonable expectation of performance within the ODF/Ceph cluster and identify and isolate probable bottlenecks in different layers in this distributed system.
Warning
As is the case with any performance benchmarking procedure, we are pushing the boundaries and testing the capabilities of the cluster, observing how it behaves under substantial workloads, which may be disruptive to other ongoing tasks in the cluster. It is strongly advised to carry out these operations on a fresh cluster without an active production workload. If there are existing applications running, exercise extreme caution, and preferably undertake these activities during scheduled downtime.
Need Help?
If you'd like assistance with this process, please reach out to your Account or Sales team to secure a Performance Review engagement with our Storage Consulting practice. Note that Red Hat Support is staffed to handle break/fix cases for our customers. As such, Red Hat Support simply does not have the staff availability to perform a deep dive performance review on an environment. To ensure the best possible experience with Red Hat Openshift Data Foundation, we urge you to work with our Storage Consulting practice.
Note
This is not a step-by-step HowTo for every command, but is instead meant to guide on what is needed to understand the environment's performance.
Introduction
Red Hat Openshift Data Foundation (ODF) is a highly integrated collection of cloud storage and data services for the Red Hat OpenShift Container Platform.
OpenShift Data Foundation version 4.x integrates a collection of software projects, including:
Ceph, providing block storage, a shared and distributed file system, and on-premises object storageCeph CSI, to manage provisioning and lifecycle of persistent volumes and claimsNooBaa, providing a Multicloud Object GatewayOpenShift Data Foundation, Rook-Ceph, and NooBaa operatorsto initialize and manage OpenShift Data Foundation services.
Except for the operators mentioned above, the rest of the software stack directly or indirectly facilitates data access(read/write).
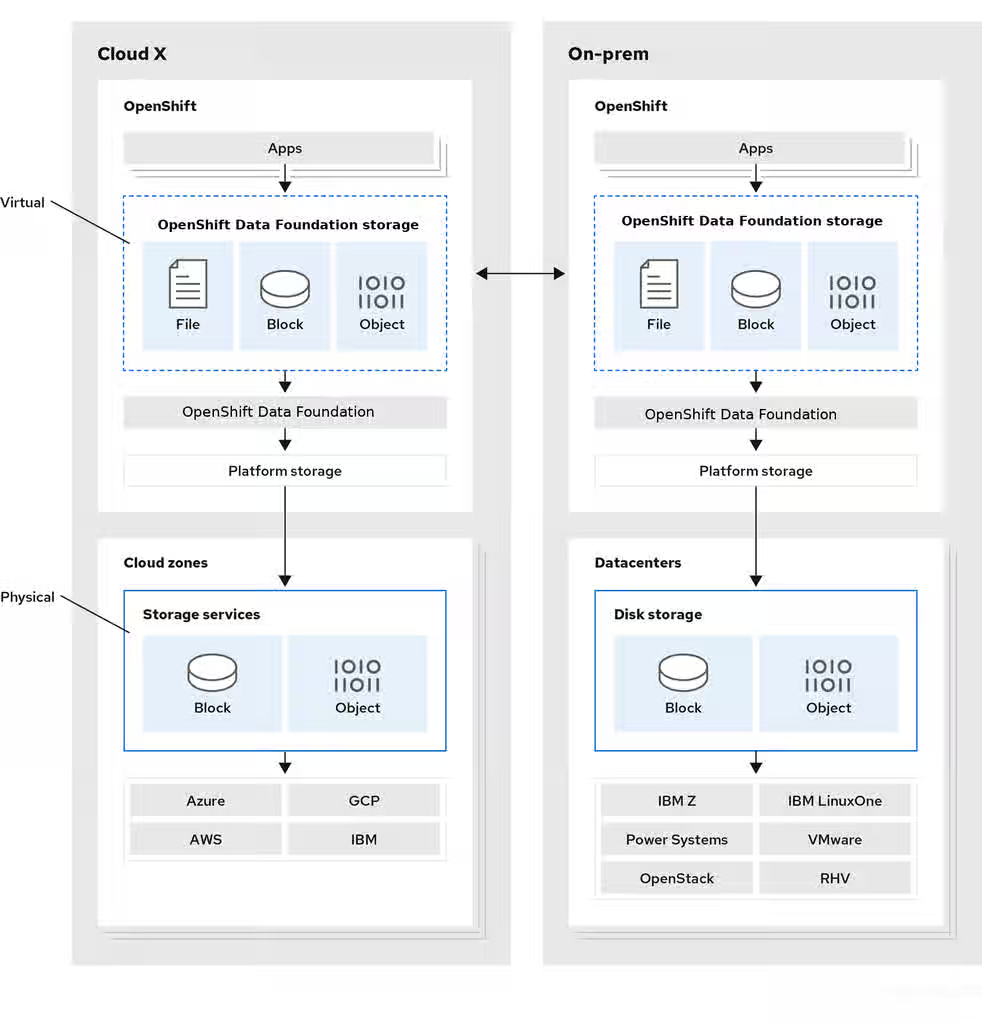
Turning our attention to the Hardware stack, as depicted in the architecture diagram, it becomes evident that numerous components are in play, notably disks, networks, and processors.
To understand the capabilities of your environment and pinpoint any bottlenecks, a comprehensive analysis of each segment, encompassing both hardware and software, is essential. However, delving into such detail adds complexity that exceeds the scope of this document.
The primary focus of this article is to introduce various tools available for evaluating the performance of a live ODF cluster. These tools are systematically presented, and categorized according to the different layers of the ODF architecture.
Tools to Benchmark different layers in the ODF cluster
Baseline Performance Statistics of the infrastructure
First, we have to understand the performance capabilities of the used hardware and environment including network capabilities which could impact your ODF/Ceph Storage cluster. We have a good KCS article explaining how to do this for a Standalone Ceph cluster. Although the steps would be different in an ODF environment, the general idea is the same: How should I go about verifying the performance of my Ceph Storage environment?
This is particularly important in Baremetal clusters using dedicated physical disks as the backend for the OSDs. In the case of cloud infrastructure like AWS or Azure, you can get these statistics from the cloud provider directly so we can skip this step.
You should evaluate :
Physical disk performance-- all disks must be individually tested with fio to identify the physical disk's performance capabilitiesAggregate physical disk performance-- all disks on a given node must be tested with 'fio' in parallel, this will help identify performance bottlenecks of the RAID controller or PCIe busClient/server Network performance-- The purpose is to identify that the full aggregate throughput configured for the node is achievable for received traffic using 'iperf' tool
Benchmarking the underlying Ceph Storage Cluster
These are the tools packaged within the Ceph product :
Note: To run the ceph commands first deploy ceph toolbox pod
RADOS layer:
Ceph includes the rados bench command, designed specifically to benchmark a RADOS storage cluster. To use it, create a storage pool and then use rados bench to perform a write benchmark, as shown below.
ceph osd pool create testbench 100 100
rados bench -p testbench 10 write --no-cleanup
This creates a new pool named scbench and then performs a write benchmark for 10 seconds. Notice the --no-cleanup option, which leaves behind some data. The output gives a good indicator of how fast the cluster can write data.
Two types of read benchmarks are available seq for sequential reads and rand for random reads.
To perform a read benchmark, use the commands below:
#rados bench -p testbench 10 seq
#rados bench -p testbench 10 rand
To clean up the benchmark data left behind by the write benchmark run
#rados -p testbench cleanup
Benchmarking a Ceph Block Device/ RBD
Ceph includes the RBD bench command to benchmark the RBD images.
To perform :
- Deploy toolbox pod
- Find out which image you want to run the benchmark on :
rbd ls -p poolname imagenam - Run rbd bench
For example :
sh-5.1$ rbd bench --io-type write csi-vol-6509569f-48c3-43fe-b6c4-8c8e051eb26e -p ocs-storagecluster-cephblockpool
bench  type write io_size 4096 io_threads 16 bytes 1073741824 pattern sequential
  SEC       OPS   OPS/SEC   BYTES/SEC
    1     40848   40864.6   160 MiB/s
    2     92928     45967   180 MiB/s
    3    125360   41792.6   163 MiB/s
    4    156272   39043.3   153 MiB/s
    5    187936   37530.9   147 MiB/s
    6    219600   35601.4   139 MiB/s
    7    251056   31721.2   124 MiB/s
elapsed: 7   ops: 262144   ops/sec: 34823   bytes/sec: 136 MiB/s
Benchmarking from the Client application side
Ceph/ODF provides 3 modes of storage block(RBD), filesystem(CephFS), object(RGW/MCG).
Use FIO to benchmark the throughput from RBD and CephFS based applications
Create 3-5 test applications. Login to them and run FIO commands.
Tests at your expected op size should be added as well, in power of 2 increments ( 4k, 8k, 16k, 32k ... 128k... 512k, 1m, 2m, 4m )
Create a chart/table with the outputs for comparison.
For example :
4K tests:
fio --name=randwrite --rw=randwrite --direct=1 --ioengine=libaio --bs=4k --iodepth=1 --size=5G --runtime=60 --group_reporting=1
fio --name=randwrite1 --rw=randwrite --direct=1 --ioengine=libaio --bs=4k --iodepth=32  --size=5G --runtime=60 --group_reporting=1
fio --name=randwrite1 --rw=randwrite --direct=1 --ioengine=libaio --bs=4k --iodepth=64  --size=5G --runtime=60 --group_reporting=1
fio --name=randwrite1 --rw=randwrite --direct=1 --ioengine=libaio --bs=4k --iodepth=128  --size=5G --runtime=60 --group_reporting=1

8K tests:
fio --name=randwrite2 --rw=randwrite --direct=1 --ioengine=libaio --bs=8k --iodepth=1  --size=5G --runtime=60 --group_reporting=1
fio --name=randwrite3 --rw=randwrite --direct=1 --ioengine=libaio --bs=8k --iodepth=32 --size=5G --runtime=60 --group_reporting=1
fio --name=randwrite1 --rw=randwrite --direct=1 --ioengine=libaio --bs=4k --iodepth=64  --size=5G --runtime=60 --group_reporting=1
fio --name=randwrite1 --rw=randwrite --direct=1 --ioengine=libaio --bs=4k --iodepth=128  --size=5G --runtime=60 --group_reporting=1
Use COSBench to benchmark Noobaa/MCG based applications
We have documented this in the KCS : How to configure COSBench to Consume MCG Endpoint on OCS 4.x
The results from the above tests would give us a general idea if there is a bottleneck on any layers.
Tips for troubleshooting latency and performance issues
Ceph cluster inherently flags obvious performance issues, for example, it will start complaining about slow requests if any of the read/write operations takes more than 30 seconds to complete.
ODF performance is directly related to the performance of the underlying hardware and environment.
Latency can come from any of the layers which Ceph/ODF is built upon or which provide connectivity to Ceph.
Generally speaking, the latency is going to be a result of several factors:
- The size of the operation
- Disk latency, multiplied by the number of copies created ( this is over generalized, but gives worst case )
- Processing overhead latency in the OSD code (usually immeasurably small)
- Network latency from client to OSD nodes
- Network latency from OSD node to OSD node ( for peer replication )
All of the above could be extended to be more latent due to competing workloads and the environment's ability to handle all workloads in parallel.
The goal of any performance review is to identify the bottleneck that is limiting performance.
Since that performance bottleneck can come from any of the layers indicated above, the initial aim is to narrow the scope of the investigation.
Note that Ceph is designed for massive parallelism, but per-client operations are generally less performant than say dedicated, direct attached storage.
With this in mind, applications that are highly latency-sensitive might not be a good fit for distributed storage system like Ceph storage, at least in their default configurations. -- but only by doing proper testing can determine this for a given workload/environment and further tunings might be needed. To ensure the best possible experience with Red Hat Openshift Data Foundation, we urge you to work with our Storage Consulting practice who will be able to guide you better.