Best Practices for Ansible Automation Platform (AAP) External Logging via Azure VM
Overview
This guide outlines the standard configuration for forwarding automation logs from Ansible Automation Platform (AAP) to external log aggregators.
While AAP can log directly to many common log platforms, this article demonstrates an end-to-end example using an Azure Linux VM as a log collector. This is a common pattern for high-security environments where direct internet access is restricted or where logs must be processed by an intermediary agent (e.g., Azure Monitor Agent) before storage.
Step 1: Infrastructure Setup (Azure)
A. Create the Log Collector VM
- Deploy a Linux VM: Create a standard Linux Virtual Machine (e.g., RedHat, Ubuntu, or CentOS) in your Azure Portal. A small size (e.g., B2s) is sufficient.
- Install Azure Monitor Agent:
- Go to the VM's Extensions + applications blade.
- Click + Add, search for Azure Monitor Agent for Linux, and install it.
B. Open the Network Ports (NSG)
- Navigate to the VM's Networking settings.
- Add an Inbound Port Rule with these specific settings:
- Destination Port: 5140 (Bypasses standard 514 blocks).
- Protocol: TCP (Critical for reliability).
- Action: Allow.
Step 2: Configure Data Collection (Azure Monitor)
You must tell the Azure Agent what to listen for. We do this by creating a Data Collection Rule (DCR).
- Search for Monitor in the Azure Portal > Data Collection Rules > Create.
- Resources: Select your Linux VM.
- Collect and Deliver:
- Add Data Source: Select Linux Syslog.
- LogLevels: Check the boxes for LOG_INFO, LOG_NOTICE, LOG_WARNING, LOG_ERR.
- Facilities: Ensure LOG_USER and LOG_LOCAL0 through LOG_LOCAL7 are selected (AAP logs to these facilities).
- Destination: Add your Log Analytics Workspace.
- Click Review + Create.
Step 3: Configure the VM OS (Rsyslog & Firewall)
Now that Azure is ready, configure the Linux operating system to receive the traffic on the high port.
Run these commands on the Linux VM (via SSH or Azure Cloud Shell):
# 1. Configure Rsyslog to listen on TCP 5140 (instead of default 514)
sudo sed -i 's/port="514"/port="5140"/g' /etc/rsyslog.conf

# 2. Open the Internal OS Firewall (Firewalld) for Port 5140
sudo firewall-cmd --zone=public --add-port=5140/tcp --permanent
sudo firewall-cmd --reload

# 3. Restart Rsyslog to apply changes
sudo systemctl restart rsyslog

# 4. Verify Listener (You should see 'LISTEN')
sudo netstat -antp | grep 5140
Step 4: Configure Sender (AAP)
Point Ansible Automation Platform to your new collector.
- In AAP, navigate to Settings > Logging.
- Logging Aggregator: Enter the Public IP of your Linux VM.
- Logging Aggregator Port: 5140.
- Logging Aggregator Protocol: TCP.
- Timeout: 5 (Default).
- Click Save and Test. (The button should turn Green).
Step 5: Validation (Azure Log Analytics)
Logs will flow from AAP ➔ VM ➔ Azure Monitor Agent ➔ Log Analytics. Use this query to parse the JSON data and confirm success.
Recommended KQL Query:
Syslog
| where SyslogMessage has "awx"
// Extract the JSON payload from the raw text
| extend ParsedLog = parse_json(substring(SyslogMessage, indexof(SyslogMessage, "{")))
// Project readable columns
| project TimeGenerated, JobName=tostring(ParsedLog.task_name), Status=tostring(ParsedLog.state), FullMessage=SyslogMessage
| sort by TimeGenerated desc
Visual Verification
Below is an example of successful log ingestion into Azure Log Analytics.
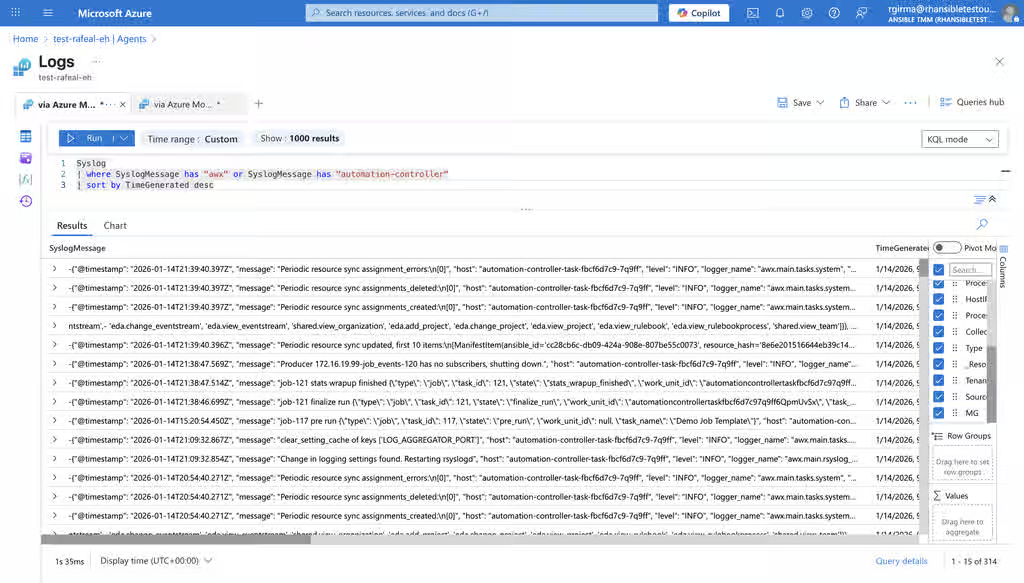
Sample JSON Payload: This is the raw data contained within the SyslogMessage column, which the query above parses:
{ "@timestamp": "2026-01-14T21:38:47.514Z", "message": "job-121 stats wrapup finished...", "host": "automation-controller-task-fbcf6d7c9-7q9ff", "level": "INFO", "lifecycle_data": { "type": "job", "task_id": 121, "state": "stats_wrapup_finished", "task_name": "Demo Job Template" } }
Supported Log Aggregators
This TCP High-Port configuration is compatible with most major logging platforms, including:
- Logmanager: Centralized log visibility.
- Datadog: Cloud application monitoring.
- Splunk: Data-to-Everything Platform.
- Better Stack: Collaborative observability.
- Elastic Stack (ELK): Elasticsearch, Logstash, and Kibana.
Reference Documentation
- Forward Syslog data to Azure Monitor Agent:
Content from learn.microsoft.com is not included.https://learn.microsoft.com/en-us/azure/sentinel/forward-syslog-monitor-agent