Networking Operators
Managing networking-specific Operators in OpenShift Container Platform
Abstract
Chapter 1. Kubernetes NMState Operator
The Kubernetes NMState Operator provides a Kubernetes API for performing state-driven network configuration across the OpenShift Container Platform cluster nodes with NMState.
The Kubernetes NMState Operator provides users with functionality to configure various network interface types, DNS, and routing on cluster nodes. Additionally, the daemons on the cluster nodes periodically report on the state of each node’s network interfaces to the API server.
Red Hat supports the Kubernetes NMState Operator in production environments on bare-metal, IBM Power®, IBM Z®, IBM® LinuxONE, VMware vSphere, and Red Hat OpenStack Platform (RHOSP) installations.
Red Hat support exists for using the Kubernetes NMState Operator on Microsoft Azure but in a limited capacity. Support is limited to configuring DNS servers on your system as a postinstallation task.
Before you can use NMState with OpenShift Container Platform, you must install the Kubernetes NMState Operator. After you install the Kubernetes NMState Operator, you can complete the following tasks:
- Observing and updating the node network state and configuration
-
Creating a manifest object that includes a customized
br-exbridge
The Kubernetes NMState Operator updates the network configuration of a secondary NIC. Do not use the Operator to update the primary NIC network configuration or the br-ex bridge on most on-premise networks. Applying a NodeNetworkConfigurationPolicy CR to the primary NIC or br-ex bridge can result in complete network loss on the affected node. This configuration requires manual recovery of the network configuration.
For a bare-metal platform only, the Kubernetes NMState Operator can update the br-ex bridge network configuration. This update is supported only if you set the br-ex bridge as the interface in a machine config manifest file. To update the br-ex bridge as a postinstallation task, you must set the br-ex bridge as the interface in the NMState configuration of the NodeNetworkConfigurationPolicy custom resource (CR) for your cluster. For more information, see "Creating a manifest object that includes a customized br-ex bridge (Post-installation documentation)".
OpenShift Container Platform uses nmstate to report on and configure the state of the node network. You can modify the network policy configuration by applying a single configuration manifest to the cluster. For example, you can create a Linux bridge on all nodes.
Node networking is monitored and updated by the following objects:
NodeNetworkState- Reports the state of the network on that node.
NodeNetworkConfigurationPolicy-
Describes the requested network configuration on nodes. You update the node network configuration, including adding and removing interfaces, by applying a
NodeNetworkConfigurationPolicyCR to the cluster. NodeNetworkConfigurationEnactment- Reports the network policies enacted upon each node.
Do not make configuration changes to the br-ex bridge or its underlying interfaces as a postinstallation task.
1.1. Installing the Kubernetes NMState Operator
You can install the Kubernetes NMState Operator by using the web console or the CLI.
1.1.1. Installing the Kubernetes NMState Operator by using the web console
You can install the Kubernetes NMState Operator by using the web console. After you install the Kubernetes NMState Operator, the Operator has deployed the NMState State Controller as a daemon set across all of the cluster nodes.
Prerequisites
-
You are logged in as a user with
cluster-adminprivileges.
Procedure
- Select Ecosystem → Software Catalog.
-
In the search field below All Items, enter
nmstateand click Enter to search for the Kubernetes NMState Operator. - Click on the Kubernetes NMState Operator search result.
- Click on Install to open the Install Operator window.
- Click Install to install the Operator.
- After the Operator finishes installing, click View Operator.
-
Under Provided APIs, click Create Instance to open the dialog box for creating an instance of
kubernetes-nmstate. In the Name field of the dialog box, ensure the name of the instance is
nmstate.NoteThe name restriction is a known issue. The instance is a singleton for the entire cluster.
- Accept the default settings and click Create to create the instance.
1.1.2. Installing the Kubernetes NMState Operator by using the CLI
You can install the Kubernetes NMState Operator by using the OpenShift CLI (oc). After it is installed, the Operator deploys the NMState State Controller as a daemon set across all of the cluster nodes to manage the node network state and configuration.
Prerequisites
-
You have installed the OpenShift CLI (
oc). -
You are logged in as a user with
cluster-adminprivileges.
Procedure
Create the
nmstateOperator namespace:$ cat << EOF | oc apply -f - apiVersion: v1 kind: Namespace metadata: name: openshift-nmstate spec: finalizers: - kubernetes EOF
Create the
OperatorGroup:$ cat << EOF | oc apply -f - apiVersion: operators.coreos.com/v1 kind: OperatorGroup metadata: name: openshift-nmstate namespace: openshift-nmstate spec: targetNamespaces: - openshift-nmstate EOF
Subscribe to the
nmstateOperator:$ cat << EOF| oc apply -f - apiVersion: operators.coreos.com/v1alpha1 kind: Subscription metadata: name: kubernetes-nmstate-operator namespace: openshift-nmstate spec: channel: stable installPlanApproval: Automatic name: kubernetes-nmstate-operator source: redhat-operators sourceNamespace: openshift-marketplace EOF
Confirm the
ClusterServiceVersion(CSV) status for thenmstateOperator deployment equalsSucceeded:$ oc get clusterserviceversion -n openshift-nmstate \ -o custom-columns=Name:.metadata.name,Phase:.status.phase
Create an instance of the
nmstateOperator:$ cat << EOF | oc apply -f - apiVersion: nmstate.io/v1 kind: NMState metadata: name: nmstate EOF
If your cluster has problems with the DNS health check probe because of DNS connectivity issues, you can add the following DNS host name configuration to the
NMStateCRD to build in health checks that can resolve these issues:apiVersion: nmstate.io/v1 kind: NMState metadata: name: nmstate spec: probeConfiguration: dns: host: redhat.com # ...Apply the DNS host name configuration to your cluster network by running the following command. Ensure that you replace
<filename>with the name of your CRD file.$ oc apply -f <filename>.yaml
Monitor the
nmstateCRD until the resource reaches theAvailablecondition by running the following command. Ensure that you set a value for the--timeoutoption so that if theAvailablecondition is not met within this set maximum waiting time, the command times out and generates an error message.$ oc wait --for=condition=Available nmstate/nmstate --timeout=600s
Verification
Verify that all pods for the NMState Operator have the
Runningstatus by entering the following command:$ oc get pod -n openshift-nmstate
1.1.3. Viewing metrics collected by the Kubernetes NMState Operator
The Kubernetes NMState Operator, kubernetes-nmstate-operator, can collect metrics from the Kubernetes components and expose them as ready-to-use metrics.
The Kubernetes NMState Operator can collect metrics from the following Kubernetes components:
-
kubernetes_nmstate_features_applied, which tracks what NMState features are enabled and successfully applied to the cluster. -
kubernetes_nmstate_policies_status, which tracks the active status ofNodeNetworkConfigurationPolicy(NNCP) resources across the cluster. -
kubernetes_nmstate_enactments_status, which tracks the active status ofNodeNetworkConfigurationEnactment(NNCE) resources on a per-node basis.
As a use case for viewing metrics, consider a situation where you created a NodeNetworkConfigurationPolicy custom resource (CR) and you want to confirm that the policy is active.
The kubernetes_nmstate_features_applied metrics are not an API and might change between OpenShift Container Platform versions.
In the web console, the Metrics UI includes some predefined CPU, memory, bandwidth, and network packet queries for the selected project. You can run custom Prometheus Query Language (PromQL) queries for CPU, memory, bandwidth, network packet and application metrics for the project.
The following example demonstrates a NodeNetworkConfigurationPolicy manifest example that is applied to an OpenShift Container Platform cluster:
# ...
interfaces:
  - name: br1
    type: linux-bridge
    state: up
    ipv4:
      enabled: true
      dhcp: true
      dhcp-custom-hostname: foo
    bridge:
      options:
        stp:
          enabled: false
      port: []
# ...
The NodeNetworkConfigurationPolicy manifest exposes metrics and makes them available to the Cluster Monitoring Operator (CMO). The following example shows some exposed metrics:
controller_runtime_reconcile_time_seconds_bucket{controller="nodenetworkconfigurationenactment",le="0.005"} 16
controller_runtime_reconcile_time_seconds_bucket{controller="nodenetworkconfigurationenactment",le="0.01"} 16
controller_runtime_reconcile_time_seconds_bucket{controller="nodenetworkconfigurationenactment",le="0.025"} 16
...
# HELP kubernetes_nmstate_features_applied Number of nmstate features applied labeled by its name
# TYPE kubernetes_nmstate_features_applied gauge
kubernetes_nmstate_features_applied{name="dhcpv4-custom-hostname"} 1Prerequisites
-
You have installed the OpenShift CLI (
oc). - You have logged in to the web console as the administrator and installed the Kubernetes NMState Operator.
- You have access to the cluster as a developer or as a user with view permissions for the project that you are viewing metrics for.
- You have enabled monitoring for user-defined projects.
- You have deployed a service in a user-defined project.
-
You have created a
NodeNetworkConfigurationPolicymanifest and applied it to your cluster.
Starting with OpenShift Container Platform 4.19, the perspectives in the web console have unified. The Developer perspective is no longer enabled by default.
All users can interact with all OpenShift Container Platform web console features. However, if you are not the cluster owner, you might need to request permission to access certain features from the cluster owner.
You can still enable the Developer perspective. On the Getting Started pane in the web console, you can take a tour of the console, find information on setting up your cluster, view a quick start for enabling the Developer perspective, and follow links to explore new features and capabilities.
See also, "Enabling the Developer perspective in the web console".
Procedure
If you want to view the metrics from the Developer perspective in the OpenShift Container Platform web console, complete the following tasks:
- Click Observe.
-
To view the metrics of a specific project, select the project in the Project: list. For example,
openshift-nmstate. - Click the Metrics tab.
To visualize the metrics on the plot, select a query from the Select query list or create a custom PromQL query based on the selected query by selecting Show PromQL.
NoteYou can only run one query at a time with the developer role.
If you want to view the metrics in the OpenShift Container Platform web console as an administrator, complete the following tasks:
- Click Observe → Metrics.
-
Enter
kubernetes_nmstate_features_appliedin the Expression field. - Click Add query and then Run queries.
To explore the visualized metrics, do any of the following tasks:
To zoom into the plot and change the time range, do any of the following tasks:
- To visually select the time range, click and drag on the plot horizontally.
- To select the time range, use the menu which is in the upper left of the console.
- To reset the time range, select Reset zoom.
- To display the output for all the queries at a specific point in time, hold the mouse cursor on the plot at that point. The query output displays in a pop-up box.
1.2. Uninstalling the Kubernetes NMState Operator
Remove the Kubernetes NMState Operator and related resources when they are no longer needed.
You can use the Operator Lifecycle Manager (OLM) to uninstall the Kubernetes NMState Operator, but by design OLM does not delete any associated custom resource definitions (CRDs), custom resources (CRs), or API Services.
Before you uninstall the Kubernetes NMState Operator from the Subcription resource used by OLM, identify what Kubernetes NMState Operator resources to delete. This identification ensures that you can delete resources without impacting your running cluster.
If you need to reinstall the Kubernetes NMState Operator, see "Installing the Kubernetes NMState Operator by using the CLI" or "Installing the Kubernetes NMState Operator by using the web console".
Prerequisites
-
You have installed the OpenShift CLI (
oc). -
You have installed the
jqCLI tool. -
You are logged in as a user with
cluster-adminprivileges.
Procedure
Unsubscribe the Kubernetes NMState Operator from the
Subcriptionresource by running the following command:$ oc delete --namespace openshift-nmstate subscription kubernetes-nmstate-operator
Find the
ClusterServiceVersion(CSV) resource that associates with the Kubernetes NMState Operator:$ oc get --namespace openshift-nmstate clusterserviceversion
Example output that lists a CSV resource
NAME                              	  DISPLAY                   	VERSION   REPLACES     PHASE
kubernetes-nmstate-operator.v4.22.0   Kubernetes NMState Operator   4.22.0           	   Succeeded
Delete the CSV resource. After you delete the file, OLM deletes certain resources, such as
RBAC, that it created for the Operator.$ oc delete --namespace openshift-nmstate clusterserviceversion kubernetes-nmstate-operator.v4.22.0
Delete the
nmstateCR and any associatedDeploymentresources by running the following commands:$ oc -n openshift-nmstate delete nmstate nmstate
$ oc delete --all deployments --namespace=openshift-nmstate
After you deleted the
nmstateCR, remove thenmstate-console-pluginconsole plugin name from theconsole.operator.openshift.io/clusterCR.Store the position of the
nmstate-console-pluginentry that exists among the list of enable plugins by running the following command. The following command uses thejqCLI tool to store the index of the entry in an environment variable namedINDEX:INDEX=$(oc get console.operator.openshift.io cluster -o json | jq -r '.spec.plugins | to_entries[] | select(.value == "nmstate-console-plugin") | .key')
Remove the
nmstate-console-pluginentry from theconsole.operator.openshift.io/clusterCR by running the following patch command:$ oc patch console.operator.openshift.io cluster --type=json -p "[{\"op\": \"remove\", \"path\": \"/spec/plugins/$INDEX\"}]"-
INDEXis an auxiliary variable. You can specify a different name for this variable.
-
Optional: To preserve CR instances so that you can restore them after you delete CRDs, enter the following command:
$ oc get -A nncp -o yaml > cluster-nncp.yaml
ImportantTo reuse preserved CRs, such as NNCPs, you must uninstall the Kubernetes NMState Operator, reinstall the Kubernetes NMState Operator, and then run the following command to restore the CRs:
$ oc apply -f cluster-nncp.yaml
Delete all the CRDs, such as
nmstates.nmstate.io, by running the following commands:$ oc delete crd nmstates.nmstate.io
$ oc delete crd nodenetworkconfigurationenactments.nmstate.io
$ oc delete crd nodenetworkstates.nmstate.io
$ oc delete crd nodenetworkconfigurationpolicies.nmstate.io
Delete the namespace:
$ oc delete namespace openshift-nmstate
1.3. Additional resources
-
Content from nmstate.github.io is not included.
nmstate - Creating an interface on nodes
- Observing and updating the node network state and configuration
- Creating a manifest object that includes a customized br-ex bridge (Installer-provisioned infrastructure)
- Creating a manifest object that includes a customized br-ex bridge (User-provisioned infrastructure)
- Creating a manifest object that includes a customized br-ex bridge (Post-installation documentation)
Chapter 2. AWS Load Balancer Operator
2.1. AWS Load Balancer Operator release notes
The release notes for the AWS Load Balancer (ALB) Operator summarize all new features and enhancements, notable technical changes, major corrections from the previous version, and any known bugs upon general availability.
The AWS Load Balancer (ALB) Operator is only supported on the x86_64 architecture.
These release notes track the development of the AWS Load Balancer Operator in OpenShift Container Platform.
AWS Load Balancer Operator currently does not support AWS GovCloud.
Additional resources
2.1.1. AWS Load Balancer Operator 1.2.0
The AWS Load Balancer Operator 1.2.0 release notes summarize all new features and enhancements, notable technical changes, major corrections from the previous version, and any known bugs upon general availability.
The following advisory is available for the AWS Load Balancer Operator version 1.2.0:
RHEA-2025:0034 Release of AWS Load Balancer Operator 1.2.z on OperatorHub
- Notable changes
- This release supports the AWS Load Balancer Controller version 2.8.2.
-
With this release, the platform tags defined in the
Infrastructureresource are added to all AWS objects created by the controller.
2.1.2. AWS Load Balancer Operator 1.1.1
The AWS Load Balancer Operator 1.1.1 release notes summarize all new features and enhancements, notable technical changes, major corrections from the previous version, and any known bugs upon general availability.
The following advisory is available for the AWS Load Balancer Operator version 1.1.1:
2.1.3. AWS Load Balancer Operator 1.1.0
The AWS Load Balancer Operator 1.1.0 release notes summarize all new features and enhancements, notable technical changes, major corrections from the previous version, and any known bugs upon general availability.
The AWS Load Balancer Operator version 1.1.0 supports the AWS Load Balancer Controller version 2.4.4.
The following advisory is available for the AWS Load Balancer Operator version 1.1.0:
RHEA-2023:6218 Release of AWS Load Balancer Operator on OperatorHub Enhancement Advisory Update
- Notable changes
This release uses the Kubernetes API version 0.27.2.
- New features
The AWS Load Balancer Operator now supports a standardized Security Token Service (STS) flow by using the Cloud Credential Operator.
- Bug fixes
A FIPS-compliant cluster must use TLS version 1.2. Previously, webhooks for the AWS Load Balancer Controller only accepted TLS 1.3 as the minimum version, resulting in an error such as the following on a FIPS-compliant cluster:
remote error: tls: protocol version not supported
Now, the AWS Load Balancer Controller accepts TLS 1.2 as the minimum TLS version, resolving this issue. (This content is not included.OCPBUGS-14846)
2.1.4. AWS Load Balancer Operator 1.0.1
The AWS Load Balancer Operator 1.0.1 release notes summarize all new features and enhancements, notable technical changes, major corrections from the previous version, and any known bugs upon general availability.
The following advisory is available for the AWS Load Balancer Operator version 1.0.1:
2.1.5. AWS Load Balancer Operator 1.0.0
The AWS Load Balancer Operator 1.0.0 release notes summarize all new features and enhancements, notable technical changes, major corrections from the previous version, and any known bugs upon general availability.
The AWS Load Balancer Operator is now generally available with this release. The AWS Load Balancer Operator version 1.0.0 supports the AWS Load Balancer Controller version 2.4.4.
The following advisory is available for the AWS Load Balancer Operator version 1.0.0:
The AWS Load Balancer (ALB) Operator version 1.x.x cannot upgrade automatically from the Technology Preview version 0.x.x. To upgrade from an earlier version, you must uninstall the ALB operands and delete the aws-load-balancer-operator namespace.
- Notable changes
-
This release uses the new
v1API version.
-
This release uses the new
- Bug fixes
- Previously, the controller provisioned by the AWS Load Balancer Operator did not properly use the configuration for the cluster-wide proxy. These settings are now applied appropriately to the controller. (This content is not included.OCPBUGS-4052, This content is not included.OCPBUGS-5295)
2.1.6. Earlier versions
To evaluate the AWS Load Balancer Operator, use the two earliest versions, which are available as a Technology Preview. Do not use these versions in a production cluster.
For more information about the support scope of Red Hat Technology Preview features, see Technology Preview Features Support Scope.
The following advisory is available for the AWS Load Balancer Operator version 0.2.0:
The following advisory is available for the AWS Load Balancer Operator version 0.0.1:
2.2. AWS Load Balancer Operator in OpenShift Container Platform
To deploy and manage the AWS Load Balancer Controller, install the AWS Load Balancer Operator from the software catalog by using the OpenShift Container Platform web console or CLI. You can use the Operator to integrate AWS load balancers directly into your cluster infrastructure.
2.2.1. AWS Load Balancer Operator considerations
To ensure a successful deployment, review the limitations of the AWS Load Balancer Operator. Understanding these constraints helps avoid compatibility issues and ensures the Operator meets your architectural requirements before installation.
Review the following limitations before installing and using the AWS Load Balancer Operator:
- The IP traffic mode only works on AWS Elastic Kubernetes Service (EKS). The AWS Load Balancer Operator disables the IP traffic mode for the AWS Load Balancer Controller. As a result of disabling the IP traffic mode, the AWS Load Balancer Controller cannot use the pod readiness gate.
-
The AWS Load Balancer Operator adds command-line flags such as
--disable-ingress-class-annotationand--disable-ingress-group-name-annotationto the AWS Load Balancer Controller. Therefore, the AWS Load Balancer Operator does not allow using thekubernetes.io/ingress.classandalb.ingress.kubernetes.io/group.nameannotations in theIngressresource. -
The AWS Load Balancer Operator requires that the service type is
NodePortand notLoadBalancerorClusterIP.
2.2.2. Deploying the AWS Load Balancer Operator
The AWS Load Balancer Operator can tag the public subnets if the kubernetes.io/role/elb tag is missing. Also, the AWS Load Balancer Operator detects information from the underlying AWS cloud.
The AWS Load Balancer Operator detects the following information from the underlying AWS cloud:
- The ID of the virtual private cloud (VPC) on which the cluster hosting the Operator is deployed.
- Public and private subnets of the discovered VPC.
The AWS Load Balancer Operator supports the Kubernetes service resource of type LoadBalancer by using Network Load Balancer (NLB) with the instance target type only.
Procedure
To deploy the AWS Load Balancer Operator on-demand from the software catalog, create a
Subscriptionobject by running the following command:$ oc -n aws-load-balancer-operator get sub aws-load-balancer-operator --template='{{.status.installplan.name}}{{"\n"}}'Check if the status of an install plan is
Completeby running the following command:$ oc -n aws-load-balancer-operator get ip <install_plan_name> --template='{{.status.phase}}{{"\n"}}'View the status of the
aws-load-balancer-operator-controller-managerdeployment by running the following command:$ oc get -n aws-load-balancer-operator deployment/aws-load-balancer-operator-controller-manager
Example output
NAME                                           READY     UP-TO-DATE   AVAILABLE   AGE
aws-load-balancer-operator-controller-manager  1/1       1            1           23h
2.2.3. Using the AWS Load Balancer Operator in an AWS VPC cluster extended into an Outpost
You can configure the AWS Load Balancer Operator to provision an AWS Application Load Balancer in an AWS VPC cluster extended into an Outpost. AWS Outposts does not support AWS Network Load Balancers. As a result, the AWS Load Balancer Operator cannot provision Network Load Balancers in an Outpost.
You can create an AWS Application Load Balancer either in the cloud subnet or in the Outpost subnet.
An Application Load Balancer in the cloud can attach to cloud-based compute nodes. An Application Load Balancer in the Outpost can attach to edge compute nodes.
You must annotate Ingress resources with the Outpost subnet or the VPC subnet, but not both.
Prerequisites
- You have extended an AWS VPC cluster into an Outpost.
-
You have installed the OpenShift CLI (
oc). - You have installed the AWS Load Balancer Operator and created the AWS Load Balancer Controller.
Procedure
Configure the
Ingressresource to use a specified subnet:Example
Ingressresource configurationapiVersion: networking.k8s.io/v1 kind: Ingress metadata: name: <application_name> annotations: alb.ingress.kubernetes.io/subnets: <subnet_id> spec: ingressClassName: alb rules: - http: paths: - path: / pathType: Exact backend: service: name: <application_name> port: number: 80where:
<subnet_id>- Specifies the subnet to use. To use the Application Load Balancer in an Outpost, specify the Outpost subnet ID. To use the Application Load Balancer in the cloud, you must specify at least two subnets in different availability zones.
2.3. Preparing an AWS STS cluster for the AWS Load Balancer Operator
To install the Amazon Web Services (AWS) Load Balancer Operator on a cluster that uses the Security Token Service (STS), prepare the cluster by configuring the CredentialsRequest object. This ensures the Operator can bootstrap the AWS Load Balancer Controller and access the required secrets.
The AWS Load Balancer Operator waits until the required secrets are created and available.
Before you start any Security Token Service (STS) procedures, ensure that you meet the following prerequisites:
-
You installed the OpenShift CLI (
oc). You know the infrastructure ID of your cluster. To show this ID, run the following command in your CLI:
$ oc get infrastructure cluster -o=jsonpath="{.status.infrastructureName}"You know the OpenID Connect (OIDC) DNS information for your cluster. To show this information, enter the following command in your CLI:
$ oc get authentication.config cluster -o=jsonpath="{.spec.serviceAccountIssuer}"where:
{.spec.serviceAccountIssuer}-
Specifies an OIDC DNS URL. An example URL is
https://rh-oidc.s3.us-east-1.amazonaws.com/28292va7ad7mr9r4he1fb09b14t59t4f.
-
You logged into the AWS management console, navigated to IAM → Access management → Identity providers, and located the OIDC Amazon Resource Name (ARN) information. An OIDC ARN example is
arn:aws:iam::777777777777:oidc-provider/<oidc_dns_url>.
Additional resources
2.3.1. The IAM role for the AWS Load Balancer Operator
To install the Amazon Web Services (AWS) Load Balancer Operator on a cluster by using STS, configure an additional Identity and Access Management (IAM) role.
You can create the IAM role by using the following options:
-
Using the Cloud Credential Operator utility (
ccoctl) and a predefinedCredentialsRequestobject. - Using the AWS CLI and predefined AWS manifests.
Use the AWS CLI if your environment does not support the ccoctl command.
2.3.1.1. Creating an AWS IAM role by using the Cloud Credential Operator utility
To enable the AWS Load Balancer Operator to interact with subnets and VPCs, create an AWS IAM role by using the Cloud Credential Operator utility (ccoctl).
Prerequisites
-
You must extract and prepare the
ccoctlbinary.
Procedure
Download the
CredentialsRequestcustom resource (CR) and store it in a directory by running the following command:$ curl --create-dirs -o <credentials_requests_dir>/operator.yaml https://raw.githubusercontent.com/openshift/aws-load-balancer-operator/main/hack/operator-credentials-request.yaml
Use the
ccoctlutility to create an AWS IAM role by running the following command:$ ccoctl aws create-iam-roles \ --name <name> \ --region=<aws_region> \ --credentials-requests-dir=<credentials_requests_dir> \ --identity-provider-arn <oidc_arn>Example output
2023/09/12 11:38:57 Role arn:aws:iam::777777777777:role/<name>-aws-load-balancer-operator-aws-load-balancer-operator created
2023/09/12 11:38:57 Saved credentials configuration to: /home/user/<credentials_requests_dir>/manifests/aws-load-balancer-operator-aws-load-balancer-operator-credentials.yaml
2023/09/12 11:38:58 Updated Role policy for Role <name>-aws-load-balancer-operator-aws-load-balancer-operator created
where:
<name>Specifies the Amazon Resource Name (ARN) for an AWS IAM role that was created for the AWS Load Balancer Operator, such as
arn:aws:iam::777777777777:role/<name>-aws-load-balancer-operator-aws-load-balancer-operator.NoteThe length of an AWS IAM role name must be less than or equal to 12 characters.
2.3.1.2. Creating an AWS IAM role by using the AWS CLI
To enable the AWS Load Balancer Operator to interact with subnets and VPCs, create an AWS IAM role by using the AWS CLI. This enables the Operator to access and manage the necessary network resources within the cluster.
Prerequisites
-
You must have access to the AWS Command Line Interface (
aws).
Procedure
Generate a trust policy file by using your identity provider by running the following command:
$ cat <<EOF > albo-operator-trust-policy.json { "Version": "2012-10-17", "Statement": [ { "Effect": "Allow", "Principal": { "Federated": "<oidc_arn>" }, "Action": "sts:AssumeRoleWithWebIdentity", "Condition": { "StringEquals": { "<cluster_oidc_endpoint>:sub": "system:serviceaccount:aws-load-balancer-operator:aws-load-balancer-operator-controller-manager" } } } ] } EOFwhere:
<oidc_arn>-
Specifies the Amazon Resource Name (ARN) of the OIDC identity provider, such as
arn:aws:iam::777777777777:oidc-provider/rh-oidc.s3.us-east-1.amazonaws.com/28292va7ad7mr9r4he1fb09b14t59t4f. serviceaccount-
Specifies the service account for the AWS Load Balancer Controller. An example of
<cluster_oidc_endpoint>isrh-oidc.s3.us-east-1.amazonaws.com/28292va7ad7mr9r4he1fb09b14t59t4f.
Create the IAM role with the generated trust policy by running the following command:
$ aws iam create-role --role-name albo-operator --assume-role-policy-document file://albo-operator-trust-policy.json
Example output
ROLE arn:aws:iam::<aws_account_number>:role/albo-operator 2023-08-02T12:13:22Z 1 ASSUMEROLEPOLICYDOCUMENT 2012-10-17 STATEMENT sts:AssumeRoleWithWebIdentity Allow STRINGEQUALS system:serviceaccount:aws-load-balancer-operator:aws-load-balancer-controller-manager PRINCIPAL arn:aws:iam:<aws_account_number>:oidc-provider/<cluster_oidc_endpoint>where:
<aws_account_number>-
Specifies the ARN of the created AWS IAM role for the AWS Load Balancer Operator, such as
arn:aws:iam::777777777777:role/albo-operator.
Download the permission policy for the AWS Load Balancer Operator by running the following command:
$ curl -o albo-operator-permission-policy.json https://raw.githubusercontent.com/openshift/aws-load-balancer-operator/main/hack/operator-permission-policy.json
Attach the permission policy for the AWS Load Balancer Controller to the IAM role by running the following command:
$ aws iam put-role-policy --role-name albo-operator --policy-name perms-policy-albo-operator --policy-document file://albo-operator-permission-policy.json
2.3.2. Configuring the ARN role for the AWS Load Balancer Operator
You can configure the Amazon Resource Name (ARN) role for the AWS Load Balancer Operator as an environment variable. You can configure the ARN role by using the CLI.
Prerequisites
-
You have installed the OpenShift CLI (
oc).
Procedure
Create the
aws-load-balancer-operatorproject by running the following command:$ oc new-project aws-load-balancer-operator
Create the
OperatorGroupobject by running the following command:$ cat <<EOF | oc apply -f - apiVersion: operators.coreos.com/v1 kind: OperatorGroup metadata: name: aws-load-balancer-operator namespace: aws-load-balancer-operator spec: targetNamespaces: [] EOF
Create the
Subscriptionobject by running the following command:$ cat <<EOF | oc apply -f - apiVersion: operators.coreos.com/v1alpha1 kind: Subscription metadata: name: aws-load-balancer-operator namespace: aws-load-balancer-operator spec: channel: stable-v1 name: aws-load-balancer-operator source: redhat-operators sourceNamespace: openshift-marketplace config: env: - name: ROLEARN value: "<albo_role_arn>" EOFwhere:
<albo_role_arn>Specifies the ARN role to be used in the
CredentialsRequestto provision the AWS credentials for the AWS Load Balancer Operator. An example for<albo_role_arn>isarn:aws:iam::<aws_account_number>:role/albo-operator.NoteThe AWS Load Balancer Operator waits until the secret is created before moving to the
Availablestatus.
2.3.3. The IAM role for the AWS Load Balancer Controller
The CredentialsRequest object for the AWS Load Balancer Controller must be set with a manually provisioned Identity and Access Management (IAM) role.
You can create the IAM role by using the following options:
-
Using the Cloud Credential Operator utility (
ccoctl) and a predefinedCredentialsRequestobject. - Using the AWS CLI and predefined AWS manifests.
If your environment does not support the ccoctl command.ws-short CLI, use the AWS CLI.
Additional resources
2.3.3.1. Creating an AWS IAM role for the controller by using the Cloud Credential Operator utility
To enable the AWS Load Balancer Controller to interact with subnets and VPCs, create an IAM role by using the Cloud Credential Operator utility (ccoctl). This utility ensures the controller has the specific permissions required to manage network resources within the cluster.
Prerequisites
-
You must extract and prepare the
ccoctlbinary.
Procedure
Download the
CredentialsRequestcustom resource (CR) and store it in a directory by running the following command:$ curl --create-dirs -o <credentials_requests_dir>/controller.yaml https://raw.githubusercontent.com/openshift/aws-load-balancer-operator/main/hack/controller/controller-credentials-request.yaml
Use the
ccoctlutility to create an AWS IAM role by running the following command:$ ccoctl aws create-iam-roles \ --name <name> \ --region=<aws_region> \ --credentials-requests-dir=<credentials_requests_dir> \ --identity-provider-arn <oidc_arn>Example output
2023/09/12 11:38:57 Role arn:aws:iam::777777777777:role/<name>-aws-load-balancer-operator-aws-load-balancer-controller created
2023/09/12 11:38:57 Saved credentials configuration to: /home/user/<credentials_requests_dir>/manifests/aws-load-balancer-operator-aws-load-balancer-controller-credentials.yaml
2023/09/12 11:38:58 Updated Role policy for Role <name>-aws-load-balancer-operator-aws-load-balancer-controller created
where:
<name>Specifies the Amazon Resource Name (ARN) for an AWS IAM role that was created for the AWS Load Balancer Controller, such as
arn:aws:iam::777777777777:role/<name>-aws-load-balancer-operator-aws-load-balancer-controller.NoteThe length of an AWS IAM role name must be less than or equal to 12 characters.
2.3.3.2. Creating an AWS IAM role for the controller by using the AWS CLI
To enable the AWS Load Balancer Controller to interact with subnets and Virtual Private Clouds (VPCs), create an IAM role by using the AWS CLI. This ensures the controller has the specific permissions required to manage network resources within the cluster.
Prerequisites
-
You must have access to the AWS command-line interface (
aws).
Procedure
Generate a trust policy file using your identity provider by running the following command:
$ cat <<EOF > albo-controller-trust-policy.json { "Version": "2012-10-17", "Statement": [ { "Effect": "Allow", "Principal": { "Federated": "<oidc_arn>" }, "Action": "sts:AssumeRoleWithWebIdentity", "Condition": { "StringEquals": { "<cluster_oidc_endpoint>:sub": "system:serviceaccount:aws-load-balancer-operator:aws-load-balancer-operator-controller-manager" } } } ] } EOFwhere:
<oidc_arn>-
Specifies the Amazon Resource Name (ARN) of the OIDC identity provider, such as
arn:aws:iam::777777777777:oidc-provider/rh-oidc.s3.us-east-1.amazonaws.com/28292va7ad7mr9r4he1fb09b14t59t4f. serviceaccount-
Specifies the service account for the AWS Load Balancer Controller. An example of
<cluster_oidc_endpoint>isrh-oidc.s3.us-east-1.amazonaws.com/28292va7ad7mr9r4he1fb09b14t59t4f.
Create an AWS IAM role with the generated trust policy by running the following command:
$ aws iam create-role --role-name albo-controller --assume-role-policy-document file://albo-controller-trust-policy.json
Example output
ROLE arn:aws:iam::<aws_account_number>:role/albo-controller 2023-08-02T12:13:22Z 1 ASSUMEROLEPOLICYDOCUMENT 2012-10-17 STATEMENT sts:AssumeRoleWithWebIdentity Allow STRINGEQUALS system:serviceaccount:aws-load-balancer-operator:aws-load-balancer-operator-controller-manager PRINCIPAL arn:aws:iam:<aws_account_number>:oidc-provider/<cluster_oidc_endpoint>where:
<aws_account_number>-
Specifies the ARN for an AWS IAM role for the AWS Load Balancer Controller, such as
arn:aws:iam::777777777777:role/albo-controller.
Download the permission policy for the AWS Load Balancer Controller by running the following command:
$ curl -o albo-controller-permission-policy.json https://raw.githubusercontent.com/openshift/aws-load-balancer-operator/main/assets/iam-policy.json
Attach the permission policy for the AWS Load Balancer Controller to an AWS IAM role by running the following command:
$ aws iam put-role-policy --role-name albo-controller --policy-name perms-policy-albo-controller --policy-document file://albo-controller-permission-policy.json
Create a YAML file that defines the
AWSLoadBalancerControllerobject:Example
sample-aws-lb-manual-creds.yamlfileapiVersion: networking.olm.openshift.io/v1 kind: AWSLoadBalancerController metadata: name: cluster spec: credentialsRequestConfig: stsIAMRoleARN: <albc_role_arn>where:
kind-
Specifies the
AWSLoadBalancerControllerobject. metatdata.name- Specifies the AWS Load Balancer Controller name. All related resources use this instance name as a suffix.
stsIAMRoleARN-
Specifies the ARN role for the AWS Load Balancer Controller. The
CredentialsRequestobject uses this ARN role to provision the AWS credentials. An example of<albc_role_arn>isarn:aws:iam::777777777777:role/albo-controller.
2.3.4. Additional resources
2.4. Installing the AWS Load Balancer Operator
The AWS Load Balancer Operator deploys and manages the AWS Load Balancer Controller. You can install the AWS Load Balancer Operator from the software catalog by using OpenShift Container Platform web console or CLI.
2.4.1. Installing the AWS Load Balancer Operator by using the web console
To deploy the AWS Load Balancer Operator, install the Operator by using the web console. You can manage the lifecycle of the Operator by using a graphical interface.
Prerequisites
-
You have logged in to the OpenShift Container Platform web console as a user with
cluster-adminpermissions. - Your cluster is configured with AWS as the platform type and cloud provider.
- If you are using a security token service (STS) or user-provisioned infrastructure, follow the related preparation steps. For example, if you are using AWS Security Token Service, see "Preparing for the AWS Load Balancer Operator on a cluster using the AWS Security Token Service (STS)".
Procedure
- Navigate to Ecosystem → Software Catalog in the OpenShift Container Platform web console.
- Select the AWS Load Balancer Operator. You can use the Filter by keyword text box or the filter list to search for the AWS Load Balancer Operator from the list of Operators.
-
Select the
aws-load-balancer-operatornamespace. On the Install Operator page, select the following options:
- For the Update the channel option, select stable-v1.
- For the Installation mode option, select All namespaces on the cluster (default).
-
For the Installed Namespace option, select
aws-load-balancer-operator. If theaws-load-balancer-operatornamespace does not exist, it gets created during the Operator installation. - Select Update approval as Automatic or Manual. By default, the Update approval is set to Automatic. If you select automatic updates, the Operator Lifecycle Manager (OLM) automatically upgrades the running instance of your Operator without any intervention. If you select manual updates, the OLM creates an update request. As a cluster administrator, you must then manually approve that update request to have the Operator update to the newer version.
- Click Install.
Verification
- Verify that the AWS Load Balancer Operator shows the Status as Succeeded on the Installed Operators dashboard.
2.4.2. Installing the AWS Load Balancer Operator by using the CLI
To deploy the AWS Load Balancer Controller, install the AWS Load Balancer Operator by using the command-line interface (CLI).
Prerequisites
-
You are logged in to the OpenShift Container Platform web console as a user with
cluster-adminpermissions. - Your cluster is configured with AWS as the platform type and cloud provider.
-
You have logged into the OpenShift CLI (
oc).
Procedure
Create a
Namespaceobject:Create a YAML file that defines the
Namespaceobject:Example
namespace.yamlfileapiVersion: v1 kind: Namespace metadata: name: aws-load-balancer-operator # ...
Create the
Namespaceobject by running the following command:$ oc apply -f namespace.yaml
Create an
OperatorGroupobject:Create a YAML file that defines the
OperatorGroupobject:Example
operatorgroup.yamlfileapiVersion: operators.coreos.com/v1 kind: OperatorGroup metadata: name: aws-lb-operatorgroup namespace: aws-load-balancer-operator spec: upgradeStrategy: Default
Create the
OperatorGroupobject by running the following command:$ oc apply -f operatorgroup.yaml
Create a
Subscriptionobject:Create a YAML file that defines the
Subscriptionobject:Example
subscription.yamlfileapiVersion: operators.coreos.com/v1alpha1 kind: Subscription metadata: name: aws-load-balancer-operator namespace: aws-load-balancer-operator spec: channel: stable-v1 installPlanApproval: Automatic name: aws-load-balancer-operator source: redhat-operators sourceNamespace: openshift-marketplace
Create the
Subscriptionobject by running the following command:$ oc apply -f subscription.yaml
Verification
Get the name of the install plan from the subscription:
$ oc -n aws-load-balancer-operator \ get subscription aws-load-balancer-operator \ --template='{{.status.installplan.name}}{{"\n"}}'Check the status of the install plan:
$ oc -n aws-load-balancer-operator \ get ip <install_plan_name> \ --template='{{.status.phase}}{{"\n"}}'The output must be
Complete.
2.4.3. Creating the AWS Load Balancer Controller
You can install only a single instance of the AWSLoadBalancerController object in a cluster. You can create the AWS Load Balancer Controller by using CLI. The AWS Load Balancer Operator reconciles only the cluster named resource.
Prerequisites
-
You have created the
echoservernamespace. -
You have access to the OpenShift CLI (
oc).
Procedure
Create a YAML file that defines the
AWSLoadBalancerControllerobject:Example
sample-aws-lb.yamlfileapiVersion: networking.olm.openshift.io/v1 kind: AWSLoadBalancerController metadata: name: cluster spec: subnetTagging: Auto additionalResourceTags: - key: example.org/security-scope value: staging ingressClass: alb config: replicas: 2 enabledAddons: - AWSWAFv2where:
kind-
Specifies the
AWSLoadBalancerControllerobject. metadata.name- Specifies the AWS Load Balancer Controller name. The Operator adds this instance name as a suffix to all related resources.
spec.subnetTaggingSpecifies the subnet tagging method for the AWS Load Balancer Controller. The following values are valid:
-
Auto: The AWS Load Balancer Operator determines the subnets that belong to the cluster and tags them appropriately. The Operator cannot determine the role correctly if the internal subnet tags are not present on internal subnet. -
Manual: You manually tag the subnets that belong to the cluster with the appropriate role tags. Use this option if you installed your cluster on user-provided infrastructure.
-
spec.additionalResourceTags- Specifies the tags used by the AWS Load Balancer Controller when it provisions AWS resources.
ingressClass-
Specifies the ingress class name. The default value is
alb. config.replicas- Specifies the number of replicas of the AWS Load Balancer Controller.
enabledAddons- Specifies annotations as an add-on for the AWS Load Balancer Controller.
AWSWAFv2-
Specifies that enablement of the
alb.ingress.kubernetes.io/wafv2-acl-arnannotation.
Create the
AWSLoadBalancerControllerobject by running the following command:$ oc create -f sample-aws-lb.yaml
Create a YAML file that defines the
Deploymentresource:Example
sample-aws-lb.yamlfileapiVersion: apps/v1 kind: Deployment metadata: name: <echoserver> namespace: echoserver spec: selector: matchLabels: app: echoserver replicas: 3 template: metadata: labels: app: echoserver spec: containers: - image: openshift/origin-node command: - "/bin/socat" args: - TCP4-LISTEN:8080,reuseaddr,fork - EXEC:'/bin/bash -c \"printf \\\"HTTP/1.0 200 OK\r\n\r\n\\\"; sed -e \\\"/^\r/q\\\"\"' imagePullPolicy: Always name: echoserver ports: - containerPort: 8080where:
kind- Specifies the deployment resource.
metadata.name- Specifies the deployment name.
spec.replicas- Specifies the number of replicas of the deployment.
Create a YAML file that defines the
Serviceresource:Example
service-albo.yamlfileapiVersion: v1 kind: Service metadata: name: <echoserver> namespace: echoserver spec: ports: - port: 80 targetPort: 8080 protocol: TCP type: NodePort selector: app: echoserverwhere:
apiVersion- Specifies the service resource.
metadata.name- Specifies the service name.
Create a YAML file that defines the
Ingressresource:Example
ingress-albo.yamlfileapiVersion: networking.k8s.io/v1 kind: Ingress metadata: name: <name> namespace: echoserver annotations: alb.ingress.kubernetes.io/scheme: internet-facing alb.ingress.kubernetes.io/target-type: instance spec: ingressClassName: alb rules: - http: paths: - path: / pathType: Exact backend: service: name: <echoserver> port: number: 80where:
metadata.name-
Specifies a name for the
Ingressresource. service.name- Specifies the service name.
Verification
Save the status of the
Ingressresource in theHOSTvariable by running the following command:$ HOST=$(oc get ingress -n echoserver echoserver --template='{{(index .status.loadBalancer.ingress 0).hostname}}')Verify the status of the
Ingressresource by running the following command:$ curl $HOST
2.5. Configuring the AWS Load Balancer Operator
To automate the provisioning of AWS Load Balancers for your applications, configure the AWS Load Balancer Operator. This setup ensures that the Operator correctly manages ingress resources and external access to your cluster.
2.5.1. Trusting the certificate authority of the cluster-wide proxy
You can configure the cluster-wide proxy in the AWS Load Balancer Operator. After configuring the cluster-wide proxy, Operator Lifecycle Manager (OLM) automatically updates all the deployments of the Operators with the environment variables.
Environment variables include HTTP_PROXY, HTTPS_PROXY, and NO_PROXY. These variables are populated to the managed controller by the AWS Load Balancer Operator.
Procedure
Create the config map to contain the certificate authority (CA) bundle in the
aws-load-balancer-operatornamespace by running the following command:$ oc -n aws-load-balancer-operator create configmap trusted-ca
To inject the trusted CA bundle into the config map, add the
config.openshift.io/inject-trusted-cabundle=truelabel to the config map by running the following command:$ oc -n aws-load-balancer-operator label cm trusted-ca config.openshift.io/inject-trusted-cabundle=true
Update the AWS Load Balancer Operator subscription to access the config map in the AWS Load Balancer Operator deployment by running the following command:
$ oc -n aws-load-balancer-operator patch subscription aws-load-balancer-operator --type='merge' -p '{"spec":{"config":{"env":[{"name":"TRUSTED_CA_CONFIGMAP_NAME","value":"trusted-ca"}],"volumes":[{"name":"trusted-ca","configMap":{"name":"trusted-ca"}}],"volumeMounts":[{"name":"trusted-ca","mountPath":"/etc/pki/tls/certs/albo-tls-ca-bundle.crt","subPath":"ca-bundle.crt"}]}}}'After the AWS Load Balancer Operator is deployed, verify that the CA bundle is added to the
aws-load-balancer-operator-controller-managerdeployment by running the following command:$ oc -n aws-load-balancer-operator exec deploy/aws-load-balancer-operator-controller-manager -c manager -- bash -c "ls -l /etc/pki/tls/certs/albo-tls-ca-bundle.crt; printenv TRUSTED_CA_CONFIGMAP_NAME"
Example output
-rw-r--r--. 1 root 1000690000 5875 Jan 11 12:25 /etc/pki/tls/certs/albo-tls-ca-bundle.crt
trusted-ca
Optional: Restart deployment of the AWS Load Balancer Operator every time the config map changes by running the following command:
$ oc -n aws-load-balancer-operator rollout restart deployment/aws-load-balancer-operator-controller-manager
Additional resources
2.5.2. Adding TLS termination on the AWS Load Balancer
You can route the traffic for the domain to pods of a service and add TLS termination on the AWS Load Balancer.
Prerequisites
-
You have access to the OpenShift CLI (
oc).
Procedure
Create a YAML file that defines the
AWSLoadBalancerControllerresource:Example
add-tls-termination-albc.yamlfileapiVersion: networking.olm.openshift.io/v1 kind: AWSLoadBalancerController metadata: name: cluster spec: subnetTagging: Auto ingressClass: tls-termination # ...
where:
spec.ingressClass-
Specifies the ingress class name. If the ingress class is not present in your cluster the AWS Load Balancer Controller creates one. The AWS Load Balancer Controller reconciles the additional ingress class values if
spec.controlleris set toingress.k8s.aws/alb.
Create a YAML file that defines the
Ingressresource:Example
add-tls-termination-ingress.yamlfileapiVersion: networking.k8s.io/v1 kind: Ingress metadata: name: <example> annotations: alb.ingress.kubernetes.io/scheme: internet-facing alb.ingress.kubernetes.io/certificate-arn: arn:aws:acm:us-west-2:xxxxx spec: ingressClassName: tls-termination rules: - host: example.com http: paths: - path: / pathType: Exact backend: service: name: <example_service> port: number: 80 # ...where:
metadata.name- Specifies the ingress name.
annotations.alb.ingress.kubernetes.io/scheme- Specifies the controller that provisions the load balancer for ingress. The provisioning happens in a public subnet to access the load balancer over the internet.
annotations.alb.ingress.kubernetes.io/certificate-arn- Specifies the Amazon Resource Name (ARN) of the certificate that you attach to the load balancer.
spec.ingressClassName- Specifies the ingress class name.
rules.host- Specifies the domain for traffic routing.
backend.service- Specifies the service for traffic routing.
2.5.3. Creating multiple ingress resources through a single AWS Load Balancer
To route traffic to different services within a single domain, configure multiple ingress resources on a single AWS Load Balancer. This setup allows each resource to provide different endpoints while sharing the same load balancing infrastructure.
Prerequisites
-
You have access to the OpenShift CLI (
oc).
Procedure
Create an
IngressClassParamsresource YAML file, for example,sample-single-lb-params.yaml, as follows:apiVersion: elbv2.k8s.aws/v1beta1 kind: IngressClassParams metadata: name: single-lb-params spec: group: name: single-lbwhere:
apiVersion-
Specifies the API group and version of the
IngressClassParamsresource. metadata.name-
Specifies the
IngressClassParamsresource name. spec.group.name-
Specifies the
IngressGroupresource name. All of theIngressresources of this class belong to thisIngressGroup.
Create the
IngressClassParamsresource by running the following command:$ oc create -f sample-single-lb-params.yaml
Create the
IngressClassresource YAML file, for example,sample-single-lb-class.yaml, as follows:apiVersion: networking.k8s.io/v1 kind: IngressClass metadata: name: single-lb spec: controller: ingress.k8s.aws/alb parameters: apiGroup: elbv2.k8s.aws kind: IngressClassParams name: single-lb-paramswhere:
apiVersion-
Specifies the API group and version of the
IngressClassresource. metadata.name- Specifies the ingress class name.
spec.controller-
Specifies the controller name. The
ingress.k8s.aws/albvalue denotes that all ingress resources of this class should be managed by the AWS Load Balancer Controller. parameters.apiGroup-
Specifies the API group of the
IngressClassParamsresource. parameters.kind-
Specifies the resource type of the
IngressClassParamsresource. parameters.name-
Specifies the
IngressClassParamsresource name.
Create the
IngressClassresource by running the following command:$ oc create -f sample-single-lb-class.yaml
Create the
AWSLoadBalancerControllerresource YAML file, for example,sample-single-lb.yaml, as follows:apiVersion: networking.olm.openshift.io/v1 kind: AWSLoadBalancerController metadata: name: cluster spec: subnetTagging: Auto ingressClass: single-lb
where:
spec.ingressClass-
Specifies the name of the
IngressClassresource.
Create the
AWSLoadBalancerControllerresource by running the following command:$ oc create -f sample-single-lb.yaml
Create the
Ingressresource YAML file, for example,sample-multiple-ingress.yaml, as follows:apiVersion: networking.k8s.io/v1 kind: Ingress metadata: name: example-1 annotations: alb.ingress.kubernetes.io/scheme: internet-facing alb.ingress.kubernetes.io/group.order: "1" alb.ingress.kubernetes.io/target-type: instance spec: ingressClassName: single-lb rules: - host: example.com http: paths: - path: /blog pathType: Prefix backend: service: name: example-1 port: number: 80 --- apiVersion: networking.k8s.io/v1 kind: Ingress metadata: name: example-2 annotations: alb.ingress.kubernetes.io/scheme: internet-facing alb.ingress.kubernetes.io/group.order: "2" alb.ingress.kubernetes.io/target-type: instance spec: ingressClassName: single-lb rules: - host: example.com http: paths: - path: /store pathType: Prefix backend: service: name: example-2 port: number: 80 --- apiVersion: networking.k8s.io/v1 kind: Ingress metadata: name: example-3 annotations: alb.ingress.kubernetes.io/scheme: internet-facing alb.ingress.kubernetes.io/group.order: "3" alb.ingress.kubernetes.io/target-type: instance spec: ingressClassName: single-lb rules: - host: example.com http: paths: - path: / pathType: Prefix backend: service: name: example-3 port: number: 80where:
metadata.name- Specifies the ingress name.
alb.ingress.kubernetes.io/scheme- Specifies the load balancer to provision in the public subnet to access the internet.
alb.ingress.kubernetes.io/group.order- Specifies the order in which the rules from the multiple ingress resources are matched when the request is received at the load balancer.
alb.ingress.kubernetes.io/target-type- Specifies that the load balancer will target OpenShift Container Platform nodes to reach the service.
spec.ingressClassName- Specifies the ingress class that belongs to this ingress.
rules.host- Specifies a domain name used for request routing.
http.paths.path- Specifies the path that must route to the service.
backend.service.name-
Specifies the service name that serves the endpoint configured in the
Ingressresource. port.number- Specifies the port on the service that serves the endpoint.
Create the
Ingressresource by running the following command:$ oc create -f sample-multiple-ingress.yaml
2.5.4. AWS Load Balancer Operator logs
To troubleshoot the AWS Load Balancer Operator, view the logs using the oc logs command. By viewing the logs, you can diagnose issues and monitor the activity of the Operator.
Procedure
View the logs of the AWS Load Balancer Operator by running the following command:
$ oc logs -n aws-load-balancer-operator deployment/aws-load-balancer-operator-controller-manager -c manager
Chapter 3. eBPF manager Operator
3.1. About the eBPF Manager Operator
You can use the eBPF Manager Operator to centralize and secure the deployment of eBPF programs in a Kubernetes cluster. The eBPF Manager Operator streamlines lifecycle management and provides system-wide visibility so that you can focus on program interaction rather than manual configuration.
eBPF Manager Operator is a Technology Preview feature only. Technology Preview features are not supported with Red Hat production service level agreements (SLAs) and might not be functionally complete. Red Hat does not recommend using them in production. These features provide early access to upcoming product features, enabling customers to test functionality and provide feedback during the development process.
For more information about the support scope of Red Hat Technology Preview features, see Technology Preview Features Support Scope.
3.1.1. About Extended Berkeley Packet Filter (eBPF)
eBPF extends the original Berkeley Packet Filter for advanced network traffic filtering. It acts as a virtual machine inside the Linux kernel, allowing you to run sandboxed programs in response to events such as network packets, system calls, or kernel functions.
3.1.2. About the eBPF Manager Operator
eBPF Manager simplifies the management and deployment of eBPF programs within Kubernetes, as well as enhancing the security around using eBPF programs. It utilizes Kubernetes custom resource definitions (CRDs) to manage eBPF programs packaged as OCI container images. This approach helps to delineate deployment permissions and enhance security by restricting program types deployable by specific users.
eBPF Manager is a software stack designed to manage eBPF programs within Kubernetes. It facilitates the loading, unloading, modifying, and monitoring of eBPF programs in Kubernetes clusters. It includes a daemon, CRDs, an agent, and an operator:
- bpfman
- A system daemon that manages eBPF programs via a gRPC API.
- eBPF CRDs
- A set of CRDs like XdpProgram and TcProgram for loading eBPF programs, and a bpfman-generated CRD (BpfProgram) for representing the state of loaded programs.
- bpfman-agent
- Runs within a daemonset container, ensuring eBPF programs on each node are in the desired state.
- bpfman-operator
- Manages the lifecycle of the bpfman-agent and CRDs in the cluster using the Operator SDK.
The eBPF Manager Operator offers the following features:
- Enhances security by centralizing eBPF program loading through a controlled daemon. eBPF Manager has the elevated privileges so the applications don’t need to be. eBPF program control is regulated by standard Kubernetes Role-based access control (RBAC), which can allow or deny an application’s access to the different eBPF Manager CRDs that manage eBPF program loading and unloading.
- Provides detailed visibility into active eBPF programs, improving your ability to debug issues across the system.
- Facilitates the coexistence of multiple eBPF programs from different sources using protocols like libxdp for XDP and TC programs, enhancing interoperability.
- Streamlines the deployment and lifecycle management of eBPF programs in Kubernetes. Developers can focus on program interaction rather than lifecycle management, with support for existing eBPF libraries like Cilium, libbpf, and Aya.
3.1.3. Additional resources
3.2. Installing the eBPF Manager Operator
To manage eBPF programs across your cluster nodes, you can install the eBPF Manager Operator by using the OpenShift Container Platform CLI or the web console. This Operator provides a standardized way to deploy, monitor, and secure eBPF-based networking and observability tools.
eBPF Manager Operator is a Technology Preview feature only. Technology Preview features are not supported with Red Hat production service level agreements (SLAs) and might not be functionally complete. Red Hat does not recommend using them in production. These features provide early access to upcoming product features, enabling customers to test functionality and provide feedback during the development process.
For more information about the support scope of Red Hat Technology Preview features, see Technology Preview Features Support Scope.
3.2.1. Installing the eBPF Manager Operator using the CLI
To manage eBPF programs across your cluster nodes, you can install the eBPF Manager Operator by using the OpenShift Container Platform CLI. This process involves creating a dedicated namespace and subscribing to the Operator to enable node-level networking and observability tools.
Prerequisites
-
You have installed the OpenShift CLI (
oc). - You have an account with administrator privileges.
Procedure
To create the
bpfmannamespace, enter the following command:$ cat << EOF| oc create -f - apiVersion: v1 kind: Namespace metadata: labels: pod-security.kubernetes.io/enforce: privileged pod-security.kubernetes.io/enforce-version: v1.24 name: bpfman EOFTo create an
OperatorGroupCR, enter the following command:$ cat << EOF| oc create -f - apiVersion: operators.coreos.com/v1 kind: OperatorGroup metadata: name: bpfman-operators namespace: bpfman EOF
Subscribe to the eBPF Manager Operator.
To create a
SubscriptionCR for the eBPF Manager Operator, enter the following command:$ cat << EOF| oc create -f - apiVersion: operators.coreos.com/v1alpha1 kind: Subscription metadata: name: bpfman-operator namespace: bpfman spec: name: bpfman-operator channel: alpha source: community-operators sourceNamespace: openshift-marketplace EOF
To verify that the Operator is installed, enter the following command:
$ oc get ip -n bpfman
Example output
NAME            CSV                                 APPROVAL    APPROVED
install-ppjxl   security-profiles-operator.v0.8.5   Automatic   true
To verify the version of the Operator, enter the following command:
$ oc get csv -n bpfman
Example output
NAME                                DISPLAY                      VERSION   REPLACES                            PHASE
bpfman-operator.v0.5.0              eBPF Manager Operator              0.5.0     bpfman-operator.v0.4.2              Succeeded
3.2.2. Installing the eBPF Manager Operator using the web console
To manage eBPF programs across your cluster nodes, you can install the eBPF Manager Operator by using the OpenShift Container Platform web console. You can use the eBPF Manager Operator to enable node-level networking and observability tools through the OperatorHub interface.
Prerequisites
-
You have installed the OpenShift CLI (
oc). - You have an account with administrator privileges.
Procedure
Install the eBPF Manager Operator:
- In the OpenShift Container Platform web console, click Ecosystem → Software Catalog.
- Select eBPF Manager Operator from the list of available Operators, and if prompted to Show community Operator, click Continue.
- Click Install.
- On the Install Operator page, under Installed Namespace, select Operator recommended Namespace.
- Click Install.
Verify that the eBPF Manager Operator is installed successfully:
- Navigate to the Ecosystem → Installed Operators page.
Ensure that eBPF Manager Operator is listed in the openshift-ingress-node-firewall project with a Status of InstallSucceeded.
NoteDuring installation an Operator might display a Failed status. If the installation later succeeds with an InstallSucceeded message, you can ignore the Failed message.
If the Operator does not have a Status of InstallSucceeded, troubleshoot using the following steps:
- Inspect the Operator Subscriptions and Install Plans tabs for any failures or errors under Status.
-
Navigate to the Workloads → Pods page and check the logs for pods in the
bpfmanproject.
3.3. Deploying an eBPF program
As a cluster administrator, you can deploy containerized eBPF applications by using the eBPF Manager Operator. This process involves loading an eBPF program through a custom resource and deploying a user-space daemon set that accesses eBPF maps without requiring privileged permissions.
As a cluster administrator, you can deploy containerized eBPF applications with the eBPF Manager Operator.
For the example eBPF program deployed in this procedure, the sample manifest does the following:
First, it creates basic Kubernetes objects like Namespace, ServiceAccount, and ClusterRoleBinding. It also creates a XdpProgram object, which is a custom resource definition (CRD) that eBPF Manager provides, that loads the eBPF XDP program. Each program type has it’s own CRD, but they are similar in what they do. For more information, see Content from bpfman.io is not included.Loading eBPF Programs On Kubernetes.
Second, it creates a daemon set which runs a user space program that reads the eBPF maps that the eBPF program is populating. This eBPF map is volume mounted using a Container Storage Interface (CSI) driver. By volume mounting the eBPF map in the container in lieu of accessing it on the host, the application pod can access the eBPF maps without being privileged. For more information on how the CSI is configured, see See Content from bpfman.io is not included.Deploying an eBPF enabled application On Kubernetes.
eBPF Manager Operator is a Technology Preview feature only. Technology Preview features are not supported with Red Hat production service level agreements (SLAs) and might not be functionally complete. Red Hat does not recommend using them in production. These features provide early access to upcoming product features, enabling customers to test functionality and provide feedback during the development process.
For more information about the support scope of Red Hat Technology Preview features, see Technology Preview Features Support Scope.
3.3.1. Deploying a containerized eBPF program
To run custom networking or security logic on your cluster nodes, you can deploy containerized eBPF programs. You can use containerized eBPF programs to monitor kernel events and manage network traffic efficiently at the node level.
As a cluster administrator, you can deploy an eBPF program to nodes on your cluster. In this procedure, a sample containerized eBPF program is installed in the go-xdp-counter namespace.
Prerequisites
-
You have installed the OpenShift CLI (
oc). - You have an account with administrator privileges.
- You have installed the eBPF Manager Operator.
Procedure
To download the manifest, enter the following command:
$ curl -L https://github.com/bpfman/bpfman/releases/download/v0.5.1/go-xdp-counter-install-selinux.yaml -o go-xdp-counter-install-selinux.yaml
To deploy the sample eBPF application, enter the following command:
$ oc create -f go-xdp-counter-install-selinux.yaml
Example output
namespace/go-xdp-counter created
serviceaccount/bpfman-app-go-xdp-counter created
clusterrolebinding.rbac.authorization.k8s.io/xdp-binding created
daemonset.apps/go-xdp-counter-ds created
xdpprogram.bpfman.io/go-xdp-counter-example created
selinuxprofile.security-profiles-operator.x-k8s.io/bpfman-secure created
To confirm that the eBPF sample application deployed successfully, enter the following command:
$ oc get all -o wide -n go-xdp-counter
Example output
NAME                          READY   STATUS    RESTARTS   AGE   IP             NODE                                 NOMINATED NODE   READINESS GATES
pod/go-xdp-counter-ds-4m9cw   1/1     Running   0          44s   10.129.0.92    ci-ln-dcbq7d2-72292-ztrkp-master-1   <none>           <none>
pod/go-xdp-counter-ds-7hzww   1/1     Running   0          44s   10.130.0.86    ci-ln-dcbq7d2-72292-ztrkp-master-2   <none>           <none>
pod/go-xdp-counter-ds-qm9zx   1/1     Running   0          44s   10.128.0.101   ci-ln-dcbq7d2-72292-ztrkp-master-0   <none>           <none>

NAME                               DESIRED   CURRENT   READY   UP-TO-DATE   AVAILABLE   NODE SELECTOR   AGE   CONTAINERS       IMAGES                                           SELECTOR
daemonset.apps/go-xdp-counter-ds   3         3         3       3            3           <none>          44s   go-xdp-counter   quay.io/bpfman-userspace/go-xdp-counter:v0.5.0   name=go-xdp-counter
To confirm that the example XDP program is running, enter the following command:
$ oc get xdpprogram go-xdp-counter-example
Example output
NAME BPFFUNCTIONNAME NODESELECTOR STATUS go-xdp-counter-example xdp_stats {} ReconcileSuccessTo confirm that the XDP program is collecting data, enter the following command:
$ oc logs <pod_name> -n go-xdp-counter
Replace
<pod_name>with the name of an XDP program pod, such asgo-xdp-counter-ds-4m9cw.Example output
2024/08/13 15:20:06 15016 packets received
2024/08/13 15:20:06 93581579 bytes received
...
Chapter 4. External DNS Operator
4.1. External DNS Operator release notes
The External DNS Operator deploys and manages ExternalDNS to provide name resolution for services and routes. This enables your external DNS provider to resolve hostnames directly to OpenShift Container Platform resources.
The External DNS Operator is only supported on the x86_64 architecture.
These release notes track the development of the External DNS Operator in OpenShift Container Platform.
4.1.1. External DNS Operator 1.3
The External DNS Operator 1.3 release notes summarize all new features and enhancements, notable technical changes, major corrections from previous versions, and any known bugs upon general availability.
- External DNS Operator 1.3.3
The following advisory is available for the External DNS Operator version 1.3.3:
- External DNS Operator 1.3.2
The following advisory is available for the External DNS Operator version 1.3.2:
- External DNS Operator 1.3.1
The following advisory is available for the External DNS Operator version 1.3.1:
RHEA-2025:15598 Product Enhancement Advisory
This update includes improved container security.
- External DNS Operator 1.3.0
The following advisory is available for the External DNS Operator version 1.3.0:
RHEA-2024:8550 Product Enhancement Advisory
This update includes a rebase to the 0.14.2 version of the upstream project.
Bug fixes:
- Previously, the ExternalDNS Operator could not deploy operands on HCP clusters. With this release, the Operator deploys operands in a running and ready state. (This content is not included.OCPBUGS-37059)
- Previously, the ExternalDNS Operator was not using RHEL 9 as its building or base images. With this release, RHEL9 is the base. (This content is not included.OCPBUGS-41683)
- Previously, the godoc had a broken link for Infoblox provider. With this release, the godoc is revised for accuracy. Some links are removed while some other are replaced with GitHub permalinks. (This content is not included.OCPBUGS-36797)
4.1.2. External DNS Operator 1.2
The External DNS Operator 1.2 release notes summarize all new features and enhancements, notable technical changes, major corrections from previous versions, and any known bugs upon general availability.
- External DNS Operator 1.2.0
The following advisory is available for the External DNS Operator version 1.2.0:
RHEA-2022:5867 ExternalDNS Operator 1.2 operator/operand containers
New features:
The External DNS Operator now supports AWS shared VPC. For more information, see "Creating DNS records in a different AWS Account using a shared VPC".
Bug fixes:
-
The update strategy for the operand changed from
RollingtoRecreate. (This content is not included.OCPBUGS-3630)
Additional resources
4.1.3. External DNS Operator 1.1
The External DNS Operator 1.1 release notes summarize all new features and enhancements, notable technical changes, major corrections from previous versions, and any known bugs upon general availability.
- External DNS Operator 1.1.1
The following advisory is available for the External DNS Operator version 1.1.1:
- External DNS Operator 1.1.0
This release included a rebase of the operand from the upstream project version 0.13.1. The following advisory is available for the External DNS Operator version 1.1.0:
RHEA-2022:9086-01 ExternalDNS Operator 1.1 operator/operand containers
Bug fixes:
-
Previously, the ExternalDNS Operator enforced an empty
defaultModevalue for volumes, which caused constant updates due to a conflict with the OpenShift API. Now, thedefaultModevalue is not enforced and operand deployment does not update constantly. (This content is not included.OCPBUGS-2793)
4.1.4. External DNS Operator 1.0
The External DNS Operator 1.0 release notes summarize all new features and enhancements, notable technical changes, major corrections from previous versions, and any known bugs upon general availability.
- External DNS Operator 1.0.1
The following advisory is available for the External DNS Operator version 1.0.1:
- External DNS Operator 1.0.0
The following advisory is available for the External DNS Operator version 1.0.0:
RHEA-2022:5867 ExternalDNS Operator 1.0 operator/operand containers
Bug fixes:
- Previously, the External DNS Operator issued a warning about the violation of the restricted SCC policy during ExternalDNS operand pod deployments. This issue has been resolved. (This content is not included.BZ#2086408)
4.2. Understanding the External DNS Operator
The External DNS Operator deploys and manages ExternalDNS to provide the name resolution for services and routes from the external DNS provider to OpenShift Container Platform.
4.2.1. External DNS Operator domain name limitations
To prevent configuration errors when deploying the ExternalDNS resource, review the domain name limitations enforced by the External DNS Operator. Understanding these constraints ensures that your requested hostnames and domains are compatible with your underlying DNS provider.
The External DNS Operator uses the TXT registry that adds the prefix for TXT records. This reduces the maximum length of the domain name for TXT records. A DNS record cannot be present without a corresponding TXT record, so the domain name of the DNS record must follow the same limit as the TXT records. For example, a DNS record of <domain_name_from_source> results in a TXT record of external-dns-<record_type>-<domain_name_from_source>.
The domain name of the DNS records generated by the External DNS Operator has the following limitations:
| Record type | Number of characters |
|---|---|
| CNAME | 44 |
| Wildcard CNAME records on AzureDNS | 42 |
| A | 48 |
| Wildcard A records on AzureDNS | 46 |
The following error shows in the External DNS Operator logs if the generated domain name exceeds any of the domain name limitations:
time="2022-09-02T08:53:57Z" level=error msg="Failure in zone test.example.io. [Id: /hostedzone/Z06988883Q0H0RL6UMXXX]"
time="2022-09-02T08:53:57Z" level=error msg="InvalidChangeBatch: [FATAL problem: DomainLabelTooLong (Domain label is too long) encountered with 'external-dns-a-hello-openshift-aaaaaaaaaa-bbbbbbbbbb-ccccccc']\n\tstatus code: 400, request id: e54dfd5a-06c6-47b0-bcb9-a4f7c3a4e0c6"
4.2.2. Deploying the External DNS Operator
The External DNS Operator implements the External DNS API from the olm.openshift.io API group. The External DNS Operator updates services, routes, and external DNS providers.
Prerequisites
-
You have installed the
yqCLI tool.
Procedure
Check the name of an install plan, such as
install-zcvlr, by running the following command:$ oc -n external-dns-operator get sub external-dns-operator -o yaml | yq '.status.installplan.name'
Check if the status of an install plan is
Completeby running the following command:$ oc -n external-dns-operator get ip <install_plan_name> -o yaml | yq '.status.phase'
View the status of the
external-dns-operatordeployment by running the following command:$ oc get -n external-dns-operator deployment/external-dns-operator
Example output
NAME                    READY     UP-TO-DATE   AVAILABLE   AGE
external-dns-operator   1/1       1            1           23h
4.2.3. Viewing External DNS Operator logs
To troubleshoot DNS configuration issues, view the External DNS Operator logs. Use the oc logs command to retrieve diagnostic information directly from the Operator pod.
Procedure
View the logs of the External DNS Operator by running the following command:
$ oc logs -n external-dns-operator deployment/external-dns-operator -c external-dns-operator
4.3. Installing the External DNS Operator
To manage DNS records on your cloud infrastructure, install the External DNS Operator. This Operator supports deployment on major cloud providers, including Amazon Web Services (AWS), Microsoft Azure, and Google Cloud.
4.3.1. Installing the External DNS Operator with the Software Catalog
You can install the External DNS Operator by using the OpenShift Container Platform Software Catalog. You can then manage the Operator lifecycle directly from the web console.
Procedure
- Click Ecosystem → Software Catalog in the OpenShift Container Platform web console.
- Click External DNS Operator. You can use the Filter by keyword text box or the filter list to search for External DNS Operator from the list of Operators.
-
Select the
external-dns-operatornamespace. - On the External DNS Operator page, click Install.
On the Install Operator page, ensure that you selected the following options:
- Update the channel as stable-v1.
- Installation mode as A specific name on the cluster.
-
Installed namespace as
external-dns-operator. If namespaceexternal-dns-operatordoes not exist, the Operator gets created during the Operator installation. - Select Approval Strategy as Automatic or Manual. The Approval Strategy defaults to Automatic.
Click Install.
If you select Automatic updates, the Operator Lifecycle Manager (OLM) automatically upgrades the running instance of your Operator without any intervention.
If you select Manual updates, the OLM creates an update request. As a cluster administrator, you must then manually approve that update request to have the Operator updated to the new version.
Verification
- Verify that the External DNS Operator shows the Status as Succeeded on the Installed Operators dashboard.
4.3.2. Installing the External DNS Operator by using the CLI
You can use the OpenShift CLI (oc) to install the External DNS Operator. The Operator manages the installation process directly from your terminal without you having to use the web console.
Prerequisites
-
You are logged in to the OpenShift CLI (
oc).
Procedure
Create a
Namespaceobject:Create a YAML file that defines the
Namespaceobject:Example
namespace.yamlfileapiVersion: v1 kind: Namespace metadata: name: external-dns-operator # ...
Create the
Namespaceobject by running the following command:$ oc apply -f namespace.yaml
Create an
OperatorGroupobject:Create a YAML file that defines the
OperatorGroupobject:Example
operatorgroup.yamlfileapiVersion: operators.coreos.com/v1 kind: OperatorGroup metadata: name: external-dns-operator namespace: external-dns-operator spec: upgradeStrategy: Default targetNamespaces: - external-dns-operator # ...
Create the
OperatorGroupobject by running the following command:$ oc apply -f operatorgroup.yaml
Create a
Subscriptionobject:Create a YAML file that defines the
Subscriptionobject:Example
subscription.yamlfileapiVersion: operators.coreos.com/v1alpha1 kind: Subscription metadata: name: external-dns-operator namespace: external-dns-operator spec: channel: stable-v1 installPlanApproval: Automatic name: external-dns-operator source: redhat-operators sourceNamespace: openshift-marketplace # ...
Create the
Subscriptionobject by running the following command:$ oc apply -f subscription.yaml
Verification
Get the name of the install plan from the subscription by running the following command:
$ oc -n external-dns-operator \ get subscription external-dns-operator \ --template='{{.status.installplan.name}}{{"\n"}}'Verify that the status of the install plan is
Completeby running the following command:$ oc -n external-dns-operator \ get ip <install_plan_name> \ --template='{{.status.phase}}{{"\n"}}'Verify that the status of the
external-dns-operatorpod isRunningby running the following command:$ oc -n external-dns-operator get pod
Example output
NAME                                     READY   STATUS    RESTARTS   AGE
external-dns-operator-5584585fd7-5lwqm   2/2     Running   0          11m
Verify that the catalog source of the subscription is
redhat-operatorsby running the following command:$ oc -n external-dns-operator get subscription
Check the
external-dns-operatorversion by running the following command:$ oc -n external-dns-operator get csv
4.4. External DNS Operator configuration parameters
To customize the behavior of the External DNS Operator, configure the available parameters in the ExternalDNS custom resource (CR). By configuraing parameters, you can control how the Operator synchronizes services and routes with your external DNS provider.
4.4.1. External DNS Operator configuration parameters
To customize the behavior of the External DNS Operator, configure the available parameters in the ExternalDNS custom resource (CR).
| Parameter | Description |
|---|---|
|
| Enables the type of a cloud provider. spec:
provider:
type: AWS
aws:
credentials:
name: aws-access-key
|
|
|
Enables you to specify DNS zones by their domains. If you do not specify zones, the zones: - "<zone_id>"
|
|
|
Enables you to specify AWS zones by their domains. If you do not specify domains, the domains: - filterType: Include matchType: Exact name: "myzonedomain1.com" - filterType: Include matchType: Pattern pattern: ".*\\.otherzonedomain\\.com"
|
|
|
Enables you to specify the source for the DNS records, source:
type: Service
service:
serviceType:
- LoadBalancer
- ClusterIP
labelFilter:
matchLabels:
external-dns.mydomain.org/publish: "yes"
hostnameAnnotation: "Allow"
fqdnTemplate:
- "{{.Name}}.myzonedomain.com"
source:
  type: OpenShiftRoute
  openshiftRouteOptions:
    routerName: default
    labelFilter:
      matchLabels:
        external-dns.mydomain.org/publish: "yes"
|
4.5. Creating DNS records on AWS
To create DNS records on AWS and AWS GovCloud, use the External DNS Operator. The Operator manages external name resolution for your cluster services directly through the Operator.
Usage of External DNS Operator on an STS-enabled cluster that runs in AWS Government (AWS GovCloud) regions is not supported.
4.5.1. Creating DNS records on a public hosted zone for AWS by using Red Hat External DNS Operator
You can create DNS records on a public hosted zone for AWS by using the Red Hat External DNS Operator. You can use the same instructions to create DNS records on a hosted zone for AWS GovCloud.
Procedure
Check the user profile by running the following command. The profile, such as
system:admin, must have access to thekube-systemnamespace. If you do not have the credentials, you can fetch the credentials from thekube-systemnamespace to use the cloud provider client by running the following command:$ oc whoami
Fetch the values from the
aws-credssecret that exists in thekube-systemnamespace.$ export AWS_ACCESS_KEY_ID=$(oc get secrets aws-creds -n kube-system --template={{.data.aws_access_key_id}} | base64 -d)$ export AWS_SECRET_ACCESS_KEY=$(oc get secrets aws-creds -n kube-system --template={{.data.aws_secret_access_key}} | base64 -d)Get the routes to check the domain:
$ oc get routes --all-namespaces | grep console
Example output
openshift-console          console             console-openshift-console.apps.testextdnsoperator.apacshift.support                       console             https   reencrypt/Redirect     None
openshift-console          downloads           downloads-openshift-console.apps.testextdnsoperator.apacshift.support                     downloads           http    edge/Redirect          None
Get the list of DNS zones and find the DNS zone that corresponds to the domain of the route that you previously queried:
$ aws route53 list-hosted-zones | grep testextdnsoperator.apacshift.support
Example output
HOSTEDZONES terraform /hostedzone/Z02355203TNN1XXXX1J6O testextdnsoperator.apacshift.support. 5
Create the
ExternalDNSCR for theroutesource:$ cat <<EOF | oc create -f - apiVersion: externaldns.olm.openshift.io/v1beta1 kind: ExternalDNS metadata: name: sample-aws spec: domains: - filterType: Include matchType: Exact name: testextdnsoperator.apacshift.support provider: type: AWS source: type: OpenShiftRoute openshiftRouteOptions: routerName: default EOFwhere:
metadata.name- Specifies the name of the external DNS resource.
spec.domains- By default all hosted zones are selected as potential targets. You can include a hosted zone that you need.
domains.matchType- Specifies that the matching of the domain from the target zone has to be exact. Exact as opposed to regular expression match.
domains.name- Specifies the exact domain of the zone you want to update. The hostname of the routes must be subdomains of the specified domain.
provider.type-
Specifies the
AWS Route53DNS provider. source- Specifies the options for the source of DNS records.
source.type-
Specifies the
OpenShiftRouteresource as the source for the DNS records which gets created in the previously specified DNS provider. openshiftRouteOptions.routerName-
If the source is
OpenShiftRoute, then you can pass the OpenShift Ingress Controller name. External DNS Operator selects the canonical hostname of that router as the target while creating the CNAME record.
Check the records created for OpenShift Container Platform routes by using the following command:
$ aws route53 list-resource-record-sets --hosted-zone-id Z02355203TNN1XXXX1J6O --query "ResourceRecordSets[?Type == 'CNAME']" | grep console
4.5.2. Creating DNS records in a different AWS account by using a shared VPC
You can use the ExternalDNS Operator to create DNS records in a different AWS account using a shared Virtual Private Cloud (VPC).
By using a shared VPC, an organization can connect resources from multiple projects to a common VPC network. Organizations can then use VPC sharing to use a single Route 53 instance across multiple AWS accounts.
Prerequisites
- You have created two Amazon AWS accounts: one with a VPC and a Route 53 private hosted zone configured (Account A), and another for installing a cluster (Account B).
- You have created an IAM Policy and IAM Role with the appropriate permissions in Account A for Account B to create DNS records in the Route 53 hosted zone of Account A.
- You have installed a cluster in Account B into the existing VPC for Account A.
- You have installed the ExternalDNS Operator in the cluster in Account B.
Procedure
Get the Role ARN of the IAM Role that you created to allow Account B to access Account A’s Route 53 hosted zone by running the following command:
$ aws --profile account-a iam get-role --role-name user-rol1 | head -1
Example output
ROLE arn:aws:iam::1234567890123:role/user-rol1 2023-09-14T17:21:54+00:00 3600 / AROA3SGB2ZRKRT5NISNJN user-rol1
Locate the private hosted zone to use with Account A’s credentials by running the following command:
$ aws --profile account-a route53 list-hosted-zones | grep testextdnsoperator.apacshift.support
Example output
HOSTEDZONES terraform /hostedzone/Z02355203TNN1XXXX1J6O testextdnsoperator.apacshift.support. 5
Create the
ExternalDNSobject by running the following command:$ cat <<EOF | oc create -f - apiVersion: externaldns.olm.openshift.io/v1beta1 kind: ExternalDNS metadata: name: sample-aws spec: domains: - filterType: Include matchType: Exact name: testextdnsoperator.apacshift.support provider: type: AWS aws: assumeRole: arn: arn:aws:iam::12345678901234:role/user-rol1 source: type: OpenShiftRoute openshiftRouteOptions: routerName: default EOFwhere:
arn- Specifies the Role ARN to have DNS records created in Account A.
Check the records created for OpenShift Container Platform routes by entering the following command:
$ aws --profile account-a route53 list-resource-record-sets --hosted-zone-id Z02355203TNN1XXXX1J6O --query "ResourceRecordSets[?Type == 'CNAME']" | grep console-openshift-console
4.6. Creating DNS records on Azure
To create DNS records on Microsoft Azure, use the External DNS Operator. By using this Operator, you can manage external name resolution for your cluster services.
Using the External DNS Operator on a Microsoft Entra Workload ID-enabled cluster or a cluster that runs in Microsoft Azure Government (MAG) regions is not supported.
4.6.1. Creating DNS records on an Azure DNS zone
To create DNS records on a public or private DNS zone for Azure, use the External DNS Operator. The Operator manages external name resolution for your cluster.
Prerequisites
- You must have administrator privileges.
-
The
adminuser must have access to thekube-systemnamespace.
Procedure
Fetch the credentials from the
kube-systemnamespace to use the cloud provider client by running the following command:$ CLIENT_ID=$(oc get secrets azure-credentials -n kube-system --template={{.data.azure_client_id}} | base64 -d)$ CLIENT_SECRET=$(oc get secrets azure-credentials -n kube-system --template={{.data.azure_client_secret}} | base64 -d)$ RESOURCE_GROUP=$(oc get secrets azure-credentials -n kube-system --template={{.data.azure_resourcegroup}} | base64 -d)$ SUBSCRIPTION_ID=$(oc get secrets azure-credentials -n kube-system --template={{.data.azure_subscription_id}} | base64 -d)$ TENANT_ID=$(oc get secrets azure-credentials -n kube-system --template={{.data.azure_tenant_id}} | base64 -d)Log in to Azure by running the following command:
$ az login --service-principal -u "${CLIENT_ID}" -p "${CLIENT_SECRET}" --tenant "${TENANT_ID}"Get a list of routes by running the following command:
$ oc get routes --all-namespaces | grep console
Example output
openshift-console          console             console-openshift-console.apps.test.azure.example.com                       console             https   reencrypt/Redirect     None
openshift-console          downloads           downloads-openshift-console.apps.test.azure.example.com                     downloads           http    edge/Redirect          None
Get a list of DNS zones.
For public DNS zones, enter the following command:
$ az network dns zone list --resource-group "${RESOURCE_GROUP}"For private DNS zones, enter the following command:
$ az network private-dns zone list -g "${RESOURCE_GROUP}"
Create a YAML file, for example,
external-dns-sample-azure.yaml, that defines theExternalDNSobject:Example
external-dns-sample-azure.yamlfileapiVersion: externaldns.olm.openshift.io/v1beta1 kind: ExternalDNS metadata: name: sample-azure spec: zones: - "/subscriptions/1234567890/resourceGroups/test-azure-xxxxx-rg/providers/Microsoft.Network/dnszones/test.azure.example.com" provider: type: Azure source: openshiftRouteOptions: routerName: default type: OpenShiftRoute # ...where:
metadata.name- Specifies the External DNS name.
spec.zones-
Specifies the zone ID. For a private DNS zone, change
dnszonestoprivateDnsZones. provider.type- Specifies the provider type.
source.openshiftRouteOptions- Specifies the options for the source of DNS records.
routerName-
If the source type is
OpenShiftRoute, you can pass the OpenShift Ingress Controller name. The External DNS Operator selects the canonical hostname of that router as the target while creating the CNAME record. source.type-
Specifies the
routeresource as the source for the Azure DNS records.
Troubleshooting
Check the records created for the routes.
For public DNS zones, enter the following command:
$ az network dns record-set list -g "${RESOURCE_GROUP}" -z "${ZONE_NAME}" | grep consoleFor private DNS zones, enter the following command:
$ az network private-dns record-set list -g "${RESOURCE_GROUP}" -z "${ZONE_NAME}" | grep console
4.7. Creating DNS records on Google Cloud Platform
To create DNS records on Google Cloud, use the External DNS Operator. The DNS Operator manages external name resolution for your cluster services.
Using the External DNS Operator on a cluster with Google Cloud Workload Identity enabled is not supported. For more information about the Google Cloud Workload Identity, see Google Cloud Workload Identity.
4.7.1. Creating DNS records on a public managed zone for Google Cloud
To create DNS records on Google Cloud, use the External DNS Operator. The DNS Operator manages external name resolution for your cluster services.
Prerequisites
- You must have administrator privileges.
Procedure
Copy the
gcp-credentialssecret in theencoded-gcloud.jsonfile by running the following command:$ oc get secret gcp-credentials -n kube-system --template='{{$v := index .data "service_account.json"}}{{$v}}' | base64 -d - > decoded-gcloud.jsonExport your Google credentials by running the following command:
$ export GOOGLE_CREDENTIALS=decoded-gcloud.json
Activate your account by using the following command:
$ gcloud auth activate-service-account <client_email as per decoded-gcloud.json> --key-file=decoded-gcloud.json
Set your project by running the following command:
$ gcloud config set project <project_id as per decoded-gcloud.json>
Get a list of routes by running the following command:
$ oc get routes --all-namespaces | grep console
Example output
openshift-console          console             console-openshift-console.apps.test.gcp.example.com                       console             https   reencrypt/Redirect     None
openshift-console          downloads           downloads-openshift-console.apps.test.gcp.example.com                     downloads           http    edge/Redirect          None
Get a list of managed zones, such as
qe-cvs4g-private-zone test.gcp.example.com, by running the following command:$ gcloud dns managed-zones list | grep test.gcp.example.com
Create a YAML file, for example,
external-dns-sample-gcp.yaml, that defines theExternalDNSobject:Example
external-dns-sample-gcp.yamlfileapiVersion: externaldns.olm.openshift.io/v1beta1 kind: ExternalDNS metadata: name: sample-gcp spec: domains: - filterType: Include matchType: Exact name: test.gcp.example.com provider: type: GCP source: openshiftRouteOptions: routerName: default type: OpenShiftRoute # ...where:
metadata.name- Specifies the External DNS name.
spec.domains.filterType- By default, all hosted zones are selected as potential targets. You can include your hosted zone.
spec.domains.matchType-
Specifies the domain of the target that must match the string defined by the
namekey. spec.domains.name- Specifies the exact domain of the zone you want to update. The hostname of the routes must be subdomains of the specified domain.
spec.provider.type- Specifies the provider type.
source.openshiftRouteOptions- Specifies options for the source of DNS records.
openshiftRouteOptions.routerName-
If the source type is
OpenShiftRoute, you can pass the OpenShift Ingress Controller name. External DNS selects the canonical hostname of that router as the target while creating a CNAME record. type-
Specifies the
routeresource as the source for Google Cloud DNS records.
Check the DNS records created for OpenShift Container Platform routes by running the following command:
$ gcloud dns record-sets list --zone=qe-cvs4g-private-zone | grep console
4.8. Creating DNS records on Infoblox
To create DNS records on Infoblox, use the External DNS Operator. The Operator manages external name resolution for your cluster services.
4.8.1. Creating DNS records on a public DNS zone on Infoblox
To create DNS records on Infoblox, use the External DNS Operator. The Operator manages external name resolution for your cluster services.
Prerequisites
-
You have access to the OpenShift CLI (
oc). - You have access to the Infoblox UI.
Procedure
Create a
secretobject with Infoblox credentials by running the following command:$ oc -n external-dns-operator create secret generic infoblox-credentials --from-literal=EXTERNAL_DNS_INFOBLOX_WAPI_USERNAME=<infoblox_username> --from-literal=EXTERNAL_DNS_INFOBLOX_WAPI_PASSWORD=<infoblox_password>
Get a list of routes by running the following command:
$ oc get routes --all-namespaces | grep console
Example output
openshift-console          console             console-openshift-console.apps.test.example.com                       console             https   reencrypt/Redirect     None
openshift-console          downloads           downloads-openshift-console.apps.test.example.com                     downloads           http    edge/Redirect          None
Create a YAML file, for example,
external-dns-sample-infoblox.yaml, that defines theExternalDNSobject:Example
external-dns-sample-infoblox.yamlfileapiVersion: externaldns.olm.openshift.io/v1beta1 kind: ExternalDNS metadata: name: sample-infoblox spec: provider: type: Infoblox infoblox: credentials: name: infoblox-credentials gridHost: ${INFOBLOX_GRID_PUBLIC_IP} wapiPort: 443 wapiVersion: "2.3.1" domains: - filterType: Include matchType: Exact name: test.example.com source: type: OpenShiftRoute openshiftRouteOptions: routerName: defaultwhere:
metadata.name- Specifies the External DNS name.
provider.type- Specifies the provider type.
source.type- Specifies options for the source of DNS records.
routerName-
If the source type is
OpenShiftRoute, you can pass the OpenShift Ingress Controller name. External DNS selects the canonical hostname of that router as the target while creating a CNAME record.
Create the
ExternalDNSresource on Infoblox by running the following command:$ oc create -f external-dns-sample-infoblox.yaml
From the Infoblox UI, check the DNS records created for
consoleroutes:- Click Data Management → DNS → Zones.
- Select the zone name.
4.9. Configuring the cluster-wide proxy on the External DNS Operator
To propagate proxy settings to your deployed Operators, configure the cluster-wide proxy. The Operator Lifecycle Manager (OLM) automatically updates these Operators with the new HTTP_PROXY, HTTPS_PROXY, and NO_PROXY environment variables.
4.9.1. Trusting the certificate authority of the cluster-wide proxy
You can configure the External DNS Operator to trust the certificate authority of the cluster-wide proxy.
Procedure
Create the config map to contain the CA bundle in the
external-dns-operatornamespace by running the following command:$ oc -n external-dns-operator create configmap trusted-ca
To inject the trusted CA bundle into the config map, add the
config.openshift.io/inject-trusted-cabundle=truelabel to the config map by running the following command:$ oc -n external-dns-operator label cm trusted-ca config.openshift.io/inject-trusted-cabundle=true
Update the subscription of the External DNS Operator by running the following command:
$ oc -n external-dns-operator patch subscription external-dns-operator --type='json' -p='[{"op": "add", "path": "/spec/config", "value":{"env":[{"name":"TRUSTED_CA_CONFIGMAP_NAME","value":"trusted-ca"}]}}]'
Verification
After deploying the External DNS Operator, verify that the trusted CA environment variable is added by running the following command. The output must show
trusted-cafor theexternal-dns-operatordeployment.$ oc -n external-dns-operator exec deploy/external-dns-operator -c external-dns-operator -- printenv TRUSTED_CA_CONFIGMAP_NAME
Chapter 5. MetalLB Operator
5.1. About MetalLB and the MetalLB Operator
In OpenShift Container Platform clusters running on bare metal or without a cloud load balancer, you can use the MetalLB Operator to assign external IP addresses to LoadBalancer services. These services receive external IPs on the host network.
5.1.1. When to use MetalLB
To get fault-tolerant access to applications through an external IP on bare metal in OpenShift Container Platform, you can use MetalLB.
MetalLB is useful when you have a bare-metal cluster, or an on-premise infrastructure without a native load balancer, and you need to expose services through external IP addresses.
You must configure your networking infrastructure to route network traffic for the external IP address from clients to the host network for the cluster.
When you deploy MetalLB with the MetalLB Operator, and add a service of type LoadBalancer, MetalLB provides a platform-native load balancer.
When external traffic enters your OpenShift Container Platform cluster through a MetalLB LoadBalancer service, the return traffic to the client has the external IP address of the load balancer as the source IP.
MetalLB operating in layer2 mode provides support for failover by utilizing a mechanism similar to IP failover. However, instead of relying on the virtual router redundancy protocol (VRRP) and keepalived, MetalLB leverages a gossip-based protocol to identify instances of node failure. When a failover is detected, another node assumes the role of the leader node, and a gratuitous ARP message is dispatched to broadcast this change.
MetalLB operating in layer3 or border gateway protocol (BGP) mode delegates failure detection to the network. The BGP router or routers that the OpenShift Container Platform nodes have established a connection with will identify any node failure and terminate the routes to that node.
Using MetalLB instead of IP failover is preferable for ensuring high availability of pods and services.
5.1.2. MetalLB Operator custom resources
In OpenShift Container Platform, you configure MetalLB deployment and IP advertisement through custom resources that the MetalLB Operator monitors. The resources include MetalLB, IPAddressPool, L2Advertisement, BGPAdvertisement, BGPPeer, and BFDProfile.
MetalLB-
When you add a
MetalLBcustom resource to the cluster, the MetalLB Operator deploys MetalLB on the cluster. The Operator only supports a single instance of the custom resource. If the instance is deleted, the Operator removes MetalLB from the cluster. IPAddressPoolMetalLB requires one or more pools of IP addresses that it can assign to a service when you add a service of type
LoadBalancer. AnIPAddressPoolincludes a list of IP addresses. The list can be a single IP address that is set using a range, such as 1.1.1.1-1.1.1.1, a range specified in CIDR notation, a range specified as a starting and ending address separated by a hyphen, or a combination of the three. AnIPAddressPoolrequires a name. The documentation uses names likedoc-example,doc-example-reserved, anddoc-example-ipv6. The MetalLBcontrollerassigns IP addresses from a pool of addresses in anIPAddressPool.L2AdvertisementandBGPAdvertisementcustom resources enable the advertisement of a given IP from a given pool. You can assign IP addresses from anIPAddressPoolto services and namespaces by using thespec.serviceAllocationspecification in theIPAddressPoolcustom resource.NoteA single
IPAddressPoolcan be referenced by a L2 advertisement and a BGP advertisement.BGPPeer- The BGP peer custom resource identifies the BGP router for MetalLB to communicate with, the AS number of the router, the AS number for MetalLB, and customizations for route advertisement. MetalLB advertises the routes for service load-balancer IP addresses to one or more BGP peers.
BFDProfile- The BFD profile custom resource configures Bidirectional Forwarding Detection (BFD) for a BGP peer. BFD provides faster path failure detection than BGP alone provides.
L2Advertisement-
The L2Advertisement custom resource advertises an IP coming from an
IPAddressPoolusing the L2 protocol. BGPAdvertisement-
The BGPAdvertisement custom resource advertises an IP coming from an
IPAddressPoolusing the BGP protocol.
After you add the MetalLB custom resource to the cluster and the Operator deploys MetalLB, the controller and speaker MetalLB software components begin running.
MetalLB validates all relevant custom resources.
5.1.3. MetalLB software components
In OpenShift Container Platform, you get external IPs for LoadBalancer services from two MetalLB components. The controller assigns IPs from address pools, and the speaker advertises them via layer 2 or BGP.
When you install the MetalLB Operator, the metallb-operator-controller-manager deployment starts a pod. The pod is the implementation of the Operator. The pod monitors for changes to all the relevant resources.
When the Operator starts an instance of MetalLB, it starts a controller deployment and a speaker daemon set.
You can configure deployment specifications in the MetalLB custom resource to manage how controller and speaker pods deploy and run in your cluster. For more information about these deployment specifications, see the Additional resources section.
controllerThe Operator starts the deployment and a single pod. When you add a service of type
LoadBalancer, Kubernetes uses thecontrollerto allocate an IP address from an address pool. In case of a service failure, verify you have the following entry in yourcontrollerpod logs:Example output
"event":"ipAllocated","ip":"172.22.0.201","msg":"IP address assigned by controller
speakerThe Operator starts a daemon set for
speakerpods. By default, a pod is started on each node in your cluster. You can limit the pods to specific nodes by specifying a node selector in theMetalLBcustom resource when you start MetalLB. If thecontrollerallocated the IP address to the service and service is still unavailable, read thespeakerpod logs. If thespeakerpod is unavailable, run theoc describe pod -ncommand.For layer 2 mode, after the
controllerallocates an IP address for the service, thespeakerpods use an algorithm to determine whichspeakerpod on which node will announce the load balancer IP address. The algorithm involves hashing the node name and the load balancer IP address. For more information, see "MetalLB and external traffic policy". Thespeakeruses Address Resolution Protocol (ARP) to announce IPv4 addresses and Neighbor Discovery Protocol (NDP) to announce IPv6 addresses.
For Border Gateway Protocol (BGP) mode, after the controller allocates an IP address for the service, each speaker pod advertises the load balancer IP address with its BGP peers. You can configure which nodes start BGP sessions with BGP peers.
Requests for the load balancer IP address are routed to the node with the speaker that announces the IP address. After the node receives the packets, the service proxy routes the packets to an endpoint for the service. The endpoint can be on the same node in the optimal case, or it can be on another node. The service proxy chooses an endpoint each time a connection is established.
5.1.4. MetalLB and external traffic policy
External traffic policy for MetalLB LoadBalancer services determines how the service proxy distributes traffic to pods. Set the policy to cluster for uniform distribution or to local to preserve client IP addresses.
With layer 2 mode, one node in your cluster receives all the traffic for the service IP address.
With BGP mode, a router on the host network opens a connection to one of the nodes in the cluster for a new client connection.
How your cluster handles the traffic after it enters the node is affected by the external traffic policy.
clusterThis is the default value for
spec.externalTrafficPolicy.With the
clustertraffic policy, after the node receives the traffic, the service proxy distributes the traffic to all the pods in your service. This policy provides uniform traffic distribution across the pods, but it obscures the client IP address and it can appear to the application in your pods that the traffic originates from the node rather than the client.localWith the
localtraffic policy, after the node receives the traffic, the service proxy only sends traffic to the pods on the same node. For example, if thespeakerpod on node A announces the external service IP, then all traffic is sent to node A. After the traffic enters node A, the service proxy only sends traffic to pods for the service that are also on node A. Pods for the service that are on additional nodes do not receive any traffic from node A. Pods for the service on additional nodes act as replicas in case failover is needed.This policy does not affect the client IP address. Application pods can determine the client IP address from the incoming connections.
The following information is important when configuring the external traffic policy in BGP mode.
Although MetalLB advertises the load balancer IP address from all the eligible nodes, the number of nodes loadbalancing the service can be limited by the capacity of the router to establish equal-cost multipath (ECMP) routes. If the number of nodes advertising the IP is greater than the ECMP group limit of the router, the router will use less nodes than the ones advertising the IP.
For example, if the external traffic policy is set to local and the router has an ECMP group limit set to 16 and the pods implementing a LoadBalancer service are deployed on 30 nodes, this would result in pods deployed on 14 nodes not receiving any traffic. In this situation, it would be preferable to set the external traffic policy for the service to cluster.
5.1.5. MetalLB concepts for layer 2 mode
MetalLB in layer 2 mode announces the external IP for a LoadBalancer service from one node via ARP or NDP. All traffic for the service goes through that node, and failover to another node is automatic when the node becomes unavailable.
In layer 2 mode, MetalLB relies on ARP and NDP. These protocols implement local address resolution within a specific subnet. In this context, the client must be able to reach the VIP assigned by MetalLB that exists on the same subnet as the nodes announcing the service in order for MetalLB to work.
The speaker pod responds to ARP requests for IPv4 services and NDP requests for IPv6.
In layer 2 mode, all traffic for a service IP address is routed through one node. After traffic enters the node, the service proxy for the CNI network provider distributes the traffic to all the pods for the service.
Because all traffic for a service enters through a single node in layer 2 mode, in a strict sense, MetalLB does not implement a load balancer for layer 2. Rather, MetalLB implements a failover mechanism for layer 2 so that when a speaker pod becomes unavailable, a speaker pod on a different node can announce the service IP address.
When a node becomes unavailable, failover is automatic. The speaker pods on the other nodes detect that a node is unavailable and a new speaker pod and node take ownership of the service IP address from the failed node.
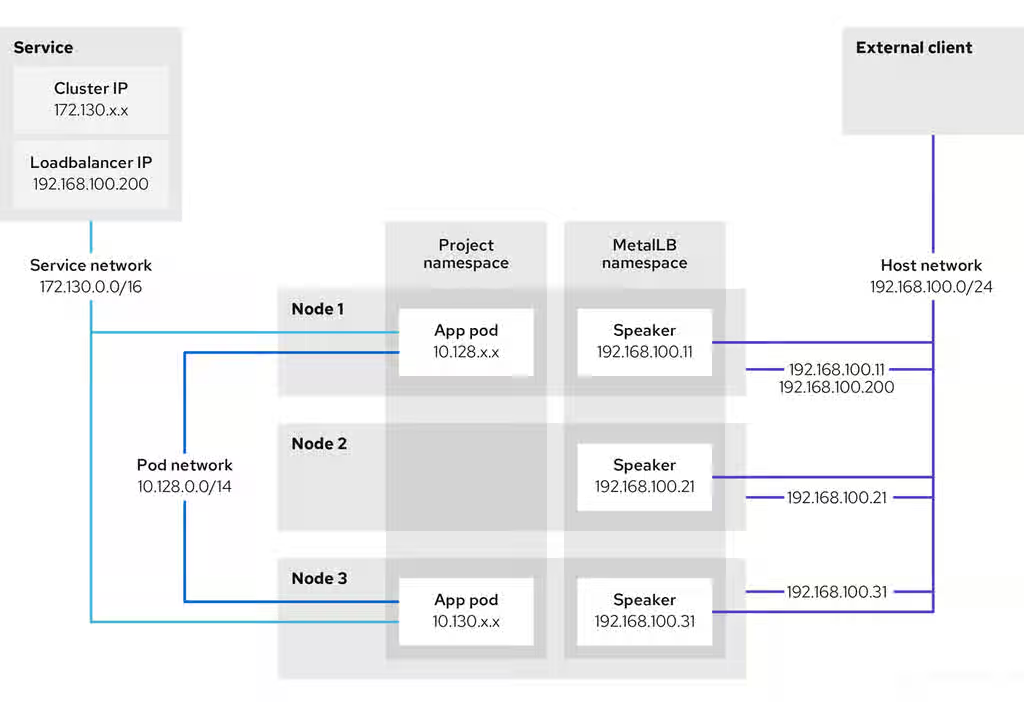
The preceding graphic shows the following concepts related to MetalLB:
-
An application is available through a service that has a cluster IP on the
172.130.0.0/16subnet. That IP address is accessible from inside the cluster. The service also has an external IP address that MetalLB assigned to the service,192.168.100.200. - Nodes 1 and 3 have a pod for the application.
-
The
speakerdaemon set runs a pod on each node. The MetalLB Operator starts these pods. -
Each
speakerpod is a host-networked pod. The IP address for the pod is identical to the IP address for the node on the host network. -
The
speakerpod on node 1 uses ARP to announce the external IP address for the service,192.168.100.200. Thespeakerpod that announces the external IP address must be on the same node as an endpoint for the service and the endpoint must be in theReadycondition. Client traffic is routed to the host network and connects to the
192.168.100.200IP address. After traffic enters the node, the service proxy sends the traffic to the application pod on the same node or another node according to the external traffic policy that you set for the service.-
If the external traffic policy for the service is set to
cluster, the node that advertises the192.168.100.200load balancer IP address is selected from the nodes where aspeakerpod is running. Only that node can receive traffic for the service. -
If the external traffic policy for the service is set to
local, the node that advertises the192.168.100.200load balancer IP address is selected from the nodes where aspeakerpod is running and at least an endpoint of the service. Only that node can receive traffic for the service. In the preceding graphic, either node 1 or 3 would advertise192.168.100.200.
-
If the external traffic policy for the service is set to
-
If node 1 becomes unavailable, the external IP address fails over to another node. On another node that has an instance of the application pod and service endpoint, the
speakerpod begins to announce the external IP address,192.168.100.200and the new node receives the client traffic. In the diagram, the only candidate is node 3.
5.1.6. MetalLB concepts for BGP mode
MetalLB in border gateway protocol (BGP) mode advertises load balancer IP addresses to BGP peers from each speaker pod. The router sends traffic to one of the nodes, so load is distributed across nodes and the router switches to another node when one becomes unavailable.
It is also possible to advertise the IPs coming from a given pool to a specific set of peers by adding an optional list of BGP peers.
BGP peers are commonly network routers that are configured to use the BGP protocol. When a router receives traffic for the load balancer IP address, the router picks one of the nodes with a speaker pod that advertised the IP address. The router sends the traffic to that node. After traffic enters the node, the service proxy for the CNI network plugin distributes the traffic to all the pods for the service.
The directly-connected router on the same layer 2 network segment as the cluster nodes can be configured as a BGP peer. If the directly-connected router is not configured as a BGP peer, you need to configure your network so that packets for load balancer IP addresses are routed between the BGP peers and the cluster nodes that run the speaker pods.
Each time a router receives new traffic for the load balancer IP address, it creates a new connection to a node. Each router manufacturer has an implementation-specific algorithm for choosing which node to initiate the connection with. However, the algorithms commonly are designed to distribute traffic across the available nodes for the purpose of balancing the network load.
If a node becomes unavailable, the router initiates a new connection with another node that has a speaker pod that advertises the load balancer IP address.
Figure 5.1. MetalLB topology diagram for BGP mode
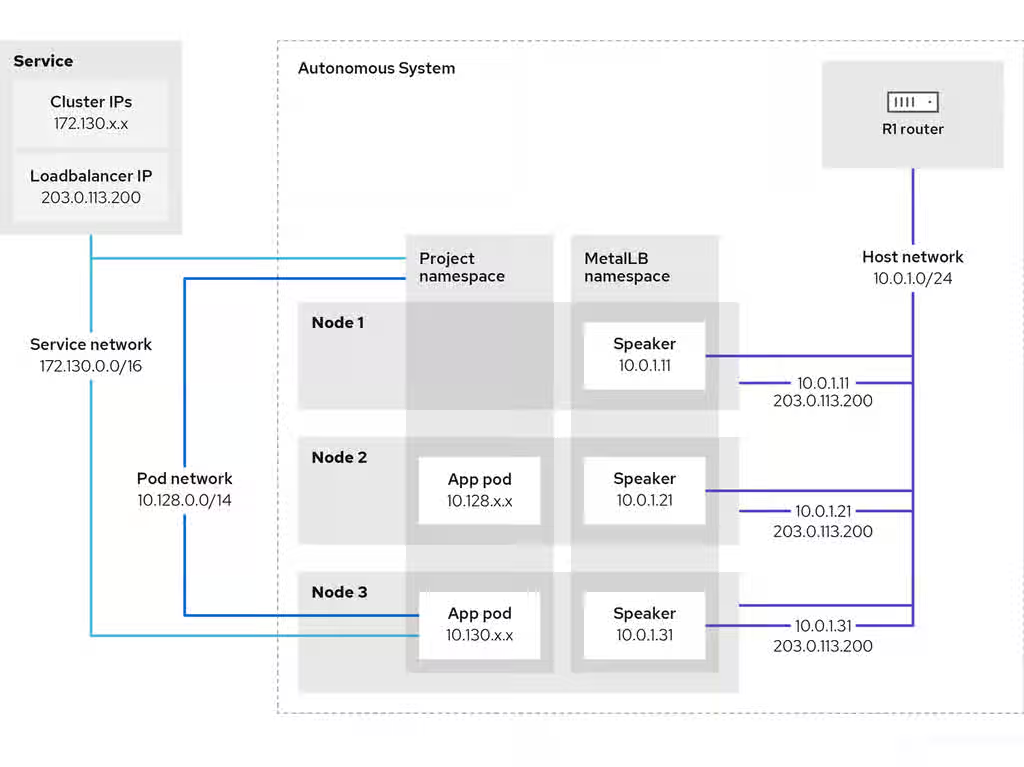
The preceding graphic shows the following concepts related to MetalLB:
-
An application is available through a service that has an IPv4 cluster IP on the
172.130.0.0/16subnet. That IP address is accessible from inside the cluster. The service also has an external IP address that MetalLB assigned to the service,203.0.113.200. - Nodes 2 and 3 have a pod for the application.
-
The
speakerdaemon set runs a pod on each node. The MetalLB Operator starts these pods. You can configure MetalLB to specify which nodes run thespeakerpods. -
Each
speakerpod is a host-networked pod. The IP address for the pod is identical to the IP address for the node on the host network. -
Each
speakerpod starts a BGP session with all BGP peers and advertises the load balancer IP addresses or aggregated routes to the BGP peers. Thespeakerpods advertise that they are part of Autonomous System 65010. The diagram shows a router, R1, as a BGP peer within the same Autonomous System. However, you can configure MetalLB to start BGP sessions with peers that belong to other Autonomous Systems. All the nodes with a
speakerpod that advertises the load balancer IP address can receive traffic for the service.-
If the external traffic policy for the service is set to
cluster, all the nodes where a speaker pod is running advertise the203.0.113.200load balancer IP address and all the nodes with aspeakerpod can receive traffic for the service. The host prefix is advertised to the router peer only if the external traffic policy is set to cluster. -
If the external traffic policy for the service is set to
local, then all the nodes where aspeakerpod is running and at least an endpoint of the service is running can advertise the203.0.113.200load balancer IP address. Only those nodes can receive traffic for the service. In the preceding graphic, nodes 2 and 3 would advertise203.0.113.200.
-
If the external traffic policy for the service is set to
-
You can configure MetalLB to control which
speakerpods start BGP sessions with specific BGP peers by specifying a node selector when you add a BGP peer custom resource. - Any routers, such as R1, that are configured to use BGP can be set as BGP peers.
- Client traffic is routed to one of the nodes on the host network. After traffic enters the node, the service proxy sends the traffic to the application pod on the same node or another node according to the external traffic policy that you set for the service.
- If a node becomes unavailable, the router detects the failure and initiates a new connection with another node. You can configure MetalLB to use a Bidirectional Forwarding Detection (BFD) profile for BGP peers. BFD provides faster link failure detection so that routers can initiate new connections earlier than without BFD.
5.1.7. Limitations and restrictions
MetalLB has limitations for infrastructure, layer 2 mode, and BGP mode in OpenShift Container Platform. Consider infrastructure fit, layer 2 single-node bandwidth and failover, and BGP connection resets and single ASN when you plan your deployment.
5.1.7.1. Infrastructure considerations for MetalLB
MetalLB is designed for bare metal and on-premise environments where no native cloud load balancer is available. Before you deploy MetalLB, verify that your infrastructure meets the networking requirements for your chosen mode.
MetalLB is not supported on cloud provider platforms such as AWS, Azure, or Google Cloud. Cloud platforms virtualize the network layer and expose proprietary APIs instead of standard network protocols. As a result, MetalLB cannot function correctly on these platforms.
Use the load balancing service that the platform provides if your cluster runs on a cloud platform.
5.1.7.1.1. Supported platforms
The following infrastructure platforms support MetalLB:
- Bare metal
- VMware vSphere
- IBM Z® and IBM® LinuxONE
- IBM Z® and IBM® LinuxONE for Red Hat Enterprise Linux (RHEL) KVM
- IBM Power®
5.1.7.1.2. Network prerequisites
MetalLB requires the following network capabilities, depending on the operating mode:
- For Layer 2 mode
- Standard ARP (IPv4) or NDP (IPv6) must function on the network. The network must not block or emulate ARP/NDP traffic.
- Anti-ARP-spoofing protections, if present, must be disabled on nodes running MetalLB speakers. Some virtualization platforms, such as Red Hat OpenStack Platform (RHOSP), enable this protection by default.
- For BGP mode
- An external BGP-capable router must be available and reachable from the cluster nodes.
- The network must allow BGP sessions (TCP port 179) between the cluster nodes and the upstream router.
- For both modes
- Configure external network infrastructure to route traffic destined for the external IP addresses to the cluster nodes.
5.1.7.2. Limitations for layer 2 mode
In OpenShift Container Platform, MetalLB layer 2 mode is limited to single-node bandwidth and failover depends on client ARP handling. Avoid using the same VLAN for MetalLB and an additional network to prevent connection failures.
5.1.7.2.1. Single-node bottleneck
MetalLB routes all traffic for a service through a single node, the node can become a bottleneck and limit performance.
Layer 2 mode limits the ingress bandwidth for your service to the bandwidth of a single node. This is a fundamental limitation of using ARP and NDP to direct traffic.
5.1.7.2.2. Slow failover performance
Failover between nodes depends on cooperation from the clients. When a failover occurs, MetalLB sends gratuitous ARP packets to notify clients that the MAC address associated with the service IP has changed.
Most client operating systems handle gratuitous ARP packets correctly and update their neighbor caches promptly. When clients update their caches quickly, failover completes within a few seconds. Clients typically fail over to a new node within 10 seconds. However, some client operating systems either do not handle gratuitous ARP packets at all or have outdated implementations that delay the cache update.
Recent versions of common operating systems such as Windows, macOS, and Linux implement layer 2 failover correctly. Issues with slow failover are not expected except for older and less common client operating systems.
To minimize the impact from a planned failover on outdated clients, keep the old node running for a few minutes after flipping leadership. The old node can continue to forward traffic for outdated clients until their caches refresh.
During an unplanned failover, the service IPs are unreachable until the outdated clients refresh their cache entries.
5.1.7.2.3. Additional Network and MetalLB cannot use same network
Using the same VLAN for both MetalLB and an additional network interface set up on a source pod might result in a connection failure. This occurs when both the MetalLB IP and the source pod reside on the same node.
To avoid connection failures, place the MetalLB IP in a different subnet from the one where the source pod resides. This configuration ensures that traffic from the source pod will take the default gateway. Consequently, the traffic can effectively reach its destination by using the OVN overlay network, ensuring that the connection functions as intended.
5.1.7.3. Limitations for BGP mode
In OpenShift Container Platform, MetalLB border gateway protocol (BGP) mode can reset active connections when a BGP session terminates and requires a single ASN and router ID for all BGP peers. Use a node selector when adding a BGP peer to limit which nodes run BGP sessions and reduce the impact of node faults.
5.1.7.3.1. Node failure can break all active connections
MetalLB shares a limitation that is common to BGP-based load balancing. When a BGP session terminates, such as when a node fails or when a speaker pod restarts, the session termination might result in resetting all active connections. End users can experience a Connection reset by peer message.
The consequence of a terminated BGP session is implementation-specific for each router manufacturer. However, you can anticipate that a change in the number of speaker pods affects the number of BGP sessions and that active connections with BGP peers will break.
To avoid or reduce the likelihood of a service interruption, you can specify a node selector when you add a BGP peer. By limiting the number of nodes that start BGP sessions, a fault on a node that does not have a BGP session has no affect on connections to the service.
5.1.7.3.2. Support for a single ASN and a single router ID only
When you add a BGP peer custom resource, you specify the spec.myASN field to identify the Autonomous System Number (ASN) that MetalLB belongs to. OpenShift Container Platform uses an implementation of BGP with MetalLB that requires MetalLB to belong to a single ASN. If you attempt to add a BGP peer and specify a different value for spec.myASN than an existing BGP peer custom resource, you receive an error.
Similarly, when you add a BGP peer custom resource, the spec.routerID field is optional. If you specify a value for this field, you must specify the same value for all other BGP peer custom resources that you add.
The limitation to support a single ASN and single router ID is a difference with the community-supported implementation of MetalLB.
5.1.8. Additional resources
5.2. Installing the MetalLB Operator
As a cluster administrator, you can add the MetalLB Operator so that the Operator can manage the lifecycle for an instance of MetalLB on your cluster.
MetalLB and IP failover are incompatible. If you configured IP failover for your cluster, perform the steps to remove IP failover before you install the Operator.
5.2.1. Installing the MetalLB Operator from the software catalog by using the web console
As a cluster administrator, you can install the MetalLB Operator by using the OpenShift Container Platform web console.
Prerequisites
-
Log in as a user with
cluster-adminprivileges.
Procedure
- In the OpenShift Container Platform web console, navigate to Ecosystem → Software Catalog.
Type
metallbin the Filter by keyword box to find the MetalLB Operator.You can also filter options by Infrastructure Features. For example, select Disconnected if you want to see Operators that work in disconnected environments, also known as restricted network environments.
- Click the MetalLB Operator tile and click Install.
On the Install Operator page, accept the defaults and click Install.
The web console displays the Installing Operator page with a status update. Wait until the Operator installs before continuing.
- The web console displays the progress of the installation. When the installation is complete, click View installed Operators.
Verification
To confirm that the installation is successful:
- Navigate to the Ecosystem → Installed Operators page.
-
Check that the Operator is installed in the
metallb-systemnamespace and that its status isSucceeded.
If the Operator is not installed successfully, check the status of the Operator and review the logs:
-
Navigate to the Ecosystem → Installed Operators page and inspect the
Statuscolumn for any errors or failures. -
Navigate to the Workloads → Pods page and check the logs in any pods in the
metallb-systemproject that are reporting issues.
-
Navigate to the Ecosystem → Installed Operators page and inspect the
5.2.2. Installing from the software catalog using the CLI
To install the MetalLB Operator from the software catalog in OpenShift Container Platform without using the web console, you can use the OpenShift CLI (oc).
It is recommended that when using the CLI you install the Operator in the metallb-system namespace.
Prerequisites
- A cluster installed on bare-metal hardware.
-
Install the OpenShift CLI (
oc). -
Log in as a user with
cluster-adminprivileges.
Procedure
Create a namespace for the MetalLB Operator by entering the following command:
$ cat << EOF | oc apply -f -
apiVersion: v1
kind: Namespace
metadata:
  name: metallb-system
EOF
Create an Operator group custom resource (CR) in the namespace:
$ cat << EOF | oc apply -f -
apiVersion: operators.coreos.com/v1
kind: OperatorGroup
metadata:
  name: metallb-operator
  namespace: metallb-system
EOF
Confirm the Operator group is installed in the namespace:
$ oc get operatorgroup -n metallb-system
The following is example output:
NAME               AGE
metallb-operator   14m
Create a
SubscriptionCR:Define the
SubscriptionCR and save the YAML file, for example,metallb-sub.yaml:apiVersion: operators.coreos.com/v1alpha1 kind: Subscription metadata: name: metallb-operator-sub namespace: metallb-system spec: channel: stable name: metallb-operator source: redhat-operators sourceNamespace: openshift-marketplace
-
For the
spec.sourceparameter, must specify theredhat-operatorsvalue.
-
For the
To create the
SubscriptionCR, run the following command:$ oc apply -f metallb-sub.yaml
Optional: To ensure BGP and BFD metrics appear in Prometheus, you can label the namespace as in the following command:
$ oc label ns metallb-system "openshift.io/cluster-monitoring=true"
Verification
The verification steps assume the MetalLB Operator is installed in the metallb-system namespace.
Verify that the Operator installed successfully by running the following command. Wait until the
PHASEdisplaysSucceeded:$ oc get clusterserviceversion -n metallb-system \ -o custom-columns=Name:.metadata.name,Phase:.status.phase
The following is example output:
Name Phase metallb-operator.{product-version}.0-nnnnnnnnnnnn SucceededNoteInstallation of the Operator might take a few seconds.
Confirm that the install plan is in the namespace:
$ oc get installplan -n metallb-system
The following is example output:
NAME            CSV                                                 APPROVAL    APPROVED
install-wzg94   metallb-operator.4.22.0-nnnnnnnnnnnn   Automatic   true
5.2.3. Starting MetalLB on your cluster
To start MetalLB on your cluster after installing the MetalLB Operator in OpenShift Container Platform, you create a single MetalLB custom resource.
Prerequisites
-
Install the OpenShift CLI (
oc). -
Log in as a user with
cluster-adminprivileges. - Install the MetalLB Operator.
Procedure
Create a single instance of a MetalLB custom resource:
$ cat << EOF | oc apply -f -
apiVersion: metallb.io/v1beta1
kind: MetalLB
metadata:
  name: metallb
  namespace: metallb-system
EOF
-
For the
metadata.namespaceparameter, substitutemetallb-systemwithopenshift-operatorsif you installed the MetalLB Operator using the web console.
-
For the
Verification
Confirm that the deployment for the MetalLB controller and the daemon set for the MetalLB speaker are running.
It might take a few seconds for the controller deployment and speaker daemon set to become available after you create the MetalLB custom resource.
Verify that the deployment for the controller is running:
$ oc get deployment -n metallb-system controller
The following is example output:
NAME         READY   UP-TO-DATE   AVAILABLE   AGE
controller   1/1     1            1           11m
Verify that the daemon set for the speaker is running:
$ oc get daemonset -n metallb-system speaker
The following is example output:
NAME      DESIRED   CURRENT   READY   UP-TO-DATE   AVAILABLE   NODE SELECTOR            AGE
speaker   6         6         6       6            6           kubernetes.io/os=linux   18m
The example output indicates six speaker pods. The number of speaker pods in your cluster might differ from the example output. Verify that the number of speaker pods equals the number of nodes in your cluster. For example, a single-node cluster has one speaker pod.
5.2.4. Deployment specifications for MetalLB
Deployment specifications in the MetalLB custom resource control how the MetalLB controller and speaker pods deploy and run in OpenShift Container Platform.
Use deployment specifications to manage the following tasks:
- Select nodes for MetalLB pod deployment.
- Manage scheduling by using pod priority and pod affinity.
- Assign CPU limits for MetalLB pods.
- Assign a container RuntimeClass for MetalLB pods.
- Assign metadata for MetalLB pods.
5.2.4.1. Limit speaker pods to specific nodes
You can limit MetalLB speaker pods to specific nodes in OpenShift Container Platform by configuring a node selector in the MetalLB custom resource. Only nodes that run a speaker pod advertise load balancer IP addresses, so you control which nodes serve MetalLB traffic.
The most common reason to limit the speaker pods to specific nodes is to ensure that only nodes with network interfaces on specific networks advertise load balancer IP addresses.
If you limit the speaker pods to specific nodes and specify local for the external traffic policy of a service, then you must ensure that the application pods for the service are deployed to the same nodes.
Example configuration to limit speaker pods to worker nodes
apiVersion: metallb.io/v1beta1
kind: MetalLB
metadata:
  name: metallb
  namespace: metallb-system
spec:
  nodeSelector:
    node-role.kubernetes.io/worker: ""
  speakerTolerations:
  - key: "Example"
    operator: "Exists"
effect: "NoExecute"-
In this example configuration, the
spec.nodeSelectorfield assigns thespeakerpods to worker nodes. You can specify labels that you assigned to nodes or any valid node selector. -
In this example configuration,
spec.speakerToTolerationspod that this toleration is attached to tolerates any taint that matches thekeyandeffectvalues by using theoperatorvalue.
After you apply a manifest with the spec.nodeSelector field, you can check the number of pods that the Operator deployed with the oc get daemonset -n metallb-system speaker command. Similarly, you can display the nodes that match your labels with a command like oc get nodes -l node-role.kubernetes.io/worker=.
You can optionally allow the node to control which speaker pods should, or should not, be scheduled on them by using affinity rules. You can also limit these pods by applying a list of tolerations. For more information about affinity rules, taints, and tolerations, see the additional resources.
5.2.4.2. Configuring pod priority and pod affinity in a MetalLB deployment
To control scheduling of MetalLB controller and speaker pods in OpenShift Container Platform, you can assign pod priority and pod affinity in the MetalLB custom resource. You create a PriorityClass and set priorityClassName and affinity in the MetalLB spec, then apply the configuration.
The pod priority indicates the relative importance of a pod on a node and schedules the pod based on this priority. Set a high priority on your controller or speaker pod to ensure scheduling priority over other pods on the node.
Pod affinity manages relationships among pods. Assign pod affinity to the controller or speaker pods to control on what node the scheduler places the pod in the context of pod relationships. For example, you can use pod affinity rules to ensure that certain pods are located on the same node or nodes, which can help improve network communication and reduce latency between those components.
Prerequisites
-
You are logged in as a user with
cluster-adminprivileges. - You have installed the MetalLB Operator.
- You have started the MetalLB Operator on your cluster.
Procedure
Create a
PriorityClasscustom resource, such asmyPriorityClass.yaml, to configure the priority level. This example defines aPriorityClassnamedhigh-prioritywith a value of1000000. Pods that are assigned this priority class are considered higher priority during scheduling compared to pods with lower priority classes:apiVersion: scheduling.k8s.io/v1 kind: PriorityClass metadata: name: high-priority value: 1000000
Apply the
PriorityClasscustom resource configuration:$ oc apply -f myPriorityClass.yaml
Create a
MetalLBcustom resource, such asMetalLBPodConfig.yaml, to specify thepriorityClassNameandpodAffinityvalues:apiVersion: metallb.io/v1beta1 kind: MetalLB metadata: name: metallb namespace: metallb-system spec: logLevel: debug controllerConfig: priorityClassName: high-priority affinity: podAffinity: requiredDuringSchedulingIgnoredDuringExecution: - labelSelector: matchLabels: app: metallb topologyKey: kubernetes.io/hostname speakerConfig: priorityClassName: high-priority affinity: podAffinity: requiredDuringSchedulingIgnoredDuringExecution: - labelSelector: matchLabels: app: metallb topologyKey: kubernetes.io/hostnamewhere:
spec.controllerConfig.priorityClassName-
Specifies the priority class for the MetalLB controller pods. In this case, it is set to
high-priority. spec.controllerConfig.affinity.podAffinity-
Specifies that you are configuring pod affinity rules. These rules dictate how pods are scheduled in relation to other pods or nodes. This configuration instructs the scheduler to schedule pods that have the label
app: metallbonto nodes that share the same hostname. This helps to co-locate MetalLB-related pods on the same nodes, potentially optimizing network communication, latency, and resource usage between these pods.
Apply the
MetalLBcustom resource configuration by running the following command:$ oc apply -f MetalLBPodConfig.yaml
Verification
To view the priority class that you assigned to pods in the
metallb-systemnamespace, run the following command:$ oc get pods -n metallb-system -o custom-columns=NAME:.metadata.name,PRIORITY:.spec.priorityClassName
Example output
NAME                                                 PRIORITY
controller-584f5c8cd8-5zbvg                          high-priority
metallb-operator-controller-manager-9c8d9985-szkqg   <none>
metallb-operator-webhook-server-c895594d4-shjgx      <none>
speaker-dddf7                                        high-priority
Verify that the scheduler placed pods according to pod affinity rules by viewing the metadata for the node of the pod. For example:
$ oc get pod -o=custom-columns=NODE:.spec.nodeName,NAME:.metadata.name -n metallb-system
5.2.4.3. Configuring pod CPU limits in a MetalLB deployment
To manage compute resources on nodes running MetalLB in OpenShift Container Platform, you can assign CPU limits to the controller and speaker pods in the MetalLB custom resource. This ensures that all pods on the node have the necessary compute resources to manage workloads and cluster housekeeping.
Prerequisites
-
You are logged in as a user with
cluster-adminprivileges. - You have installed the MetalLB Operator.
Procedure
Create a
MetalLBcustom resource file, such asCPULimits.yaml, to specify thecpuvalue for thecontrollerandspeakerpods:apiVersion: metallb.io/v1beta1 kind: MetalLB metadata: name: metallb namespace: metallb-system spec: logLevel: debug controllerConfig: resources: limits: cpu: "200m" speakerConfig: resources: limits: cpu: "300m"Apply the
MetalLBcustom resource configuration:$ oc apply -f CPULimits.yaml
Verification
To view compute resources for a pod, run the following command, replacing
<pod_name>with your target pod:$ oc describe pod <pod_name>
5.2.5. Additional resources
5.3. Upgrading the MetalLB Operator
The Subscription custom resource (CR) for the MetalLB Operator is used to manage whether the Operator is upgraded automatically or manually.
By default, the Subscription CR assigns the namespace to metallb-system and automatically sets the installPlanApproval parameter to Automatic. This means that when Red Hat-provided Operator catalogs include a newer version of the MetalLB Operator, the MetalLB Operator is automatically upgraded.
If you need to manually control upgrading the MetalLB Operator, set the installPlanApproval parameter to Manual.
5.3.1. Manually upgrading the MetalLB Operator
To manually control when the MetalLB Operator upgrades in OpenShift Container Platform, you set installPlanApproval to Manual in the Subscription custom resource and approve the install plan. You then verify the upgrade by using the ClusterServiceVersion status.
Prerequisites
- You updated your cluster to the latest z-stream release.
- You used the software catalog to install the MetalLB Operator.
-
Access the cluster as a user with the
cluster-adminrole.
Procedure
Get the YAML definition of the
metallb-operatorsubscription in themetallb-systemnamespace by entering the following command:$ oc -n metallb-system get subscription metallb-operator -o yaml
Edit the
SubscriptionCR by setting theinstallPlanApprovalparameter toManual:apiVersion: operators.coreos.com/v1alpha1 kind: Subscription metadata: name: metallb-operator namespace: metallb-system # ... spec: channel: stable installPlanApproval: Manual name: metallb-operator source: redhat-operators sourceNamespace: openshift-marketplace # ...
Find the latest OpenShift Container Platform 4.22 version of the MetalLB Operator by entering the following command:
$ oc -n metallb-system get csv
Check the install plan that exists in the namespace by entering the following command.
$ oc -n metallb-system get installplan
The following example output shows
install-tsz2gas a manual install plan:NAME CSV APPROVAL APPROVED install-shpmd metallb-operator.v4.22.0-202502261233 Automatic true install-tsz2g metallb-operator.v4.22.0-202503102139 Manual false
Edit the install plan that exists in the namespace by entering the following command. Ensure that you replace
<name_of_installplan>with the name of the install plan, such asinstall-tsz2g.$ oc edit installplan <name_of_installplan> -n metallb-system
With the install plan open in your editor, set the
spec.approvalparameter toManualand set thespec.approvedparameter totrue.NoteAfter you edit the install plan, the upgrade operation starts. If you enter the
oc -n metallb-system get csvcommand during the upgrade operation, the output might show theReplacingor thePendingstatus.
Verification
To verify that the Operator is upgraded, enter the following command and then check that output shows
Succeededfor the Operator:$ oc -n metallb-system get csv
5.3.2. Additional resources
Chapter 6. Cluster Network Operator in OpenShift Container Platform
With the Cluster Network Operator, you can manage networking in OpenShift Container Platform, including how to view status, enable IP forwarding, and collect logs.
You can use the Cluster Network Operator (CNO) to deploy and manage cluster network components on an OpenShift Container Platform cluster, including the Container Network Interface (CNI) network plugin selected for the cluster during installation.
6.1. Cluster Network Operator
The Cluster Network Operator implements the network API from the operator.openshift.io API group. The Operator deploys the OVN-Kubernetes network plugin, or the network provider plugin that you selected during cluster installation, by using a daemon set.
The Cluster Network Operator is deployed during installation as a Kubernetes Deployment.
Procedure
Run the following command to view the Deployment status:
$ oc get -n openshift-network-operator deployment/network-operator
Example output
NAME               READY   UP-TO-DATE   AVAILABLE   AGE
network-operator   1/1     1            1           56m
Run the following command to view the state of the Cluster Network Operator:
$ oc get clusteroperator/network
Example output
NAME      VERSION   AVAILABLE   PROGRESSING   DEGRADED   SINCE
network   4.16.1     True        False         False      50m
The following fields provide information about the status of the operator:
AVAILABLE,PROGRESSING, andDEGRADED. TheAVAILABLEfield isTruewhen the Cluster Network Operator reports an available status condition.
6.2. Viewing the cluster network configuration
You can view your OpenShift Container Platform cluster network configuration by using the oc describe command for the network.config/cluster resource.
Procedure
Use the
oc describecommand to view the cluster network configuration:$ oc describe network.config/cluster
Example output
Name: cluster Namespace: Labels: <none> Annotations: <none> API Version: config.openshift.io/v1 Kind: Network Metadata: Creation Timestamp: 2024-08-08T11:25:56Z Generation: 3 Resource Version: 29821 UID: 808dd2be-5077-4ff7-b6bb-21b7110126c7 Spec: Cluster Network: Cidr: 10.128.0.0/14 Host Prefix: 23 External IP: Policy: Network Diagnostics: Mode: Source Placement: Target Placement: Network Type: OVNKubernetes Service Network: 172.30.0.0/16 Status Cluster Network: Cidr: 10.128.0.0/14 Host Prefix: 23 Cluster Network MTU: 1360 Conditions: Last Transition Time: 2024-08-08T11:51:50Z Message: Observed Generation: 0 Reason: AsExpected Status: True Type: NetworkDiagnosticsAvailable Network Type: OVNKubernetes Service Network: 172.30.0.0/16 Events: <none>where:
spec- Specifies the field that displays the configured state of the cluster network.
Status- Displays the current state of the cluster network configuration.
6.3. Viewing Cluster Network Operator status
You can inspect the status and view the details of the Cluster Network Operator by using the oc describe command.
Procedure
Run the following command to view the status of the Cluster Network Operator:
$ oc describe clusteroperators/network
6.4. Enabling IP forwarding globally
From OpenShift Container Platform 4.14 onward, OVN-Kubernetes disables global IP forwarding by default. By setting the Cluster Network Operator gatewayConfig.ipForwarding spec to Global, you can enable cluster-wide forwarding.
Procedure
Backup the existing network configuration by running the following command:
$ oc get network.operator cluster -o yaml > network-config-backup.yaml
Run the following command to modify the existing network configuration:
$ oc edit network.operator cluster
Add or update the following block under
specas illustrated in the following example:spec: clusterNetwork: - cidr: 10.128.0.0/14 hostPrefix: 23 serviceNetwork: - 172.30.0.0/16 networkType: OVNKubernetes clusterNetworkMTU: 8900 defaultNetwork: ovnKubernetesConfig: gatewayConfig: ipForwarding: Global- Save and close the file.
After applying the changes, the OpenShift Cluster Network Operator (CNO) applies the update across the cluster. You can monitor the progress by using the following command:
$ oc get clusteroperators network
The status should eventually report as
Available,Progressing=False, andDegraded=False.Alternatively, you can enable IP forwarding globally by running the following command:
$ oc patch network.operator cluster -p '{"spec":{"defaultNetwork":{"ovnKubernetesConfig":{"gatewayConfig":{"ipForwarding": "Global"}}}}}' --type=mergeNoteThe other valid option for this parameter is
Restrictedin case you want to revert this change.Restrictedis the default and with that setting global IP address forwarding is disabled.
6.5. Viewing Cluster Network Operator logs
You can view Cluster Network Operator logs by using the oc logs command.
Procedure
Run the following command to view the logs of the Cluster Network Operator:
$ oc logs --namespace=openshift-network-operator deployment/network-operator
6.6. Cluster Network Operator configuration
To manage cluster networking, configure the Cluster Network Operator (CNO) Network custom resource (CR) named cluster so the cluster uses the correct IP ranges and network plugin settings for reliable pod and service connectivity. Some settings and fields are inherited at the time of install or by the default.Network.type plugin, OVN-Kubernetes.
The CNO configuration inherits the following fields during cluster installation from the Network API in the Network.config.openshift.io API group:
clusterNetwork- IP address pools from which pod IP addresses are allocated.
serviceNetwork- IP address pool for services.
defaultNetwork.type-
Cluster network plugin.
OVNKubernetesis the only supported plugin during installation.
After cluster installation, you can only modify the clusterNetwork IP address range. The serviceNetwork range cannot be modified post-installation, either directly or by using the ServiceCIDR API.
You can specify the cluster network plugin configuration for your cluster by setting the fields for the defaultNetwork object in the CNO object named cluster.
6.6.1. Cluster Network Operator configuration object
The fields for the Cluster Network Operator (CNO) are described in the following table:
Table 6.1. Cluster Network Operator configuration object
| Field | Type | Description |
|---|---|---|
|
|
|
The name of the CNO object. This name is always |
|
|
| A list specifying the blocks of IP addresses from which pod IP addresses are allocated and the subnet prefix length assigned to each individual node in the cluster. If you use dual-stack networking, specify IPv4 and IPv6 address families. For example: spec:
clusterNetwork:
- cidr: 10.128.0.0/19
hostPrefix: 23
- cidr: fd01::/48
hostPrefix: 64
If you install a cluster on AWS with dual-stack networking, the order of addresses must match the dual-stack configuration you selected. For example, if you specified the |
|
|
| A block of IP addresses for services. If you use dual-stack networking, specify IPv4 and IPv6 address families. For example: spec: serviceNetwork: - 172.30.0.0/14 - fd02::/112
If you install a cluster on AWS with dual-stack networking, the order of addresses must match the dual-stack configuration you selected. For example, if you specified the
This value is ready-only and inherited from the |
|
|
| Configures the network plugin for the cluster network. |
|
|
|
This setting enables a dynamic routing provider. The FRR routing capability provider is required for the route advertisement feature. The only supported value is
spec:
  additionalRoutingCapabilities:
    providers:
- FRR |
For a cluster that needs to deploy objects across multiple networks, ensure that you specify the same value for the clusterNetwork.hostPrefix parameter for each network type that is defined in the install-config.yaml file. Setting a different value for each clusterNetwork.hostPrefix parameter can impact the OVN-Kubernetes network plugin, where the plugin cannot effectively route object traffic among different nodes.
6.6.2. defaultNetwork object configuration
The values for the defaultNetwork object are defined in the following table:
Table 6.2. defaultNetwork object
| Field | Type | Description |
|---|---|---|
|
|
|
Note OpenShift Container Platform uses the OVN-Kubernetes network plugin by default. |
|
|
| This object is only valid for the OVN-Kubernetes network plugin. |
6.6.3. Configuration for the OVN-Kubernetes network plugin
The following table describes the configuration fields for the OVN-Kubernetes network plugin:
Table 6.3. ovnKubernetesConfig object
| Field | Type | Description |
|---|---|---|
|
|
| The maximum transmission unit (MTU) for the Geneve (Generic Network Virtualization Encapsulation) overlay network. This value is normally configured automatically. |
|
|
| The UDP port for the Geneve overlay network. |
|
|
| An object describing the IPsec mode for the cluster. |
|
|
| Specifies a configuration object for IPv4 settings. |
|
|
| Specifies a configuration object for IPv6 settings. |
|
|
| Specify a configuration object for customizing network policy audit logging. If unset, the defaults audit log settings are used. |
|
|
|
Specifies whether to advertise cluster network routes. The default value is
|
|
|
|
Optional: Specify a configuration object for customizing how egress traffic is sent to the node gateway. Valid values are Note While migrating egress traffic, you can expect some disruption to workloads and service traffic until the Cluster Network Operator (CNO) successfully rolls out the changes. |
Table 6.4. ovnKubernetesConfig.ipv4 object
| Field | Type | Description |
|---|---|---|
|
| string |
If your existing network infrastructure overlaps with the
The default value is |
|
| string |
If your existing network infrastructure overlaps with the
The default value is |
Table 6.5. ovnKubernetesConfig.ipv6 object
| Field | Type | Description |
|---|---|---|
|
| string |
If your existing network infrastructure overlaps with the
The default value is |
|
| string |
If your existing network infrastructure overlaps with the
The default value is |
Table 6.6. policyAuditConfig object
| Field | Type | Description |
|---|---|---|
|
| integer |
The maximum number of messages to generate every second per node. The default value is |
|
| integer |
The maximum size for the audit log in bytes. The default value is |
|
| integer | The maximum number of log files that are retained. |
|
| string | One of the following additional audit log targets:
|
|
| string |
The syslog facility, such as |
Table 6.7. gatewayConfig object
| Field | Type | Description |
|---|---|---|
|
|
|
Set this field to
This field has an interaction with the Open vSwitch hardware offloading feature. If you set this field to |
|
|
|
You can control IP forwarding for all traffic on OVN-Kubernetes managed interfaces by using the Note
The default value of |
|
|
| Optional: Specify an object to configure the internal OVN-Kubernetes masquerade address for host to service traffic for IPv4 addresses. |
|
|
| Optional: Specify an object to configure the internal OVN-Kubernetes masquerade address for host to service traffic for IPv6 addresses. |
Table 6.8. gatewayConfig.ipv4 object
| Field | Type | Description |
|---|---|---|
|
|
|
The masquerade IPv4 addresses that are used internally to enable host to service traffic. The host is configured with these IP addresses and the shared gateway bridge interface. The default value is Important
For OpenShift Container Platform 4.17 and later versions, clusters use |
Table 6.9. gatewayConfig.ipv6 object
| Field | Type | Description |
|---|---|---|
|
|
|
The masquerade IPv6 addresses that are used internally to enable host to service traffic. The host is configured with these IP addresses and the shared gateway bridge interface. The default value is Important
For OpenShift Container Platform 4.17 and later versions, clusters use |
Table 6.10. ipsecConfig object
| Field | Type | Description |
|---|---|---|
|
|
| Specifies the behavior of the IPsec implementation. Must be one of the following values:
|
You can only change the configuration for your cluster network plugin during cluster installation, except for the gatewayConfig field that can be changed at runtime as a postinstallation activity.
Example OVN-Kubernetes configuration with IPsec enabled
defaultNetwork:
  type: OVNKubernetes
  ovnKubernetesConfig:
    mtu: 1400
    genevePort: 6081
    ipsecConfig:
mode: Full6.6.4. Cluster Network Operator example configuration
A complete CNO configuration is specified in the following example:
Example Cluster Network Operator object
apiVersion: operator.openshift.io/v1
kind: Network
metadata:
  name: cluster
spec:
  clusterNetwork:
  - cidr: 10.128.0.0/14
    hostPrefix: 23
  serviceNetwork:
  - 172.30.0.0/16
networkType: OVNKubernetes6.7. Additional resources
Chapter 7. DNS Operator in OpenShift Container Platform
In OpenShift Container Platform, the DNS Operator deploys and manages a CoreDNS instance to provide a name resolution service to pods inside the cluster, enables DNS-based Kubernetes Service discovery, and resolves internal cluster.local names.
7.1. Checking the status of the DNS Operator
You can check the DNS Operator deployment and cluster operator status. The DNS Operator is deployed during installation with a Deployment object.
The DNS Operator implements the dns API from the operator.openshift.io API group. The Operator deploys CoreDNS using a daemon set, creates a service for the daemon set, and configures the kubelet to instruct pods to use the CoreDNS service IP address for name resolution.
Procedure
Use the
oc getcommand to view the deployment status:$ oc get -n openshift-dns-operator deployment/dns-operator
Example output
NAME           READY     UP-TO-DATE   AVAILABLE   AGE
dns-operator   1/1       1            1           23h
Use the
oc getcommand to view the state of the DNS Operator:$ oc get clusteroperator/dns
Example output
NAME      VERSION     AVAILABLE   PROGRESSING   DEGRADED   SINCE   MESSAGE
dns       4.1.15-0.11  True        False         False      92m
AVAILABLE,PROGRESSING, andDEGRADEDprovide information about the status of the Operator.AVAILABLEisTruewhen at least 1 pod from the CoreDNS daemon set reports anAvailablestatus condition, and the DNS service has a cluster IP address.
7.2. View the default DNS
View the default DNS resource and cluster DNS settings to verify the DNS configuration or troubleshoot DNS issues.
Every new OpenShift Container Platform installation has a dns.operator named default.
Procedure
Use the
oc describecommand to view the defaultdns:$ oc describe dns.operator/default
Example output
Name:         default
Namespace:
Labels:       <none>
Annotations:  <none>
API Version:  operator.openshift.io/v1
Kind:         DNS
...
Status:
  Cluster Domain:  cluster.local
  Cluster IP:      172.30.0.10
...
where:
Status.Cluster Domain- Specifiecs the base DNS domain used to construct fully qualified pod and service domain names.
Status.Cluster IP- Specifies the address that pods query for name resolution. The IP is defined as the 10th address in the service CIDR range.
To find the service CIDR range, such as
172.30.0.0/16, of your cluster, use theoc getcommand:$ oc get networks.config/cluster -o jsonpath='{$.status.serviceNetwork}'
7.3. Using DNS forwarding
Configure DNS forwarding servers and upstream resolvers for the cluster.
You can use DNS forwarding to override the default forwarding configuration in the /etc/resolv.conf file in the following ways:
-
Specify name servers (
spec.servers) for every zone. If the forwarded zone is the ingress domain managed by OpenShift Container Platform, then the upstream name server must be authorized for the domain. -
Provide a list of upstream DNS servers (
spec.upstreamResolvers). - Change the default forwarding policy.
A DNS forwarding configuration for the default domain can have both the default servers specified in the /etc/resolv.conf file and the upstream DNS servers.
During pod creation, Kubernetes uses the /etc/resolv.conf file that exists on a node. If you modify the /etc/resolv.conf file on a host node, the changes do not propagate to the /etc/resolv.conf file that exists in a container. You must re-create the container for changes to take effect.
Procedure
Modify the DNS Operator object named
default:$ oc edit dns.operator/default
After you issue the previous command, the Operator creates and updates the config map named
dns-defaultwith additional server configuration blocks based onspec.servers. If none of the servers have a zone that matches the query, then name resolution falls back to the upstream DNS servers.Configuring DNS forwarding
apiVersion: operator.openshift.io/v1 kind: DNS metadata: name: default spec: cache: negativeTTL: 0s positiveTTL: 0s logLevel: Normal nodePlacement: {} operatorLogLevel: Normal servers: - name: example-server zones: - example.com forwardPlugin: policy: Random upstreams: - 1.1.1.1 - 2.2.2.2:5353 upstreamResolvers: policy: Random protocolStrategy: "" transportConfig: {} upstreams: - type: SystemResolvConf - type: Network address: 1.2.3.4 port: 53 status: clusterDomain: cluster.local clusterIP: x.y.z.10 conditions: ...where:
spec.servers.name-
Must comply with the
rfc6335service name syntax. spec.servers.zones-
Must conform to the
rfc1123subdomain syntax. The cluster domaincluster.localis invalid forzones. spec.servers.forwardPlugin.policy-
Specifies the upstream selection policy. Defaults to
Random; allowed values areRoundRobinandSequential. spec.servers.forwardPlugin.upstreams-
Must provide no more than 15
upstreamsentries perforwardPlugin. spec.upstreamResolvers.upstreams-
Specifies an
upstreamResolversto override the default forwarding policy and forward DNS resolution to the specified DNS resolvers (upstream resolvers) for the default domain. You can use this field when you need custom upstream resolvers; otherwise queries use the servers declared in/etc/resolv.conf. spec.upstreamResolvers.policy-
Specifies the upstream selection order. Defaults to
Sequential; allowed values areRandom,RoundRobin, andSequential. spec.upstreamResolvers.protocolStrategy-
Specify
TCPto force the protocol to use for upstream DNS requests, even if the request uses UDP. Valid values areTCPand omitted. When omitted, the platform chooses a default, normally the protocol of the original client request. spec.upstreamResolvers.transportConfig- Specifies the transport type, server name, and optional custom CA or CA bundle to use when forwarding DNS requests to an upstream resolver.
spec.upstreamResolvers.upstreams.type-
Specifies two types of
upstreams:SystemResolvConforNetwork.SystemResolvConfconfigures the upstream to use/etc/resolv.confandNetworkdefines aNetworkresolver. You can specify one or both. spec.upstreamResolvers.upstreams.address-
Specifies a valid IPv4 or IPv6 address when type is
Network. spec.upstreamResolvers.upstreams.port-
Specifies an optional field to provide a port number. Valid values are between
1and65535; defaults to 853 when omitted.
Additional resources
7.4. Checking DNS Operator status
You can inspect the status and view the details of the DNS Operator by using the oc describe command.
Procedure
View the status of the DNS Operator:
$ oc describe clusteroperators/dns
Though the messages and spelling might vary in a specific release, the expected status output looks like:
Status:
  Conditions:
    Last Transition Time:  <date>
    Message:               DNS "default" is available.
    Reason:                AsExpected
    Status:                True
    Type:                  Available
    Last Transition Time:  <date>
    Message:               Desired and current number of DNSes are equal
    Reason:                AsExpected
    Status:                False
    Type:                  Progressing
    Last Transition Time:  <date>
    Reason:                DNSNotDegraded
    Status:                False
    Type:                  Degraded
    Last Transition Time:  <date>
    Message:               DNS default is upgradeable: DNS Operator can be upgraded
    Reason:                DNSUpgradeable
    Status:                True
    Type:                  Upgradeable
7.5. Viewing DNS Operator logs
You can view DNS Operator logs to troubleshoot DNS issues, verify configuration changes, and monitor activity by using the by using the oc logs command.
Procedure
View the logs of the DNS Operator by running the following command:
$ oc logs -n openshift-dns-operator deployment/dns-operator -c dns-operator
7.6. Setting the CoreDNS log level
Set CoreDNS log levels to control the detail of DNS error logging.
Log levels for CoreDNS and the CoreDNS Operator are set by using different methods. You can configure the CoreDNS log level to determine the amount of detail in logged error messages. The valid values for CoreDNS log level are Normal, Debug, and Trace. The default logLevel is Normal.
The CoreDNS error log level is always enabled. The following log level settings report different error responses:
-
logLevel:Normalenables the "errors" class:log . { class error }. -
logLevel:Debugenables the "denial" class:log . { class denial error }. -
logLevel:Traceenables the "all" class:log . { class all }.
Procedure
To set
logLeveltoDebug, enter the following command:$ oc patch dnses.operator.openshift.io/default -p '{"spec":{"logLevel":"Debug"}}' --type=mergeTo set
logLeveltoTrace, enter the following command:$ oc patch dnses.operator.openshift.io/default -p '{"spec":{"logLevel":"Trace"}}' --type=merge
Verification
To ensure the desired log level was set, check the config map:
$ oc get configmap/dns-default -n openshift-dns -o yaml
For example, after setting the
logLeveltoTrace, you should see this stanza in each server block:errors log . { class all }
7.7. Viewing the CoreDNS logs
You can view CoreDNS pod logs to troubleshoot DNS issues by using the oc logs command.
Procedure
View the logs of a specific CoreDNS pod by entering the following command:
$ oc -n openshift-dns logs -c dns <core_dns_pod_name>
Follow the logs of all CoreDNS pods by entering the following command:
$ oc -n openshift-dns logs -c dns -l dns.operator.openshift.io/daemonset-dns=default -f --max-log-requests=<number> 1-
<number>: Specifies the number of DNS pods to stream logs from. The maximum is 6.
-
7.8. Setting the CoreDNS Operator log level
You can configure the Operator log level to quickly track down OpenShift DNS issues.
The valid values for operatorLogLevel are Normal, Debug, and Trace. Trace has the most detailed information. The default operatorlogLevel is Normal. There are seven logging levels for Operator issues: Trace, Debug, Info, Warning, Error, Unrecoverable, and Panic. After the logging level is set, log entries with that severity or anything above it will be logged.
-
operatorLogLevel: "Normal"setslogrus.SetLogLevel("Info"). -
operatorLogLevel: "Debug"setslogrus.SetLogLevel("Debug"). -
operatorLogLevel: "Trace"setslogrus.SetLogLevel("Trace").
Procedure
To set
operatorLogLeveltoDebug, enter the following command:$ oc patch dnses.operator.openshift.io/default -p '{"spec":{"operatorLogLevel":"Debug"}}' --type=mergeTo set
operatorLogLeveltoTrace, enter the following command:$ oc patch dnses.operator.openshift.io/default -p '{"spec":{"operatorLogLevel":"Trace"}}' --type=merge
Verification
To review the resulting change, enter the following command:
$ oc get dnses.operator -A -oyaml
You should see two log level entries. The
operatorLogLevelapplies to OpenShift DNS Operator issues, and thelogLevelapplies to the daemonset of CoreDNS pods:logLevel: Trace operatorLogLevel: Debug
To review the logs for the daemonset, enter the following command:
$ oc logs -n openshift-dns ds/dns-default
7.9. Tuning the CoreDNS cache
To reduce the load on upstream DNS resolvers, you can tune the CoreDNS cache by adjusting the duration of positive and negative caching. This process involves modifying the time-to-live (TTL) values within the DNS Operator object to control how long query responses are stored.
For CoreDNS, you can configure the maximum duration of both successful or unsuccessful caching, also known respectively as positive or negative caching. Tuning the cache duration of DNS query responses can reduce the load for any upstream DNS resolvers.
You can shorten the TTL of the DNS record by setting a lower positive cache. You cannot increase the TTL on the DNS record by setting a higher positive cache. The maximum cache is the lower of the TTL of the DNS record or the positive cache.
Setting TTL fields to low values could lead to an increased load on the cluster, any upstream resolvers, or both.
Procedure
Edit the DNS Operator object named
defaultby running the following command:$ oc edit dns.operator.openshift.io/default
Modify the time-to-live (TTL) caching values:
Configuring DNS caching
apiVersion: operator.openshift.io/v1 kind: DNS metadata: name: default spec: cache: positiveTTL: 1h negativeTTL: 0.5h10mwhere:
spec.cache.positiveTTL-
Specifies a string value that is converted to its respective number of seconds by CoreDNS. If this field is omitted, the value is assumed to be
0sand the cluster uses the internal default value of900sas a fallback. spec.cache.negativeTTL-
Specifies a string value that is converted to its respective number of seconds by CoreDNS. If this field is omitted, the value is assumed to be
0sand the cluster uses the internal default value of30sas a fallback.
Verification
To review the change, look at the config map again by running the following command:
$ oc get configmap/dns-default -n openshift-dns -o yaml
Verify that you see entries that look like the following example:
       cache 3600 {
            denial 9984 2400
        }
Additional resources
7.9.1. Changing the DNS Operator managementState
You can change from the default Managed state to Unmanaged to stop the DNS Operator from managing its resources in order to apply a workaround or test a configuration change.
The DNS Operator manages the CoreDNS component to provide a name resolution service for pods and services in the cluster. The managementState of the DNS Operator is set to Managed by default, which means that the DNS Operator is actively managing its resources. You can change it to Unmanaged, which means the DNS Operator is not managing its resources.
The following are use cases for changing the DNS Operator managementState:
-
You are a developer and want to test a configuration change to see if it fixes an issue in CoreDNS. You can stop the DNS Operator from overwriting the configuration change by setting the
managementStatetoUnmanaged. -
You are a cluster administrator and have reported an issue with CoreDNS, but need to apply a workaround until the issue is fixed. You can set the
managementStatefield of the DNS Operator toUnmanagedto apply the workaround.
You cannot upgrade while the managementState is set to Unmanaged.
Procedure
Change
managementStatetoUnmanagedin the DNS Operator by running the following command:oc patch dns.operator.openshift.io default --type merge --patch '{"spec":{"managementState":"Unmanaged"}}'Review
managementStateof the DNS Operator by using thejsonpathcommand-line JSON parser:$ oc get dns.operator.openshift.io default -ojsonpath='{.spec.managementState}'
7.9.2. Controlling DNS pod placement
Control where CoreDNS and node-resolver pods run by using taints, tolerations, and selectors.
The DNS Operator has two daemon sets: one for CoreDNS called dns-default and one for managing the /etc/hosts file called node-resolver.
You can assign and run CoreDNS pods on specified nodes. For example, if the cluster administrator has configured security policies that prohibit communication between pairs of nodes, you can configure CoreDNS pods to run on a restricted set of nodes.
DNS service is available to all pods if the following circumstances are true:
- DNS pods are running on some nodes in the cluster.
- The nodes on which DNS pods are not running have network connectivity to nodes on which DNS pods are running,
The node-resolver daemon set must run on every node host because it adds an entry for the cluster image registry to support pulling images. The node-resolver pods have only one job: to look up the image-registry.openshift-image-registry.svc service’s cluster IP address and add it to /etc/hosts on the node host so that the container runtime can resolve the service name.
As a cluster administrator, you can use a custom node selector to configure the daemon set for CoreDNS to run or not run on certain nodes.
Prerequisites
-
You installed the
ocCLI. -
You are logged in to the cluster as a user with
cluster-adminprivileges. -
Your DNS Operator
managementStateis set toManaged.
Procedure
To allow the daemon set for CoreDNS to run on certain nodes, configure a taint and toleration:
Set a taint on the nodes that you want to control DNS pod placement by entering the following command:
$ oc adm taint nodes <node_name> dns-only=abc:NoExecute
-
Replace
<node_name>with the actual name of the node.
-
Replace
Modify the DNS Operator object named
defaultto include the corresponding toleration by entering the following command:$ oc edit dns.operator/default
Specify a taint key and a toleration for the taint. The following toleration matches the taint set on the nodes.
apiVersion: operator.openshift.io/v1 kind: DNS metadata: name: default spec: nodePlacement: tolerations: - effect: NoExecute key: "dns-only" operator: Equal value: abc tolerationSeconds: 3600-
If the
keyfield is set todns-only, it can be tolerated indefinitely. -
The
tolerationSecondsfield is optional.
-
If the
Optional: To specify node placement using a node selector, modify the default DNS Operator:
Edit the DNS Operator object named
defaultto include a node selector:apiVersion: operator.openshift.io/v1 kind: DNS metadata: name: default spec: nodePlacement: nodeSelector: node-role.kubernetes.io/control-plane: ""-
The
spec.nodePlacement.nodeSelectorfield in the example ensures that the CoreDNS pods run only on control plane nodes.
-
The
7.9.3. Configuring DNS forwarding with TLS
Configure DNS forwarding with TLS to secure queries to upstream resolvers.
When working in a highly regulated environment, you might need the ability to secure DNS traffic when forwarding requests to upstream resolvers so that you can ensure additional DNS traffic and data privacy.
Be aware that CoreDNS caches forwarded connections for 10 seconds. CoreDNS will hold a TCP connection open for those 10 seconds if no request is issued.
With large clusters, ensure that your DNS server is aware that it might get many new connections to hold open because you can initiate a connection per node. Set up your DNS hierarchy accordingly to avoid performance issues.
Procedure
Modify the DNS Operator object named
default:$ oc edit dns.operator/default
Cluster administrators can configure transport layer security (TLS) for forwarded DNS queries.
Configuring DNS forwarding with TLS
apiVersion: operator.openshift.io/v1 kind: DNS metadata: name: default spec: servers: - name: example_server zones: - example.com forwardPlugin: transportConfig: transport: TLS tls: caBundle: name: mycacert serverName: dnstls.example.com policy: Random upstreams: - 1.1.1.1 - 2.2.2.2:5353 upstreamResolvers: transportConfig: transport: TLS tls: caBundle: name: mycacert serverName: dnstls.example.com upstreams: - type: Network address: 1.2.3.4 port: 53where:
spec.servers.name-
Must comply with the
rfc6335service name syntax. spec.servers.zones-
Must conform to the
rfc1123subdomain syntax. The cluster domain,cluster.local, is invalid forzones. spec.servers.forwardPlugin.transportConfig.transport-
Must be set to
TLSwhen configuring TLS forwarding. spec.servers.forwardPlugin.transportConfig.tls.serverName- Must be set to the server name indication (SNI) server name used to validate the upstream TLS certificate.
spec.servers.forwardPlugin.policy-
Specifies the upstream selection policy. Defaults to
Random; valid values areRoundRobinandSequential. spec.servers.forwardPlugin.upstreams-
Must provide upstream resolvers; maximum 15 entries per
forwardPlugin. spec.upstreamResolvers.upstreams-
Specifies an optional field to override the default policy for the default domain. Use the
Networktype only when TLS is enabled and provide an IP address. If omitted, queries use/etc/resolv.conf. spec.upstreamResolvers.upstreams.address- Must be a valid IPv4 or IPv6 address.
spec.upstreamResolvers.upstreams.portSpecifies an optional field to provide a port number. Valid values are between
1and65535; defaults to 853 when omitted.NoteIf
serversis undefined or invalid, the config map only contains the default server.
Verification
View the config map:
$ oc get configmap/dns-default -n openshift-dns -o yaml
Sample DNS ConfigMap based on TLS forwarding example
apiVersion: v1 data: Corefile: | example.com:5353 { forward . 1.1.1.1 2.2.2.2:5353 } bar.com:5353 example.com:5353 { forward . 3.3.3.3 4.4.4.4:5454 } .:5353 { errors health kubernetes cluster.local in-addr.arpa ip6.arpa { pods insecure upstream fallthrough in-addr.arpa ip6.arpa } prometheus :9153 forward . /etc/resolv.conf 1.2.3.4:53 { policy Random } cache 30 reload } kind: ConfigMap metadata: labels: dns.operator.openshift.io/owning-dns: default name: dns-default namespace: openshift-dns-
The
data.Corefilekey contains the Corefile configuration for the DNS server. Changes to theforwardPlugintriggers a rolling update of the CoreDNS daemon set.
-
The
Additional resources
Chapter 8. Ingress Operator in OpenShift Container Platform
The Ingress Operator implements the IngressController API and is the component responsible for enabling external access to OpenShift Container Platform cluster services.
8.1. OpenShift Container Platform Ingress Operator
When you create your OpenShift Container Platform cluster, pods and services running on the cluster are each allocated their own IP addresses. The IP addresses are accessible to other pods and services running nearby but are not accessible to outside clients.
The Ingress Operator makes it possible for external clients to access your service by deploying and managing one or more HAProxy-based Content from kubernetes.io is not included.Ingress Controllers to handle routing. You can use the Ingress Operator to route traffic by specifying OpenShift Container Platform Route and Kubernetes Ingress resources. Configurations within the Ingress Controller, such as the ability to define endpointPublishingStrategy type and internal load balancing, provide ways to publish Ingress Controller endpoints.
8.2. The Ingress configuration asset
The installation program generates an asset with an Ingress resource in the config.openshift.io API group, cluster-ingress-02-config.yml.
YAML Definition of the Ingress resource
apiVersion: config.openshift.io/v1
kind: Ingress
metadata:
  name: cluster
spec:
  domain: apps.openshiftdemos.com
The installation program stores this asset in the cluster-ingress-02-config.yml file in the manifests/ directory. This Ingress resource defines the cluster-wide configuration for Ingress. This Ingress configuration is used as follows:
- The Ingress Operator uses the domain from the cluster Ingress configuration as the domain for the default Ingress Controller.
-
The OpenShift API Server Operator uses the domain from the cluster Ingress configuration. This domain is also used when generating a default host for a
Routeresource that does not specify an explicit host.
8.3. Ingress Controller configuration parameters
The IngressController custom resource (CR) includes optional configuration parameters that you can configure to meet specific needs for your organization.
| Parameter | Description |
|---|---|
|
|
The
If empty, the default value is |
|
|
|
|
|
For cloud environments, use the
On Google Cloud, AWS, and Azure you can configure the following
If not set, the default value is based on
For most platforms, the
For non-cloud environments, such as a bare-metal platform, use the
If you do not set a value in one of these fields, the default value is based on binding ports specified in the
If you need to update the
|
|
|
The
The secret must contain the following keys and data: *
If not set, a wildcard certificate is automatically generated and used. The certificate is valid for the Ingress Controller The in-use certificate, whether generated or user-specified, is automatically integrated with OpenShift Container Platform built-in OAuth server. |
|
|
|
|
|
|
|
|
If not set, the defaults values are used. Note
The nodePlacement:
nodeSelector:
matchLabels:
kubernetes.io/os: linux
tolerations:
- effect: NoSchedule
operator: Exists |
|
|
If not set, the default value is based on the
When using the
The minimum TLS version for Ingress Controllers is Note
Ciphers and the minimum TLS version of the configured security profile are reflected in the Important
The Ingress Operator converts the TLS |
|
|
The
The |
|
|
|
|
|
|
|
|
By setting the
By default, the policy is set to
By setting These adjustments are only applied to cleartext, edge-terminated, and re-encrypt routes, and only when using HTTP/1.
For request headers, these adjustments are applied only for routes that have the
|
|
|
|
|
|
|
|
|
For any cookie that you want to capture, the following parameters must be in your
For example: httpCaptureCookies:
- matchType: Exact
maxLength: 128
name: MYCOOKIE |
|
|
  httpCaptureHeaders:
    request:
    - maxLength: 256
      name: Connection
    - maxLength: 128
      name: User-Agent
    response:
    - maxLength: 256
      name: Content-Type
    - maxLength: 256
name: Content-Length |
|
|
|
|
|
The
|
|
|
The
These connections come from load balancer health probes or web browser speculative connections (preconnect) and can be safely ignored. However, these requests can be caused by network errors, so setting this field to |
8.3.1. Ingress Controller TLS security profiles
TLS security profiles provide a way for servers to regulate which ciphers a connecting client can use when connecting to the server.
8.3.1.1. Understanding TLS security profiles
You can use a TLS (Transport Layer Security) security profile, as described in this section, to define which TLS ciphers are required by various OpenShift Container Platform components.
The OpenShift Container Platform TLS security profiles are based on Content from wiki.mozilla.org is not included.Mozilla recommended configurations.
You can specify one of the following TLS security profiles for each component:
Table 8.1. TLS security profiles
| Profile | Description |
|---|---|
|
| This profile is intended for use with legacy clients or libraries. The profile is based on the Content from wiki.mozilla.org is not included.Old backward compatibility recommended configuration.
The Note For the Ingress Controller, the minimum TLS version is converted from 1.0 to 1.1. |
|
| This profile is the default TLS security profile for the Ingress Controller, kubelet, and control plane. The profile is based on the Content from wiki.mozilla.org is not included.Intermediate compatibility recommended configuration.
The Note This profile is the recommended configuration for the majority of clients. |
|
| This profile is intended for use with modern clients that have no need for backwards compatibility. This profile is based on the Content from wiki.mozilla.org is not included.Modern compatibility recommended configuration.
The |
|
| This profile allows you to define the TLS version and ciphers to use. Warning
Use caution when using a |
When using one of the predefined profile types, the effective profile configuration is subject to change between releases. For example, given a specification to use the Intermediate profile deployed on release X.Y.Z, an upgrade to release X.Y.Z+1 might cause a new profile configuration to be applied, resulting in a rollout.
8.3.1.2. Configuring the TLS security profile for the Ingress Controller
To configure a TLS security profile for an Ingress Controller, edit the IngressController custom resource (CR) to specify a predefined or custom TLS security profile.
If a TLS security profile is not configured, the default value is based on the TLS security profile set for the API server, as shown in the following example:
apiVersion: operator.openshift.io/v1
kind: IngressController
 ...
spec:
  tlsSecurityProfile:
    old: {}
type: OldThe TLS security profile defines the minimum TLS version and the TLS ciphers for TLS connections for Ingress Controllers.
You can see the ciphers and the minimum TLS version of the configured TLS security profile in the IngressController custom resource (CR) under Status.Tls Profile and the configured TLS security profile under Spec.Tls Security Profile. For the Custom TLS security profile, the specific ciphers and minimum TLS version are listed under both parameters.
The HAProxy Ingress Controller image supports TLS 1.3 and the Modern profile.
The Ingress Operator also converts the TLS 1.0 of an Old or Custom profile to 1.1.
Prerequisites
-
You have access to the cluster as a user with the
cluster-adminrole.
Procedure
Edit the
IngressControllerCR in theopenshift-ingress-operatorproject to configure the TLS security profile:$ oc edit IngressController default -n openshift-ingress-operator.
Add the
spec.tlsSecurityProfilefield:Sample
IngressControllerCR for aCustomprofileapiVersion: operator.openshift.io/v1 kind: IngressController ... spec: tlsSecurityProfile: type: Custom custom: ciphers: - ECDHE-ECDSA-CHACHA20-POLY1305 - ECDHE-RSA-CHACHA20-POLY1305 - ECDHE-RSA-AES128-GCM-SHA256 - ECDHE-ECDSA-AES128-GCM-SHA256 minTLSVersion: VersionTLS11 ...-
Specify the value for the
spec.tlsSecurityProfileparameter. The TLS security profile types areOld,Intermediate, orCustom. The default type isIntermediate. -
Specify the appropriate field for the selected
spec.tlsSecurityProfile.type. The fields areold: {},intermediate: {},modern: {}, orcustom:. -
For the
customtype, specify a list of TLS ciphers and the minimum accepted TLS version.
-
Specify the value for the
- Save the file to apply the changes.
Verification
Verify that the profile is set in the
IngressControllerCR:$ oc describe IngressController default -n openshift-ingress-operator
Example output
Name:         default
Namespace:    openshift-ingress-operator
Labels:       <none>
Annotations:  <none>
API Version:  operator.openshift.io/v1
Kind:         IngressController
 ...
Spec:
 ...
  Tls Security Profile:
    Custom:
      Ciphers:
        ECDHE-ECDSA-CHACHA20-POLY1305
        ECDHE-RSA-CHACHA20-POLY1305
        ECDHE-RSA-AES128-GCM-SHA256
        ECDHE-ECDSA-AES128-GCM-SHA256
      Min TLS Version:  VersionTLS11
    Type:               Custom
 ...
8.3.1.3. Configuring mutual TLS authentication
You can configure the Ingress Controller to enable mutual TLS (mTLS) authentication by setting a spec.clientTLS value. The clientTLS value configures the Ingress Controller to verify client certificates. This configuration includes setting a clientCA value, which is a reference to a config map. The config map contains the PEM-encoded CA certificate bundle that is used to verify a client’s certificate. Optionally, you can also configure a list of certificate subject filters.
If the clientCA value specifies an X509v3 certificate revocation list (CRL) distribution point, the Ingress Operator downloads and manages a CRL config map based on the HTTP URI X509v3 CRL Distribution Point specified in each provided certificate. The Ingress Controller uses this config map during mTLS/TLS negotiation. Requests that do not provide valid certificates are rejected.
Prerequisites
-
You have access to the cluster as a user with the
cluster-adminrole. - You have a PEM-encoded CA certificate bundle.
If your CA bundle references a CRL distribution point, you must have also included the end-entity or leaf certificate to the client CA bundle. This certificate must have included an HTTP URI under
CRL Distribution Points, as described in RFC 5280. For example:Issuer: C=US, O=Example Inc, CN=Example Global G2 TLS RSA SHA256 2020 CA1 Subject: SOME SIGNED CERT X509v3 CRL Distribution Points: Full Name: URI:http://crl.example.com/example.crl
Procedure
In the
openshift-confignamespace, create a config map from your CA bundle:$ oc create configmap \ router-ca-certs-default \ --from-file=ca-bundle.pem=client-ca.crt \1 -n openshift-configEdit the
IngressControllerresource in theopenshift-ingress-operatorproject:$ oc edit IngressController default -n openshift-ingress-operator
Add the
spec.clientTLSfield and subfields to configure mutual TLS:Sample
IngressControllerCR for aclientTLSprofile that specifies filtering patternsapiVersion: operator.openshift.io/v1 kind: IngressController metadata: name: default namespace: openshift-ingress-operator spec: clientTLS: clientCertificatePolicy: Required clientCA: name: router-ca-certs-default allowedSubjectPatterns: - "^/CN=example.com/ST=NC/C=US/O=Security/OU=OpenShift$"-
Optional, get the Distinguished Name (DN) for
allowedSubjectPatternsby entering the following command.
$ openssl  x509 -in custom-cert.pem  -noout -subject
subject= /CN=example.com/ST=NC/C=US/O=Security/OU=OpenShift
8.4. View the default Ingress Controller
The Ingress Operator is a core feature of OpenShift Container Platform and is enabled out of the box.
Every new OpenShift Container Platform installation has an ingresscontroller named default. It can be supplemented with additional Ingress Controllers. If the default ingresscontroller is deleted, the Ingress Operator will automatically recreate it within a minute.
Procedure
View the default Ingress Controller:
$ oc describe --namespace=openshift-ingress-operator ingresscontroller/default
8.5. View Ingress Operator status
You can view and inspect the status of your Ingress Operator.
Procedure
View your Ingress Operator status:
$ oc describe clusteroperators/ingress
8.6. View Ingress Controller logs
You can view your Ingress Controller logs.
Procedure
View your Ingress Controller logs:
$ oc logs --namespace=openshift-ingress-operator deployments/ingress-operator -c <container_name>
8.7. View Ingress Controller status
Your can view the status of a particular Ingress Controller.
Procedure
View the status of an Ingress Controller:
$ oc describe --namespace=openshift-ingress-operator ingresscontroller/<name>
8.8. Creating a custom Ingress Controller
As a cluster administrator, you can create a new custom Ingress Controller. Because the default Ingress Controller might change during OpenShift Container Platform updates, creating a custom Ingress Controller can be helpful when maintaining a configuration manually that persists across cluster updates.
This example provides a minimal spec for a custom Ingress Controller. To further customize your custom Ingress Controller, see "Configuring the Ingress Controller".
Prerequisites
-
Install the OpenShift CLI (
oc). -
Log in as a user with
cluster-adminprivileges.
Procedure
Create a YAML file that defines the custom
IngressControllerobject:Example
custom-ingress-controller.yamlfileapiVersion: operator.openshift.io/v1 kind: IngressController metadata: name: <custom_name> 1 namespace: openshift-ingress-operator spec: defaultCertificate: name: <custom-ingress-custom-certs> 2 replicas: 1 3 domain: <custom_domain> 4- 1
- Specify the a custom
namefor theIngressControllerobject. - 2
- Specify the name of the secret with the custom wildcard certificate.
- 3
- Minimum replica needs to be ONE
- 4
- Specify the domain to your domain name. The domain specified on the IngressController object and the domain used for the certificate must match. For example, if the domain value is "custom_domain.mycompany.com", then the certificate must have SAN *.custom_domain.mycompany.com (with the
*.added to the domain).
Create the object by running the following command:
$ oc create -f custom-ingress-controller.yaml
8.9. Configuring the Ingress Controller
8.9.1. Setting a custom default certificate
As an administrator, you can configure an Ingress Controller to use a custom certificate by creating a Secret resource and editing the IngressController custom resource (CR).
Prerequisites
- You must have a certificate/key pair in PEM-encoded files, where the certificate is signed by a trusted certificate authority or by a private trusted certificate authority that you configured in a custom PKI.
Your certificate meets the following requirements:
- The certificate is valid for the ingress domain.
-
The certificate uses the
subjectAltNameextension to specify a wildcard domain, such as*.apps.ocp4.example.com.
You must have an
IngressControllerCR, which includes just having thedefaultIngressControllerCR. You can run the following command to check that you have anIngressControllerCR:$ oc --namespace openshift-ingress-operator get ingresscontrollers
If you have intermediate certificates, they must be included in the tls.crt file of the secret containing a custom default certificate. Order matters when specifying a certificate; list your intermediate certificate(s) after any server certificate(s).
Procedure
The following assumes that the custom certificate and key pair are in the tls.crt and tls.key files in the current working directory. Substitute the actual path names for tls.crt and tls.key. You also may substitute another name for custom-certs-default when creating the Secret resource and referencing it in the IngressController CR.
This action will cause the Ingress Controller to be redeployed, using a rolling deployment strategy.
Create a Secret resource containing the custom certificate in the
openshift-ingressnamespace using thetls.crtandtls.keyfiles.$ oc --namespace openshift-ingress create secret tls custom-certs-default --cert=tls.crt --key=tls.key
Update the IngressController CR to reference the new certificate secret:
$ oc patch --type=merge --namespace openshift-ingress-operator ingresscontrollers/default \ --patch '{"spec":{"defaultCertificate":{"name":"custom-certs-default"}}}'Verify the update was effective:
$ echo Q |\
  openssl s_client -connect console-openshift-console.apps.<domain>:443 -showcerts 2>/dev/null |\
  openssl x509 -noout -subject -issuer -enddate
where:
<domain>- Specifies the base domain name for your cluster.
Example output
subject=C = US, ST = NC, L = Raleigh, O = RH, OU = OCP4, CN = *.apps.example.com
issuer=C = US, ST = NC, L = Raleigh, O = RH, OU = OCP4, CN = example.com
notAfter=May 10 08:32:45 2022 GM
TipYou can alternatively apply the following YAML to set a custom default certificate:
apiVersion: operator.openshift.io/v1 kind: IngressController metadata: name: default namespace: openshift-ingress-operator spec: defaultCertificate: name: custom-certs-defaultThe certificate secret name should match the value used to update the CR.
Once the IngressController CR has been modified, the Ingress Operator updates the Ingress Controller’s deployment to use the custom certificate.
8.9.2. Removing a custom default certificate
As an administrator, you can remove a custom certificate that you configured an Ingress Controller to use.
Prerequisites
-
You have access to the cluster as a user with the
cluster-adminrole. -
You have installed the OpenShift CLI (
oc). - You previously configured a custom default certificate for the Ingress Controller.
Procedure
To remove the custom certificate and restore the certificate that ships with OpenShift Container Platform, enter the following command:
$ oc patch -n openshift-ingress-operator ingresscontrollers/default \
  --type json -p $'- op: remove\n  path: /spec/defaultCertificate'
There can be a delay while the cluster reconciles the new certificate configuration.
Verification
To confirm that the original cluster certificate is restored, enter the following command:
$ echo Q | \
  openssl s_client -connect console-openshift-console.apps.<domain>:443 -showcerts 2>/dev/null | \
  openssl x509 -noout -subject -issuer -enddate
where:
<domain>- Specifies the base domain name for your cluster.
Example output
subject=CN = *.apps.<domain>
issuer=CN = ingress-operator@1620633373
notAfter=May 10 10:44:36 2023 GMT
8.9.3. Autoscaling an Ingress Controller
You can automatically scale an Ingress Controller to dynamically meet routing performance or availability requirements. For example, the requirement to increase throughput.
The following procedure provides an example for scaling up the default Ingress Controller.
Prerequisites
-
You have the OpenShift CLI (
oc) installed. -
You have access to an OpenShift Container Platform cluster as a user with the
cluster-adminrole. On VMware vSphere, bare-metal, and Nutanix installer-provisioned infrastructure, scaling up Ingress Controller pods does not improve external traffic performance. To improve performance, ensure that you complete the following prerequisites:
- You manually configured a user-managed load balancer for your cluster.
- You ensured that the load balancer was configured for the cluster nodes that handle incoming traffic from the Ingress Controller.
You installed the Custom Metrics Autoscaler Operator and an associated KEDA Controller.
-
You can install the Operator by using the software catalog on the web console. After you install the Operator, you can create an instance of
KedaController.
-
You can install the Operator by using the software catalog on the web console. After you install the Operator, you can create an instance of
Procedure
Create a service account to authenticate with Thanos by running the following command:
$ oc create -n openshift-ingress-operator serviceaccount thanos && oc describe -n openshift-ingress-operator serviceaccount thanos
Example output
Name:                thanos
Namespace:           openshift-ingress-operator
Labels:              <none>
Annotations:         <none>
Image pull secrets:  thanos-dockercfg-kfvf2
Mountable secrets:   thanos-dockercfg-kfvf2
Tokens:              <none>
Events:              <none>
Manually create the service account secret token with the following command:
$ oc apply -f - <<EOF apiVersion: v1 kind: Secret metadata: name: thanos-token namespace: openshift-ingress-operator annotations: kubernetes.io/service-account.name: thanos type: kubernetes.io/service-account-token EOFDefine a
TriggerAuthenticationobject within theopenshift-ingress-operatornamespace by using the service account’s token.Create the
TriggerAuthenticationobject and pass the value of thesecretvariable to theTOKENparameter:$ oc apply -f - <<EOF apiVersion: keda.sh/v1alpha1 kind: TriggerAuthentication metadata: name: keda-trigger-auth-prometheus namespace: openshift-ingress-operator spec: secretTargetRef: - parameter: bearerToken name: thanos-token key: token - parameter: ca name: thanos-token key: ca.crt EOF
Create and apply a role for reading metrics from Thanos:
Create a new role,
thanos-metrics-reader.yaml, that reads metrics from pods and nodes:thanos-metrics-reader.yaml
apiVersion: rbac.authorization.k8s.io/v1
kind: Role
metadata:
  name: thanos-metrics-reader
  namespace: openshift-ingress-operator
rules:
- apiGroups:
  - ""
  resources:
  - pods
  - nodes
  verbs:
  - get
- apiGroups:
  - metrics.k8s.io
  resources:
  - pods
  - nodes
  verbs:
  - get
  - list
  - watch
- apiGroups:
  - ""
  resources:
  - namespaces
  verbs:
  - get
Apply the new role by running the following command:
$ oc apply -f thanos-metrics-reader.yaml
Add the new role to the service account by entering the following commands:
$ oc adm policy -n openshift-ingress-operator add-role-to-user thanos-metrics-reader -z thanos --role-namespace=openshift-ingress-operator
$ oc adm policy -n openshift-ingress-operator add-cluster-role-to-user cluster-monitoring-view -z thanos
NoteThe argument
add-cluster-role-to-useris only required if you use cross-namespace queries. The following step uses a query from thekube-metricsnamespace which requires this argument.Create a new
ScaledObjectYAML file,ingress-autoscaler.yaml, that targets the default Ingress Controller deployment:Example
ScaledObjectdefinitionapiVersion: keda.sh/v1alpha1 kind: ScaledObject metadata: name: ingress-scaler namespace: openshift-ingress-operator spec: scaleTargetRef: 1 apiVersion: operator.openshift.io/v1 kind: IngressController name: default envSourceContainerName: ingress-operator minReplicaCount: 1 maxReplicaCount: 20 2 cooldownPeriod: 1 pollingInterval: 1 triggers: - type: prometheus metricType: AverageValue metadata: serverAddress: https://thanos-querier.openshift-monitoring.svc.cluster.local:9091 3 namespace: openshift-ingress-operator 4 metricName: 'kube-node-role' threshold: '1' query: 'sum(kube_node_role{role="worker",service="kube-state-metrics"})' 5 authModes: "bearer" authenticationRef: name: keda-trigger-auth-prometheus
- 1
- The custom resource that you are targeting. In this case, the Ingress Controller.
- 2
- Optional: The maximum number of replicas. If you omit this field, the default maximum is set to 100 replicas.
- 3
- The Thanos service endpoint in the
openshift-monitoringnamespace. - 4
- The Ingress Operator namespace.
- 5
- This expression evaluates to however many worker nodes are present in the deployed cluster.
ImportantIf you are using cross-namespace queries, you must target port 9091 and not port 9092 in the
serverAddressfield. You also must have elevated privileges to read metrics from this port.Apply the custom resource definition by running the following command:
$ oc apply -f ingress-autoscaler.yaml
Verification
Verify that the default Ingress Controller is scaled out to match the value returned by the
kube-state-metricsquery by running the following commands:Use the
grepcommand to search the Ingress Controller YAML file for the number of replicas:$ oc get -n openshift-ingress-operator ingresscontroller/default -o yaml | grep replicas:
Get the pods in the
openshift-ingressproject:$ oc get pods -n openshift-ingress
Example output
NAME                             READY   STATUS    RESTARTS   AGE
router-default-7b5df44ff-l9pmm   2/2     Running   0          17h
router-default-7b5df44ff-s5sl5   2/2     Running   0          3d22h
router-default-7b5df44ff-wwsth   2/2     Running   0          66s
Additional resources
8.9.4. Scaling an Ingress Controller
Manually scale an Ingress Controller to meeting routing performance or availability requirements such as the requirement to increase throughput. oc commands are used to scale the IngressController resource. The following procedure provides an example for scaling up the default IngressController.
Scaling is not an immediate action, as it takes time to create the desired number of replicas.
Prerequisites
On VMware vSphere, bare-metal, and Nutanix installer-provisioned infrastructure, scaling up Ingress Controller pods does not improve external traffic performance. To improve performance, ensure that you complete the following prerequisites:
- You manually configured a user-managed load balancer for your cluster.
- You ensured that the load balancer was configured for the cluster nodes that handle incoming traffic from the Ingress Controller.
Procedure
View the current number of available replicas for the default
IngressController:$ oc get -n openshift-ingress-operator ingresscontrollers/default -o jsonpath='{$.status.availableReplicas}'Scale the default
IngressControllerto the desired number of replicas by using theoc patchcommand. The following example scales the defaultIngressControllerto 3 replicas.$ oc patch -n openshift-ingress-operator ingresscontroller/default --patch '{"spec":{"replicas": 3}}' --type=mergeVerify that the default
IngressControllerscaled to the number of replicas that you specified:$ oc get -n openshift-ingress-operator ingresscontrollers/default -o jsonpath='{$.status.availableReplicas}'TipYou can alternatively apply the following YAML to scale an Ingress Controller to three replicas:
apiVersion: operator.openshift.io/v1 kind: IngressController metadata: name: default namespace: openshift-ingress-operator spec: replicas: 3 1- 1
- If you need a different amount of replicas, change the
replicasvalue.
8.9.5. Configuring Ingress access logging
You can configure the Ingress Controller to enable access logs. If you have clusters that do not receive much traffic, then you can log to a sidecar. If you have high traffic clusters, to avoid exceeding the capacity of the logging stack or to integrate with a logging infrastructure outside of OpenShift Container Platform, you can forward logs to a custom syslog endpoint. You can also specify the format for access logs.
Container logging is useful to enable access logs on low-traffic clusters when there is no existing Syslog logging infrastructure, or for short-term use while diagnosing problems with the Ingress Controller.
Syslog is needed for high-traffic clusters where access logs could exceed the OpenShift Logging stack’s capacity, or for environments where any logging solution needs to integrate with an existing Syslog logging infrastructure. The Syslog use-cases can overlap.
Prerequisites
-
Log in as a user with
cluster-adminprivileges.
Procedure
For Ingress access logging to a sidecar, complete the following commands:
To enable Ingress access logging to a sidecar, enter the following command:
$ oc patch ingresscontroller default -n openshift-ingress-operator --type=merge \ -p '{"spec":{"logging":{"access":{"destination":{"type":"Container"}}}}}'After you configure the Ingress Controller to log to a sidecar, the Operator creates a container named
logsinside a router pod that exists in theopenshift-ingressnamespace.If you need to disable Ingress access logging, enter the following command that does not specify any values for
spec.logging:$ oc patch ingresscontroller default -n openshift-ingress-operator --type=json \ -p='[{"op": "remove", "path": "/spec/logging"}]'To stream the access logs and system events from the OpenShift Container Platform Ingress Controller, enter the following command:
$ oc -n openshift-ingress logs deployment.apps/router-default -c logs
Example output
2020-05-11T19:11:50.135710+00:00 router-default-57dfc6cd95-bpmk6 router-default-57dfc6cd95-bpmk6 haproxy[108]: 174.19.21.82:39654 [11/May/2020:19:11:50.133] public be_http:hello-openshift:hello-openshift/pod:hello-openshift:hello-openshift:10.128.2.12:8080 0/0/1/0/1 200 142 - - --NI 1/1/0/0/0 0/0 "GET / HTTP/1.1"
To enable logging to an external Syslog server, enter the following command. Use this option if you need to forward logs to a centralized logging solution such as Splunk, Rsyslog, or Logstash.
$ oc patch ingresscontroller default -n openshift-ingress-operator --type=merge \ -p '{"spec":{"logging":{"access":{"destination":{"type":"Syslog","syslog":{"address":"1.2.3.4","port":514,"maxLenght":1024}}}}}}'-
Replace
1.2.3.4with the destination IP address of your logging server. Syslog does not support a DNS hostname value. -
Replace
514with the UDP destination port of your logging server. -
Replace
1024with the maximum length of a log message in bytes that you want to set for log messages.
-
Replace
To customize the log format, append an HAProxy-compatible log string to the following command. The string determines what information gets captured in the log format, such as a client IP address.
$ oc patch ingresscontroller default -n openshift-ingress-operator --type=merge \ -p '{"spec":{"logging":{"access":{"httpLogFormat":"%ci:%cp [%t] %ft %b/%s %B %bq %HM %HU %HV"}}}}'NoteFor a list of HAProxy log variable descriptions, see Content from docs.haproxy.org is not included.Custom log format in the upstream HAProxy documentation.
To capture custom HTTP headers or response headers in your logs, enter the following command. Consider this option if you need to track an
X-Forwarded-Forheader or custom application IDs in the Ingress and application logs.$ oc patch ingresscontroller default -n openshift-ingress-operator --type=merge -p '{"spec":{"logging":{"access":{"httpCaptureHeaders":{"request":[{"name":"User-Agent","maxLength": 1024}],"response":[{"name":"Content-Type","maxLength": 1024}]}}}}}'To configure a log empty requests policy, enter the following command and set the
logEmptyRequestsparameter toLog. By default, HAProxy might not log empty requests or health checks, so you must manually enable this feature. To disable the feature, set thelogEmptyRequestsparameter toIgnore.$ oc patch ingresscontroller default -n openshift-ingress-operator --type=merge -p '{"spec":{"logging":{"access":{"logEmptyRequests":"Ignore"}}}}'
8.9.6. Setting Ingress Controller thread count
A cluster administrator can set the thread count to increase the amount of incoming connections a cluster can handle. You can patch an existing Ingress Controller to increase the amount of threads.
Prerequisites
- The following assumes that you already created an Ingress Controller.
Procedure
Update the Ingress Controller to increase the number of threads:
$ oc -n openshift-ingress-operator patch ingresscontroller/default --type=merge -p '{"spec":{"tuningOptions": {"threadCount": 8}}}'NoteIf you have a node that is capable of running large amounts of resources, you can configure
spec.nodePlacement.nodeSelectorwith labels that match the capacity of the intended node, and configurespec.tuningOptions.threadCountto an appropriately high value.
8.9.7. Configuring an Ingress Controller to use an internal load balancer
When creating an Ingress Controller on cloud platforms, the Ingress Controller is published by a public cloud load balancer by default. As an administrator, you can create an Ingress Controller that uses an internal cloud load balancer.
If your cloud provider is Microsoft Azure, you must have at least one public load balancer that points to your nodes. If you do not, all of your nodes will lose egress connectivity to the internet.
If you want to change the scope for an IngressController, you can change the .spec.endpointPublishingStrategy.loadBalancer.scope parameter after the custom resource (CR) is created.
Figure 8.1. Diagram of LoadBalancer
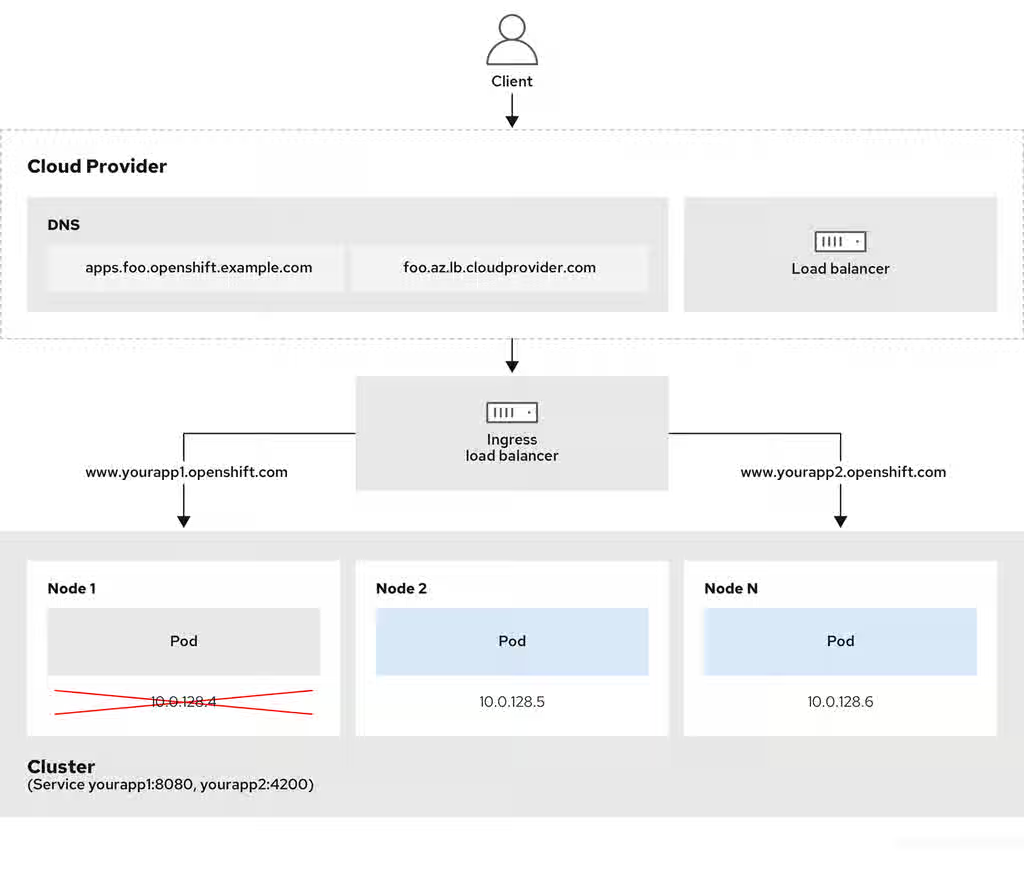
The preceding graphic shows the following concepts pertaining to OpenShift Container Platform Ingress LoadBalancerService endpoint publishing strategy:
- You can load balance externally, using the cloud provider load balancer, or internally, using the OpenShift Ingress Controller Load Balancer.
- You can use the single IP address of the load balancer and more familiar ports, such as 8080 and 4200 as shown on the cluster depicted in the graphic.
- Traffic from the external load balancer is directed at the pods, and managed by the load balancer, as depicted in the instance of a down node. See the Content from kubernetes.io is not included.Kubernetes Services documentation for implementation details.
Prerequisites
-
Install the OpenShift CLI (
oc). -
Log in as a user with
cluster-adminprivileges.
Procedure
Create an
IngressControllercustom resource (CR) in a file named<name>-ingress-controller.yaml, such as in the following example:apiVersion: operator.openshift.io/v1 kind: IngressController metadata: namespace: openshift-ingress-operator name: <name> 1 spec: domain: <domain> 2 endpointPublishingStrategy: type: LoadBalancerService loadBalancer: scope: Internal 3
Create the Ingress Controller defined in the previous step by running the following command:
$ oc create -f <name>-ingress-controller.yaml 1- 1
- Replace
<name>with the name of theIngressControllerobject.
Optional: Confirm that the Ingress Controller was created by running the following command:
$ oc --all-namespaces=true get ingresscontrollers
8.9.8. Configuring global access for an Ingress Controller on Google Cloud
An Ingress Controller created on Google Cloud with an internal load balancer generates an internal IP address for the service. A cluster administrator can specify the global access option, which enables clients in any region within the same VPC network and compute region as the load balancer, to reach the workloads running on your cluster.
For more information, see the Google Cloud documentation for Content from cloud.google.com is not included.global access.
Prerequisites
- You deployed an OpenShift Container Platform cluster on Google Cloud infrastructure.
- You configured an Ingress Controller to use an internal load balancer.
-
You installed the OpenShift CLI (
oc).
Procedure
Configure the Ingress Controller resource to allow global access.
NoteYou can also create an Ingress Controller and specify the global access option.
Configure the Ingress Controller resource:
$ oc -n openshift-ingress-operator edit ingresscontroller/default
Edit the YAML file:
Sample
clientAccessconfiguration toGlobalspec: endpointPublishingStrategy: loadBalancer: providerParameters: gcp: clientAccess: Global 1 type: GCP scope: Internal type: LoadBalancerService- 1
- Set
gcp.clientAccesstoGlobal.
- Save the file to apply the changes.
Run the following command to verify that the service allows global access:
$ oc -n openshift-ingress edit svc/router-default -o yaml
The output shows that global access is enabled for Google Cloud with the annotation,
networking.gke.io/internal-load-balancer-allow-global-access.
8.9.9. Setting the Ingress Controller health check interval
A cluster administrator can set the health check interval to define how long the router waits between two consecutive health checks. This value is applied globally as a default for all routes. The default value is 5 seconds.
Prerequisites
- The following assumes that you already created an Ingress Controller.
Procedure
Update the Ingress Controller to change the interval between back end health checks:
$ oc -n openshift-ingress-operator patch ingresscontroller/default --type=merge -p '{"spec":{"tuningOptions": {"healthCheckInterval": "8s"}}}'NoteTo override the
healthCheckIntervalfor a single route, use the route annotationrouter.openshift.io/haproxy.health.check.interval
8.9.10. Configuring the default Ingress Controller for your cluster to be internal
You can configure the default Ingress Controller for your cluster to be internal by deleting and recreating it.
If your cloud provider is Microsoft Azure, you must have at least one public load balancer that points to your nodes. If you do not, all of your nodes will lose egress connectivity to the internet.
If you want to change the scope for an IngressController, you can change the .spec.endpointPublishingStrategy.loadBalancer.scope parameter after the custom resource (CR) is created.
Prerequisites
-
Install the OpenShift CLI (
oc). -
Log in as a user with
cluster-adminprivileges.
Procedure
Configure the
defaultIngress Controller for your cluster to be internal by deleting and recreating it.$ oc replace --force --wait --filename - <<EOF apiVersion: operator.openshift.io/v1 kind: IngressController metadata: namespace: openshift-ingress-operator name: default spec: endpointPublishingStrategy: type: LoadBalancerService loadBalancer: scope: Internal EOF
8.9.11. Configuring the route admission policy
Administrators and application developers can run applications in multiple namespaces with the same domain name. This is for organizations where multiple teams develop microservices that are exposed on the same hostname.
Allowing claims across namespaces should only be enabled for clusters with trust between namespaces, otherwise a malicious user could take over a hostname. For this reason, the default admission policy disallows hostname claims across namespaces.
Prerequisites
- Cluster administrator privileges.
Procedure
Edit the
.spec.routeAdmissionfield of theingresscontrollerresource variable using the following command:$ oc -n openshift-ingress-operator patch ingresscontroller/default --patch '{"spec":{"routeAdmission":{"namespaceOwnership":"InterNamespaceAllowed"}}}' --type=mergeSample Ingress Controller configuration
spec: routeAdmission: namespaceOwnership: InterNamespaceAllowed ...TipYou can alternatively apply the following YAML to configure the route admission policy:
apiVersion: operator.openshift.io/v1
kind: IngressController
metadata:
  name: default
  namespace: openshift-ingress-operator
spec:
  routeAdmission:
    namespaceOwnership: InterNamespaceAllowed
8.9.12. Using wildcard routes
The HAProxy Ingress Controller has support for wildcard routes. The Ingress Operator uses wildcardPolicy to configure the ROUTER_ALLOW_WILDCARD_ROUTES environment variable of the Ingress Controller.
The default behavior of the Ingress Controller is to admit routes with a wildcard policy of None, which is backwards compatible with existing IngressController resources.
Procedure
Configure the wildcard policy.
Use the following command to edit the
IngressControllerresource:$ oc edit IngressController
Under
spec, set thewildcardPolicyfield toWildcardsDisallowedorWildcardsAllowed:spec: routeAdmission: wildcardPolicy: WildcardsDisallowed # or WildcardsAllowed
8.9.13. HTTP header configuration
To customize request and response headers for your applications, configure the Ingress Controller or apply specific route annotations. Understanding the interaction between these configuration methods ensures you effectively manage global and route-specific header policies.
You can also set certain headers by using route annotations. The various ways of configuring headers can present challenges when working together.
You can only set or delete headers within an IngressController or Route CR, you cannot append them. If an HTTP header is set with a value, that value must be complete and not require appending in the future. In situations where it makes sense to append a header, such as the X-Forwarded-For header, use the spec.httpHeaders.forwardedHeaderPolicy field, instead of spec.httpHeaders.actions.
- Order of precedence
When the same HTTP header is modified both in the Ingress Controller and in a route, HAProxy prioritizes the actions in certain ways depending on whether it is a request or response header.
- For HTTP response headers, actions specified in the Ingress Controller are executed after the actions specified in a route. This means that the actions specified in the Ingress Controller take precedence.
- For HTTP request headers, actions specified in a route are executed after the actions specified in the Ingress Controller. This means that the actions specified in the route take precedence.
For example, a cluster administrator sets the X-Frame-Options response header with the value DENY in the Ingress Controller using the following configuration:
Example IngressController spec
apiVersion: operator.openshift.io/v1
kind: IngressController
# ...
spec:
  httpHeaders:
    actions:
      response:
      - name: X-Frame-Options
        action:
          type: Set
          set:
            value: DENY
A route owner sets the same response header that the cluster administrator set in the Ingress Controller, but with the value SAMEORIGIN using the following configuration:
Example Route spec
apiVersion: route.openshift.io/v1
kind: Route
# ...
spec:
  httpHeaders:
    actions:
      response:
      - name: X-Frame-Options
        action:
          type: Set
          set:
            value: SAMEORIGIN
When both the IngressController spec and Route spec are configuring the X-Frame-Options response header, then the value set for this header at the global level in the Ingress Controller takes precedence, even if a specific route allows frames. For a request header, the Route spec value overrides the IngressController spec value.
This prioritization occurs because the haproxy.config file uses the following logic, where the Ingress Controller is considered the front end and individual routes are considered the back end. The header value DENY applied to the front end configurations overrides the same header with the value SAMEORIGIN that is set in the back end:
frontend public
  http-response set-header X-Frame-Options 'DENY'

frontend fe_sni
  http-response set-header X-Frame-Options 'DENY'

frontend fe_no_sni
  http-response set-header X-Frame-Options 'DENY'

backend be_secure:openshift-monitoring:alertmanager-main
  http-response set-header X-Frame-Options 'SAMEORIGIN'
Additionally, any actions defined in either the Ingress Controller or a route override values set using route annotations.
- Special case headers
- The following headers are either prevented entirely from being set or deleted, or allowed under specific circumstances:
Table 8.2. Special case header configuration options
| Header name | Configurable using IngressController spec | Configurable using Route spec | Reason for disallowment | Configurable using another method |
|---|---|---|---|---|
|
| No | No |
The | No |
|
| No | Yes |
When the | No |
|
| No | No |
The |
Yes: the |
|
| No | No | The cookies that HAProxy sets are used for session tracking to map client connections to particular back-end servers. Allowing these headers to be set could interfere with HAProxy’s session affinity and restrict HAProxy’s ownership of a cookie. | Yes:
|
8.9.14. Setting or deleting HTTP request and response headers in an Ingress Controller
You can set or delete certain HTTP request and response headers for compliance purposes or other reasons. You can set or delete these headers either for all routes served by an Ingress Controller or for specific routes.
For example, you might want to migrate an application running on your cluster to use mutual TLS, which requires that your application checks for an X-Forwarded-Client-Cert request header, but the OpenShift Container Platform default Ingress Controller provides an X-SSL-Client-Der request header.
The following procedure modifies the Ingress Controller to set the X-Forwarded-Client-Cert request header, and delete the X-SSL-Client-Der request header.
Prerequisites
-
You have installed the OpenShift CLI (
oc). -
You have access to an OpenShift Container Platform cluster as a user with the
cluster-adminrole.
Procedure
Edit the Ingress Controller resource:
$ oc -n openshift-ingress-operator edit ingresscontroller/default
Replace the X-SSL-Client-Der HTTP request header with the X-Forwarded-Client-Cert HTTP request header:
apiVersion: operator.openshift.io/v1 kind: IngressController metadata: name: default namespace: openshift-ingress-operator spec: httpHeaders: actions: 1 request: 2 - name: X-Forwarded-Client-Cert 3 action: type: Set 4 set: value: "%{+Q}[ssl_c_der,base64]" 5 - name: X-SSL-Client-Der action: type: Delete- 1
- The list of actions you want to perform on the HTTP headers.
- 2
- The type of header you want to change. In this case, a request header.
- 3
- The name of the header you want to change. For a list of available headers you can set or delete, see HTTP header configuration.
- 4
- The type of action being taken on the header. This field can have the value
SetorDelete. - 5
- When setting HTTP headers, you must provide a
value. The value can be a string from a list of available directives for that header, for exampleDENY, or it can be a dynamic value that will be interpreted using HAProxy’s dynamic value syntax. In this case, a dynamic value is added.
NoteFor setting dynamic header values for HTTP responses, allowed sample fetchers are
res.hdrandssl_c_der. For setting dynamic header values for HTTP requests, allowed sample fetchers arereq.hdrandssl_c_der. Both request and response dynamic values can use thelowerandbase64converters.- Save the file to apply the changes.
8.9.15. Using X-Forwarded headers
You configure the HAProxy Ingress Controller to specify a policy for how to handle HTTP headers including Forwarded and X-Forwarded-For. The Ingress Operator uses the HTTPHeaders field to configure the ROUTER_SET_FORWARDED_HEADERS environment variable of the Ingress Controller.
Procedure
Configure the
HTTPHeadersfield for the Ingress Controller.Use the following command to edit the
IngressControllerresource:$ oc edit IngressController
Under
spec, set theHTTPHeaderspolicy field toAppend,Replace,IfNone, orNever:apiVersion: operator.openshift.io/v1 kind: IngressController metadata: name: default namespace: openshift-ingress-operator spec: httpHeaders: forwardedHeaderPolicy: Append
8.9.15.1. Example use cases
As a cluster administrator, you can:
Configure an external proxy that injects the
X-Forwarded-Forheader into each request before forwarding it to an Ingress Controller.To configure the Ingress Controller to pass the header through unmodified, you specify the
neverpolicy. The Ingress Controller then never sets the headers, and applications receive only the headers that the external proxy provides.Configure the Ingress Controller to pass the
X-Forwarded-Forheader that your external proxy sets on external cluster requests through unmodified.To configure the Ingress Controller to set the
X-Forwarded-Forheader on internal cluster requests, which do not go through the external proxy, specify theif-nonepolicy. If an HTTP request already has the header set through the external proxy, then the Ingress Controller preserves it. If the header is absent because the request did not come through the proxy, then the Ingress Controller adds the header.
As an application developer, you can:
Configure an application-specific external proxy that injects the
X-Forwarded-Forheader.To configure an Ingress Controller to pass the header through unmodified for an application’s Route, without affecting the policy for other Routes, add an annotation
haproxy.router.openshift.io/set-forwarded-headers: if-noneorhaproxy.router.openshift.io/set-forwarded-headers: neveron the Route for the application.NoteYou can set the
haproxy.router.openshift.io/set-forwarded-headersannotation on a per route basis, independent from the globally set value for the Ingress Controller.
8.9.16. Enable or disable HTTP/2 on Ingress Controllers
You can enable or disable transparent end-to-end HTTP/2 connectivity in HAProxy. Application owners can use HTTP/2 protocol capabilities, including single connection, header compression, binary streams, and more.
You can enable or disable HTTP/2 connectivity for an individual Ingress Controller or for the entire cluster.
If you enable or disable HTTP/2 connectivity for an individual Ingress Controller and for the entire cluster, the HTTP/2 configuration for the Ingress Controller takes precedence over the HTTP/2 configuration for the cluster.
To enable the use of HTTP/2 for a connection from the client to an HAProxy instance, a route must specify a custom certificate. A route that uses the default certificate cannot use HTTP/2. This restriction is necessary to avoid problems from connection coalescing, where the client re-uses a connection for different routes that use the same certificate.
Consider the following use cases for an HTTP/2 connection for each route type:
- For a re-encrypt route, the connection from HAProxy to the application pod can use HTTP/2 if the application supports using Application-Level Protocol Negotiation (ALPN) to negotiate HTTP/2 with HAProxy. You cannot use HTTP/2 with a re-encrypt route unless the Ingress Controller has HTTP/2 enabled.
- For a passthrough route, the connection can use HTTP/2 if the application supports using ALPN to negotiate HTTP/2 with the client. You can use HTTP/2 with a passthrough route if the Ingress Controller has HTTP/2 enabled or disabled.
-
For an edge-terminated secure route, the connection uses HTTP/2 if the service specifies only
appProtocol: kubernetes.io/h2c. You can use HTTP/2 with an edge-terminated secure route if the Ingress Controller has HTTP/2 enabled or disabled. -
For an insecure route, the connection uses HTTP/2 if the service specifies only
appProtocol: kubernetes.io/h2c. You can use HTTP/2 with an insecure route if the Ingress Controller has HTTP/2 enabled or disabled.
For non-passthrough routes, the Ingress Controller negotiates its connection to the application independently of the connection from the client. This means a client might connect to the Ingress Controller and negotiate HTTP/1.1. The Ingress Controller might then connect to the application, negotiate HTTP/2, and forward the request from the client HTTP/1.1 connection by using the HTTP/2 connection to the application.
This sequence of events causes an issue if the client subsequently tries to upgrade its connection from HTTP/1.1 to the WebSocket protocol. Consider that if you have an application that is intending to accept WebSocket connections, and the application attempts to allow for HTTP/2 protocol negotiation, the client fails any attempt to upgrade to the WebSocket protocol.
8.9.16.1. Enabling HTTP/2
You can enable HTTP/2 on a specific Ingress Controller, or you can enable HTTP/2 for the entire cluster.
Procedure
To enable HTTP/2 on a specific Ingress Controller, enter the
oc annotatecommand:$ oc -n openshift-ingress-operator annotate ingresscontrollers/<ingresscontroller_name> ingress.operator.openshift.io/default-enable-http2=true 1- 1
- Replace
<ingresscontroller_name>with the name of an Ingress Controller to enable HTTP/2.
To enable HTTP/2 for the entire cluster, enter the
oc annotatecommand:$ oc annotate ingresses.config/cluster ingress.operator.openshift.io/default-enable-http2=true
Alternatively, you can apply the following YAML code to enable HTTP/2:
apiVersion: config.openshift.io/v1
kind: Ingress
metadata:
  name: cluster
  annotations:
ingress.operator.openshift.io/default-enable-http2: "true"8.9.16.2. Disabling HTTP/2
You can disable HTTP/2 on a specific Ingress Controller, or you can disable HTTP/2 for the entire cluster.
Procedure
To disable HTTP/2 on a specific Ingress Controller, enter the
oc annotatecommand:$ oc -n openshift-ingress-operator annotate ingresscontrollers/<ingresscontroller_name> ingress.operator.openshift.io/default-enable-http2=false 1- 1
- Replace
<ingresscontroller_name>with the name of an Ingress Controller to disable HTTP/2.
To disable HTTP/2 for the entire cluster, enter the
oc annotatecommand:$ oc annotate ingresses.config/cluster ingress.operator.openshift.io/default-enable-http2=false
Alternatively, you can apply the following YAML code to disable HTTP/2:
apiVersion: config.openshift.io/v1
kind: Ingress
metadata:
  name: cluster
  annotations:
ingress.operator.openshift.io/default-enable-http2: "false"8.9.17. Configuring the PROXY protocol for an Ingress Controller
A cluster administrator can configure Content from www.haproxy.org is not included.the PROXY protocol when an Ingress Controller uses either the HostNetwork, NodePortService, or Private endpoint publishing strategy types. The PROXY protocol enables the load balancer to preserve the original client addresses for connections that the Ingress Controller receives. The original client addresses are useful for logging, filtering, and injecting HTTP headers. In the default configuration, the connections that the Ingress Controller receives only contain the source address that is associated with the load balancer.
The default Ingress Controller with installer-provisioned clusters on non-cloud platforms that use a Keepalived Ingress Virtual IP (VIP) do not support the PROXY protocol.
The PROXY protocol enables the load balancer to preserve the original client addresses for connections that the Ingress Controller receives. The original client addresses are useful for logging, filtering, and injecting HTTP headers. In the default configuration, the connections that the Ingress Controller receives contain only the source IP address that is associated with the load balancer.
For a passthrough route configuration, servers in OpenShift Container Platform clusters cannot observe the original client source IP address. If you need to know the original client source IP address, configure Ingress access logging for your Ingress Controller so that you can view the client source IP addresses.
For re-encrypt and edge routes, the OpenShift Container Platform router sets the Forwarded and X-Forwarded-For headers so that application workloads check the client source IP address.
For more information about Ingress access logging, see "Configuring Ingress access logging".
Configuring the PROXY protocol for an Ingress Controller is not supported when using the LoadBalancerService endpoint publishing strategy type. This restriction is because when OpenShift Container Platform runs in a cloud platform, and an Ingress Controller specifies that a service load balancer should be used, the Ingress Operator configures the load balancer service and enables the PROXY protocol based on the platform requirement for preserving source addresses.
You must configure both OpenShift Container Platform and the external load balancer to use either the PROXY protocol or TCP.
This feature is not supported in cloud deployments. This restriction is because when OpenShift Container Platform runs in a cloud platform, and an Ingress Controller specifies that a service load balancer should be used, the Ingress Operator configures the load balancer service and enables the PROXY protocol based on the platform requirement for preserving source addresses.
You must configure both OpenShift Container Platform and the external load balancer to either use the PROXY protocol or to use Transmission Control Protocol (TCP).
Prerequisites
- You created an Ingress Controller.
Procedure
Edit the Ingress Controller resource by entering the following command in your CLI:
$ oc -n openshift-ingress-operator edit ingresscontroller/default
Set the PROXY configuration:
If your Ingress Controller uses the
HostNetworkendpoint publishing strategy type, set thespec.endpointPublishingStrategy.hostNetwork.protocolsubfield toPROXY:Sample
hostNetworkconfiguration toPROXY# ... spec: endpointPublishingStrategy: hostNetwork: protocol: PROXY type: HostNetwork # ...If your Ingress Controller uses the
NodePortServiceendpoint publishing strategy type, set thespec.endpointPublishingStrategy.nodePort.protocolsubfield toPROXY:Sample
nodePortconfiguration toPROXY# ... spec: endpointPublishingStrategy: nodePort: protocol: PROXY type: NodePortService # ...If your Ingress Controller uses the
Privateendpoint publishing strategy type, set thespec.endpointPublishingStrategy.private.protocolsubfield toPROXY:Sample
privateconfiguration toPROXY# ... spec: endpointPublishingStrategy: private: protocol: PROXY type: Private # ...
Additional resources
8.9.18. Specifying an alternative cluster domain using the appsDomain option
As a cluster administrator, you can specify an alternative to the default cluster domain for user-created routes by configuring the appsDomain field. The appsDomain field is an optional domain for OpenShift Container Platform to use instead of the default, which is specified in the domain field. If you specify an alternative domain, it overrides the default cluster domain for the purpose of determining the default host for a new route.
For example, you can use the DNS domain for your company as the default domain for routes and ingresses for applications running on your cluster.
Prerequisites
- You deployed an OpenShift Container Platform cluster.
-
You installed the
occommand-line interface.
Procedure
Configure the
appsDomainfield by specifying an alternative default domain for user-created routes.Edit the ingress
clusterresource:$ oc edit ingresses.config/cluster -o yaml
Edit the YAML file:
Sample
appsDomainconfiguration totest.example.comapiVersion: config.openshift.io/v1 kind: Ingress metadata: name: cluster spec: domain: apps.example.com 1 appsDomain: <test.example.com> 2
Verify that an existing route contains the domain name specified in the
appsDomainfield by exposing the route and verifying the route domain change:NoteWait for the
openshift-apiserverfinish rolling updates before exposing the route.Expose the route by entering the following command. The command outputs
route.route.openshift.io/hello-openshift exposedto designate exposure of the route.$ oc expose service hello-openshift
Get a list of routes by running the following command:
$ oc get routes
Example output
NAME              HOST/PORT                                   PATH   SERVICES          PORT       TERMINATION   WILDCARD
hello-openshift   hello_openshift-<my_project>.test.example.com
hello-openshift   8080-tcp                 None
8.9.19. Converting HTTP header case
HAProxy lowercases HTTP header names by default; for example, changing Host: xyz.com to host: xyz.com. If legacy applications are sensitive to the capitalization of HTTP header names, use the Ingress Controller spec.httpHeaders.headerNameCaseAdjustments API field for a solution to accommodate legacy applications until they can be fixed.
OpenShift Container Platform includes HAProxy 2.8. If you want to update to this version of the web-based load balancer, ensure that you add the spec.httpHeaders.headerNameCaseAdjustments section to your cluster’s configuration file.
As a cluster administrator, you can convert the HTTP header case by entering the oc patch command or by setting the HeaderNameCaseAdjustments field in the Ingress Controller YAML file.
Prerequisites
-
You have installed the OpenShift CLI (
oc). -
You have access to the cluster as a user with the
cluster-adminrole.
Procedure
Capitalize an HTTP header by using the
oc patchcommand.Change the HTTP header from
hosttoHostby running the following command:$ oc -n openshift-ingress-operator patch ingresscontrollers/default --type=merge --patch='{"spec":{"httpHeaders":{"headerNameCaseAdjustments":["Host"]}}}'Create a
Routeresource YAML file so that the annotation can be applied to the application.Example of a route named
my-applicationapiVersion: route.openshift.io/v1 kind: Route metadata: annotations: haproxy.router.openshift.io/h1-adjust-case: true 1 name: <application_name> namespace: <application_name> # ...- 1
- Set
haproxy.router.openshift.io/h1-adjust-caseso that the Ingress Controller can adjust thehostrequest header as specified.
Specify adjustments by configuring the
HeaderNameCaseAdjustmentsfield in the Ingress Controller YAML configuration file.The following example Ingress Controller YAML file adjusts the
hostheader toHostfor HTTP/1 requests to appropriately annotated routes:Example Ingress Controller YAML
apiVersion: operator.openshift.io/v1 kind: IngressController metadata: name: default namespace: openshift-ingress-operator spec: httpHeaders: headerNameCaseAdjustments: - HostThe following example route enables HTTP response header name case adjustments by using the
haproxy.router.openshift.io/h1-adjust-caseannotation:Example route YAML
apiVersion: route.openshift.io/v1 kind: Route metadata: annotations: haproxy.router.openshift.io/h1-adjust-case: true 1 name: my-application namespace: my-application spec: to: kind: Service name: my-application- 1
- Set
haproxy.router.openshift.io/h1-adjust-caseto true.
8.9.20. Using router compression
You configure the HAProxy Ingress Controller to specify router compression globally for specific MIME types. You can use the mimeTypes variable to define the formats of MIME types to which compression is applied. The types are: application, image, message, multipart, text, video, or a custom type prefaced by "X-". To see the full notation for MIME types and subtypes, see Content from datatracker.ietf.org is not included.RFC1341.
Memory allocated for compression can affect the max connections. Additionally, compression of large buffers can cause latency, like heavy regex or long lists of regex.
Not all MIME types benefit from compression, but HAProxy still uses resources to try to compress if instructed to. Generally, text formats, such as html, css, and js, formats benefit from compression, but formats that are already compressed, such as image, audio, and video, benefit little in exchange for the time and resources spent on compression.
Procedure
Configure the
httpCompressionfield for the Ingress Controller.Use the following command to edit the
IngressControllerresource:$ oc edit -n openshift-ingress-operator ingresscontrollers/default
Under
spec, set thehttpCompressionpolicy field tomimeTypesand specify a list of MIME types that should have compression applied:apiVersion: operator.openshift.io/v1 kind: IngressController metadata: name: default namespace: openshift-ingress-operator spec: httpCompression: mimeTypes: - "text/html" - "text/css; charset=utf-8" - "application/json" ...
8.9.21. Exposing router metrics
You can retrieve Prometheus-format HAProxy ingress router metrics from port 1936 to monitor ingress load and troubleshoot routing behavior. By analyzing these metrics, you can identify capacity bottlenecks and determine when to scale your router deployment.
Prerequisites
- You have cluster administrator access to the cluster.
-
You configured your firewall to allow port
1936.
The Prometheus /metrics endpoint and the HAProxy HTML statistics dashboard are mutually exclusive exposition modes because the HAProxy router process serves one mode at a time. The Ingress Operator configures default Ingress Controller pods for Prometheus scraping (/metrics on port 1936). Browsing http://<user>:<password>@<pod_IP>:1936/ for interactive HTML statistics is not supported concurrently with Prometheus metrics on deployments that the Ingress Operator configures in this manner.
Procedure
List the router pods in the ingress namespace by entering the following command:
$ oc get pods -n openshift-ingress
Example output
NAME                               READY   STATUS    RESTARTS   AGE
router-default-76bfffb66c-46qwp   1/1     Running   0          11h
Read the stats user from the router pod under
/var/lib/haproxy/conf/metrics-auth/by entering the following command:$ oc rsh <router_pod_name> cat /var/lib/haproxy/conf/metrics-auth/statsUsername
Read the stats password from the router pod under
/var/lib/haproxy/conf/metrics-auth/by entering the following command:$ oc rsh <router_pod_name> cat /var/lib/haproxy/conf/metrics-auth/statsPassword
Get pod details, including the IP address for the pod, by entering the following command:
$ oc describe pod <router_pod>
Fetch Prometheus text metrics from the default port
1936by entering the following command:$ curl -u <user>:<password> http://<router_IP>:1936/metrics
If the stats endpoint serves TLS-protected Prometheus text, retrieve metrics over HTTPS instead by entering the following command:
$ curl -u <user>:<password> https://<router_IP>:1936/metrics -k
Example output
...
# HELP haproxy_max_connections Hard limit on the number of connections (configured or imposed by ulimit -n).
# TYPE haproxy_max_connections gauge
haproxy_max_connections 50000
...
Optional: In the OpenShift Container Platform web console, navigate to Observe → Metrics, or query Prometheus directly, to compare ingress load against the HAProxy allowance.
The
haproxy_max_connectionsgauge reflects each scraped router endpoint’s HAProxy allowance fromspec.tuningOptions.maxConnectionson theIngressController, bound by operating system limits such asulimit -n. Before relying on ratios, confirm the labeled metric for front-end sessions that your HAProxy Prometheus exporter emits. For example, usehaproxy_frontend_current_sessionswhen that series is available for your deployment.Expressions similar to
sum(haproxy_frontend_current_sessions) / sum(haproxy_max_connections)can estimate connection load across scrape targets after you verify those series for your deployment.If the ratio approaches
1, adjustspec.tuningOptions.maxConnectionson theIngressControlleror scale the router deployment.
8.9.22. Customizing HAProxy error code response pages
As a cluster administrator, you can specify a custom error code response page for either 503, 404, or both error pages. The HAProxy router serves a 503 error page when the application pod is not running or a 404 error page when the requested URL does not exist. For example, if you customize the 503 error code response page, then the page is served when the application pod is not running, and the default 404 error code HTTP response page is served by the HAProxy router for an incorrect route or a non-existing route.
Custom error code response pages are specified in a config map then patched to the Ingress Controller. The config map keys have two available file names as follows: error-page-503.http and error-page-404.http.
Custom HTTP error code response pages must follow the Content from www.haproxy.com is not included.HAProxy HTTP error page configuration guidelines. Here is an example of the default OpenShift Container Platform HAProxy router Content from raw.githubusercontent.com is not included.http 503 error code response page. You can use the default content as a template for creating your own custom page.
By default, the HAProxy router serves only a 503 error page when the application is not running or when the route is incorrect or non-existent. This default behavior is the same as the behavior on OpenShift Container Platform 4.8 and earlier. If a config map for the customization of an HTTP error code response is not provided, and you are using a custom HTTP error code response page, the router serves a default 404 or 503 error code response page.
If you use the OpenShift Container Platform default 503 error code page as a template for your customizations, the headers in the file require an editor that can use CRLF line endings.
Procedure
Create a config map named
my-custom-error-code-pagesin theopenshift-confignamespace:$ oc -n openshift-config create configmap my-custom-error-code-pages \ --from-file=error-page-503.http \ --from-file=error-page-404.http
ImportantIf you do not specify the correct format for the custom error code response page, a router pod outage occurs. To resolve this outage, you must delete or correct the config map and delete the affected router pods so they can be recreated with the correct information.
Patch the Ingress Controller to reference the
my-custom-error-code-pagesconfig map by name:$ oc patch -n openshift-ingress-operator ingresscontroller/default --patch '{"spec":{"httpErrorCodePages":{"name":"my-custom-error-code-pages"}}}' --type=mergeThe Ingress Operator copies the
my-custom-error-code-pagesconfig map from theopenshift-confignamespace to theopenshift-ingressnamespace. The Operator names the config map according to the pattern,<your_ingresscontroller_name>-errorpages, in theopenshift-ingressnamespace.Display the copy:
$ oc get cm default-errorpages -n openshift-ingress
Example output
NAME DATA AGE default-errorpages 2 25s 1- 1
- The example config map name is
default-errorpagesbecause thedefaultIngress Controller custom resource (CR) was patched.
Confirm that the config map containing the custom error response page mounts on the router volume where the config map key is the filename that has the custom HTTP error code response:
For 503 custom HTTP custom error code response:
$ oc -n openshift-ingress rsh <router_pod> cat /var/lib/haproxy/conf/error_code_pages/error-page-503.http
For 404 custom HTTP custom error code response:
$ oc -n openshift-ingress rsh <router_pod> cat /var/lib/haproxy/conf/error_code_pages/error-page-404.http
Verification
Verify your custom error code HTTP response:
Create a test project and application:
$ oc new-project test-ingress
$ oc new-app django-psql-example
For 503 custom http error code response:
- Stop all the pods for the application.
Run the following curl command or visit the route hostname in the browser:
$ curl -vk <route_hostname>
For 404 custom http error code response:
- Visit a non-existent route or an incorrect route.
Run the following curl command or visit the route hostname in the browser:
$ curl -vk <route_hostname>
Check if the
errorfileattribute is properly in thehaproxy.configfile:$ oc -n openshift-ingress rsh <router> cat /var/lib/haproxy/conf/haproxy.config | grep errorfile
8.9.23. Setting the Ingress Controller maximum connections
A cluster administrator can set the maximum number of simultaneous connections for OpenShift router deployments. You can patch an existing Ingress Controller to increase the maximum number of connections.
Prerequisites
- The following assumes that you already created an Ingress Controller
Procedure
Update the Ingress Controller to change the maximum number of connections for HAProxy:
$ oc -n openshift-ingress-operator patch ingresscontroller/default --type=merge -p '{"spec":{"tuningOptions": {"maxConnections": 7500}}}'WarningIf you set the
spec.tuningOptions.maxConnectionsvalue greater than the current operating system limit, the HAProxy process will not start. See the table in the "Ingress Controller configuration parameters" section for more information about this parameter.
8.10. Additional resources
Chapter 9. Ingress Node Firewall Operator in OpenShift Container Platform
The Ingress Node Firewall Operator provides a stateless, eBPF-based firewall for managing node-level ingress traffic in OpenShift Container Platform.
9.1. Ingress Node Firewall Operator
The Ingress Node Firewall Operator provides ingress firewall rules at a node level that you can specify and manage in the firewall configurations.
To deploy the daemon set created by the Operator, you create an IngressNodeFirewallConfig custom resource (CR). The Operator applies the IngressNodeFirewallConfig CR to create ingress node firewall daemon set daemon, which run on all nodes that match the nodeSelector.
You configure rules of the IngressNodeFirewall CR and apply them to clusters using the nodeSelector and setting values to "true".
The Ingress Node Firewall Operator supports only stateless firewall rules.
Network interface controllers (NICs) that do not support native XDP drivers will run at a lower performance.
For OpenShift Container Platform 4.14 or later, you must run Ingress Node Firewall Operator on RHEL 9.0 or later.
9.2. Installing the Ingress Node Firewall Operator
As a cluster administrator, you can install the Ingress Node Firewall Operator to enable node-level ingress firewalling by using the OpenShift Container Platform CLI.
Prerequisites
-
You have installed the OpenShift CLI (
oc). - You have an account with administrator privileges.
Procedure
To create the
openshift-ingress-node-firewallnamespace, enter the following command:$ cat << EOF| oc create -f - apiVersion: v1 kind: Namespace metadata: labels: pod-security.kubernetes.io/enforce: privileged pod-security.kubernetes.io/enforce-version: v1.24 name: openshift-ingress-node-firewall EOFTo create an
OperatorGroupCR, enter the following command:$ cat << EOF| oc create -f - apiVersion: operators.coreos.com/v1 kind: OperatorGroup metadata: name: ingress-node-firewall-operators namespace: openshift-ingress-node-firewall EOF
Subscribe to the Ingress Node Firewall Operator.
To create a
SubscriptionCR for the Ingress Node Firewall Operator, enter the following command:$ cat << EOF| oc create -f - apiVersion: operators.coreos.com/v1alpha1 kind: Subscription metadata: name: ingress-node-firewall-sub namespace: openshift-ingress-node-firewall spec: name: ingress-node-firewall channel: stable source: redhat-operators sourceNamespace: openshift-marketplace EOF
To verify that the Operator is installed, enter the following command:
$ oc get ip -n openshift-ingress-node-firewall
Example output
NAME            CSV                                         APPROVAL    APPROVED
install-5cvnz   ingress-node-firewall.4.22.0-202211122336   Automatic   true
To verify the version of the Operator, enter the following command:
$ oc get csv -n openshift-ingress-node-firewall
Example output
NAME                                        DISPLAY                          VERSION               REPLACES                                    PHASE
ingress-node-firewall.4.22.0-202211122336   Ingress Node Firewall Operator   4.22.0-202211122336   ingress-node-firewall.4.22.0-202211102047   Succeeded
9.3. Installing the Ingress Node Firewall Operator using the web console
As a cluster administrator, you can install the Ingress Node Firewall Operator to enable node-level ingress firewalling by using the web console.
Prerequisites
-
You have installed the OpenShift CLI (
oc). - You have an account with administrator privileges.
Procedure
Install the Ingress Node Firewall Operator:
- In the OpenShift Container Platform web console, click Ecosystem → Software Catalog.
- Select Ingress Node Firewall Operator from the list of available Operators, and then click Install.
- On the Install Operator page, under Installed Namespace, select Operator recommended Namespace.
- Click Install.
Verify that the Ingress Node Firewall Operator is installed successfully:
- Navigate to the Ecosystem → Installed Operators page.
Ensure that Ingress Node Firewall Operator is listed in the openshift-ingress-node-firewall project with a Status of InstallSucceeded.
NoteDuring installation an Operator might display a Failed status. If the installation later succeeds with an InstallSucceeded message, you can ignore the Failed message.
If the Operator does not have a Status of InstallSucceeded, troubleshoot using the following steps:
- Inspect the Operator Subscriptions and Install Plans tabs for any failures or errors under Status.
-
Navigate to the Workloads → Pods page and check the logs for pods in the
openshift-ingress-node-firewallproject. Check the namespace of the YAML file. If the annotation is missing, you can add the annotation
workload.openshift.io/allowed=managementto the Operator namespace with the following command:$ oc annotate ns/openshift-ingress-node-firewall workload.openshift.io/allowed=management
NoteFor single-node OpenShift clusters, the
openshift-ingress-node-firewallnamespace requires theworkload.openshift.io/allowed=managementannotation.
9.4. Deploying Ingress Node Firewall Operator
To deploy the Ingress Node Firewall Operator, create a IngressNodeFirewallConfig custom resource that will deploy the Operator’s daemon set. You can deploy one or multiple IngressNodeFirewall CRDs to nodes by applying firewall rules.
Prerequisite
- The Ingress Node Firewall Operator is installed.
Procedure
-
Create the
IngressNodeFirewallConfiginside theopenshift-ingress-node-firewallnamespace namedingressnodefirewallconfig. Run the following command to deploy Ingress Node Firewall Operator rules:
$ oc apply -f rule.yaml
9.5. Ingress Node Firewall configuration object
Review configuration fields so you can define how the Operator deploys the firewall.
The fields for the Ingress Node Firewall configuration object are described in the following table:
Table 9.1. Ingress Node Firewall Configuration object
| Field | Type | Description |
|---|---|---|
|
|
|
The name of the CR object. The name of the firewall rules object must be |
|
|
|
Namespace for the Ingress Firewall Operator CR object. The |
|
|
| A node selection constraint used to target nodes through specified node labels. For example: apiVersion: ingressnodefirewall.openshift.io/v1alpha1
kind: IngressNodeFirewallConfig
metadata:
name: ingressnodefirewallconfig
namespace: openshift-ingress-node-firewall
spec:
nodeSelector:
node-role.kubernetes.io/worker: ""Note
One label used in |
|
|
| Specifies if the Node Ingress Firewall Operator uses the eBPF Manager Operator or not to manage eBPF programs. This capability is a Technology Preview feature. For more information about the support scope of Red Hat Technology Preview features, see Technology Preview Features Support Scope. |
The Operator consumes the CR and creates an ingress node firewall daemon set on all the nodes that match the nodeSelector.
9.5.1. Ingress Node Firewall Operator example configuration
A complete Ingress Node Firewall Configuration is specified in the following example:
Example of how to create an Ingress Node Firewall Configuration object
$ cat << EOF | oc create -f -
apiVersion: ingressnodefirewall.openshift.io/v1alpha1
kind: IngressNodeFirewallConfig
metadata:
  name: ingressnodefirewallconfig
  namespace: openshift-ingress-node-firewall
spec:
  nodeSelector:
    node-role.kubernetes.io/worker: ""
EOF
The Operator consumes the CR object and creates an ingress node firewall daemon set on all the nodes that match the nodeSelector.
9.5.2. Ingress Node Firewall rules object
You can review rule fields and examples to define which ingress traffic is allowed or denied by using the Ingress Node Firewall rules object.
The fields for the Ingress Node Firewall rules object are described in the following table:
Table 9.2. Ingress Node Firewall rules object
| Field | Type | Description |
|---|---|---|
|
|
| The name of the CR object. |
|
|
|
The fields for this object specify the interfaces to apply the firewall rules to. For example, |
|
|
|
You can use |
|
|
|
|
9.5.2.1. Ingress object configuration
The values for the ingress object are defined in the following table:
Table 9.3. ingress object
| Field | Type | Description |
|---|---|---|
|
|
| Allows you to set the CIDR block. You can configure multiple CIDRs from different address families. Note
Different CIDRs allow you to use the same order rule. In the case that there are multiple |
|
|
|
Ingress firewall
Set Note Ingress firewall rules are verified using a verification webhook that blocks any invalid configuration. The verification webhook prevents you from blocking any critical cluster services such as the API server. |
9.5.2.2. Ingress Node Firewall rules object example
A complete Ingress Node Firewall configuration is specified in the following example:
Example Ingress Node Firewall configuration
apiVersion: ingressnodefirewall.openshift.io/v1alpha1
kind: IngressNodeFirewall
metadata:
  name: ingressnodefirewall
spec:
  interfaces:
  - eth0
  nodeSelector:
    matchLabels:
      <label_name>: <label_value>
  ingress:
  - sourceCIDRs:
       - 172.16.0.0/12
    rules:
    - order: 10
      protocolConfig:
        protocol: ICMP
        icmp:
          icmpType: 8 #ICMP Echo request
      action: Deny
    - order: 20
      protocolConfig:
        protocol: TCP
        tcp:
          ports: "8000-9000"
      action: Deny
  - sourceCIDRs:
       - fc00:f853:ccd:e793::0/64
    rules:
    - order: 10
      protocolConfig:
        protocol: ICMPv6
        icmpv6:
          icmpType: 128 #ICMPV6 Echo request
      action: Deny
+ A <label_name> and a <label_value> must exist on the node and must match the nodeselector label and value applied to the nodes you want the ingressfirewallconfig CR to run on. The <label_value> can be true or false. By using nodeSelector labels, you can target separate groups of nodes to apply different rules to using the ingressfirewallconfig CR.
9.5.2.3. Zero trust Ingress Node Firewall rules object example
Zero trust Ingress Node Firewall rules can provide additional security to multi-interface clusters. For example, you can use zero trust Ingress Node Firewall rules to drop all traffic on a specific interface except for SSH.
A complete configuration of a zero trust Ingress Node Firewall rule for a network-interface cluster is specified in the following example:
Users need to add all ports their application will use to their allowlist in the following case to ensure proper functionality.
Example zero trust Ingress Node Firewall rules
apiVersion: ingressnodefirewall.openshift.io/v1alpha1
kind: IngressNodeFirewall
metadata:
 name: ingressnodefirewall-zero-trust
spec:
 interfaces:
 - eth1
 nodeSelector:
   matchLabels:
     <ingress_firewall_label_name>: <label_value>
 ingress:
 - sourceCIDRs:
      - 0.0.0.0/0
   rules:
   - order: 10
     protocolConfig:
       protocol: TCP
       tcp:
         ports: 22
     action: Allow
   - order: 20
action: DenyeBPF Manager Operator integration is a Technology Preview feature only. Technology Preview features are not supported with Red Hat production service level agreements (SLAs) and might not be functionally complete. Red Hat does not recommend using them in production. These features provide early access to upcoming product features, enabling customers to test functionality and provide feedback during the development process.
For more information about the support scope of Red Hat Technology Preview features, see Technology Preview Features Support Scope.
9.6. Ingress Node Firewall Operator integration
Learn when to use eBPF Manager to load and manage Ingress Node Firewall programs.
The Ingress Node Firewall uses Content from www.kernel.org is not included.eBPF programs to implement some of its key firewall functionality. By default these eBPF programs are loaded into the kernel using a mechanism specific to the Ingress Node Firewall. You can configure the Ingress Node Firewall Operator to use the eBPF Manager Operator for loading and managing these programs instead.
When this integration is enabled, the following limitations apply:
- The Ingress Node Firewall Operator uses TCX if XDP is not available and TCX is incompatible with bpfman.
-
The Ingress Node Firewall Operator daemon set pods remain in the
ContainerCreatingstate until the firewall rules are applied. - The Ingress Node Firewall Operator daemon set pods run as privileged.
9.7. Configuring Ingress Node Firewall Operator to use the eBPF Manager Operator
Configure the Ingress Node Firewall to use eBPF Manager for program lifecycle control.
The Ingress Node Firewall uses Content from www.kernel.org is not included.eBPF programs to implement some of its key firewall functionality. By default these eBPF programs are loaded into the kernel using a mechanism specific to the Ingress Node Firewall.
As a cluster administrator, you can configure the Ingress Node Firewall Operator to use the eBPF Manager Operator for loading and managing these programs instead, adding additional security and observability functionality.
Prerequisites
-
You have installed the OpenShift CLI (
oc). - You have an account with administrator privileges.
- You installed the Ingress Node Firewall Operator.
- You have installed the eBPF Manager Operator.
Procedure
Apply the following labels to the
ingress-node-firewall-systemnamespace:$ oc label namespace openshift-ingress-node-firewall \ pod-security.kubernetes.io/enforce=privileged \ pod-security.kubernetes.io/warn=privileged --overwriteEdit the
IngressNodeFirewallConfigobject namedingressnodefirewallconfigand set theebpfProgramManagerModefield:Ingress Node Firewall Operator configuration object
apiVersion: ingressnodefirewall.openshift.io/v1alpha1 kind: IngressNodeFirewallConfig metadata: name: ingressnodefirewallconfig namespace: openshift-ingress-node-firewall spec: nodeSelector: node-role.kubernetes.io/worker: "" ebpfProgramManagerMode: <ebpf_mode>where:
<ebpf_mode>: Specifies whether or not the Ingress Node Firewall Operator uses the eBPF Manager Operator to manage eBPF programs. Must be eithertrueorfalse. If unset, eBPF Manager is not used.
9.8. Viewing Ingress Node Firewall Operator rules
Inspect existing rules and configs to confirm the firewall is applied as intended.
Procedure
Run the following command to view all current rules :
$ oc get ingressnodefirewall
Choose one of the returned
<resource>names and run the following command to view the rules or configs:$ oc get <resource> <name> -o yaml
9.9. Troubleshooting the Ingress Node Firewall Operator
You can verify the status and view the logs to diagnose ingress firewall deployment or rule issues.
Procedure
Run the following command to list installed Ingress Node Firewall custom resource definitions (CRD):
$ oc get crds | grep ingressnodefirewall
Example output
NAME               READY   UP-TO-DATE   AVAILABLE   AGE
ingressnodefirewallconfigs.ingressnodefirewall.openshift.io       2022-08-25T10:03:01Z
ingressnodefirewallnodestates.ingressnodefirewall.openshift.io    2022-08-25T10:03:00Z
ingressnodefirewalls.ingressnodefirewall.openshift.io             2022-08-25T10:03:00Z
Run the following command to view the state of the Ingress Node Firewall Operator:
$ oc get pods -n openshift-ingress-node-firewall
Example output
NAME                                       READY  STATUS         RESTARTS  AGE
ingress-node-firewall-controller-manager   2/2    Running        0         5d21h
ingress-node-firewall-daemon-pqx56         3/3    Running        0         5d21h
The following fields provide information about the status of the Operator:
READY,STATUS,AGE, andRESTARTS. TheSTATUSfield isRunningwhen the Ingress Node Firewall Operator is deploying a daemon set to the assigned nodes.Run the following command to collect all ingress firewall node pods' logs:
$ oc adm must-gather – gather_ingress_node_firewall
The logs are available in the sos node’s report containing eBPF
bpftooloutputs at/sos_commands/ebpf. These reports include lookup tables used or updated as the ingress firewall XDP handles packet processing, updates statistics, and emits events.
9.10. Additional resources
Chapter 10. SR-IOV Operator
10.1. Installing the SR-IOV Network Operator
To manage SR-IOV network devices and network attachments on your cluster, install the Single Root I/O Virtualization (SR-IOV) Network Operator. By using this Operator, you can centralize the configuration and lifecycle management of your SR-IOV resources.
As a cluster administrator, you can install the Single Root I/O Virtualization (SR-IOV) Network Operator by using the OpenShift Container Platform CLI or the web console.
10.1.1. Using the CLI to install the SR-IOV Network Operator
You can use the CLI to install the SR-IOV Network Operator. By using the CLI, you can deploy the Operator directly from your terminal to manage SR-IOV network devices and attachments without navigating the web console.
Prerequisites
-
You installed the OpenShift CLI (
oc). -
You have an account with
cluster-adminprivileges. - You installed a cluster on bare-metal hardware, and you ensured that cluster nodes have hardware that supports SR-IOV.
Procedure
Create the
openshift-sriov-network-operatornamespace by entering the following command:$ cat << EOF| oc create -f - apiVersion: v1 kind: Namespace metadata: name: openshift-sriov-network-operator annotations: workload.openshift.io/allowed: management EOFCreate an
OperatorGroupcustom resource (CR) by entering the following command:$ cat << EOF| oc create -f - apiVersion: operators.coreos.com/v1 kind: OperatorGroup metadata: name: sriov-network-operators namespace: openshift-sriov-network-operator spec: targetNamespaces: - openshift-sriov-network-operator EOF
Create a
SubscriptionCR for the SR-IOV Network Operator by entering the following command:$ cat << EOF| oc create -f - apiVersion: operators.coreos.com/v1alpha1 kind: Subscription metadata: name: sriov-network-operator-subscription namespace: openshift-sriov-network-operator spec: channel: stable name: sriov-network-operator source: redhat-operators sourceNamespace: openshift-marketplace EOF
Create an
SriovoperatorConfigresource by entering the following command:$ cat <<EOF | oc create -f - apiVersion: sriovnetwork.openshift.io/v1 kind: SriovOperatorConfig metadata: name: default namespace: openshift-sriov-network-operator spec: enableInjector: true enableOperatorWebhook: true logLevel: 2 disableDrain: false EOF
Verification
To verify that the Operator is installed, enter the following command and then check that the output shows
Succeededfor the Operator:$ oc get csv -n openshift-sriov-network-operator \ -o custom-columns=Name:.metadata.name,Phase:.status.phase
10.1.2. Using the web console to install the SR-IOV Network Operator
You can use the web console to install the SR-IOV Network Operator. By using the web console, you can deploy the Operator and manage SR-IOV network devices and attachments directly from a graphical interface without having to use the CLI.
Prerequisites
-
You have an account with
cluster-adminprivileges. - You installed a cluster on bare-metal hardware, and you ensured that cluster nodes have hardware that supports SR-IOV.
Procedure
Install the SR-IOV Network Operator:
- In the OpenShift Container Platform web console, click Ecosystem → Software Catalog.
- Select SR-IOV Network Operator from the list of available Operators, and then click Install.
- On the Install Operator page, under Installed Namespace, select Operator recommended Namespace.
- Click Install.
Verification
- Navigate to the Ecosystem → Installed Operators page.
Ensure that SR-IOV Network Operator is listed in the openshift-sriov-network-operator project with a Status of InstallSucceeded.
NoteDuring installation an Operator might display a Failed status. If the installation later succeeds with an InstallSucceeded message, you can ignore the Failed message.
If the Operator does not show as installed, complete any of the following steps to troubleshoot the issue:
- Inspect the Operator Subscriptions and Install Plans tabs for any failure or errors under Status.
-
Navigate to the Workloads → Pods page and check the logs for pods in the
openshift-sriov-network-operatorproject. Check the namespace of the YAML file. If the annotation is missing, you can add the annotation
workload.openshift.io/allowed=managementto the Operator namespace with the following command:$ oc annotate ns/openshift-sriov-network-operator workload.openshift.io/allowed=management
NoteFor single-node OpenShift clusters, the annotation
workload.openshift.io/allowed=managementis required for the namespace.
10.1.3. Additional resources
10.2. Configuring the SR-IOV Network Operator
To manage SR-IOV network devices and network attachments in your cluster, use the Single Root I/O Virtualization (SR-IOV) Network Operator.
10.2.1. Configuring the SR-IOV Network Operator
To manage SR-IOV network devices and network attachments in your cluster, configure the Single Root I/O Virtualization (SR-IOV) Network Operator.
Procedure
Create a
SriovOperatorConfigcustom resource (CR). The following example creates a file namedsriovOperatorConfig.yaml:apiVersion: sriovnetwork.openshift.io/v1 kind: SriovOperatorConfig metadata: name: default namespace: openshift-sriov-network-operator spec: disableDrain: false enableInjector: true enableOperatorWebhook: true logLevel: 2 featureGates: metricsExporter: false # ...where:
metadata.name-
Specifies the name of the SR-IOV Network Operator instance. The only valid name for the
SriovOperatorConfigresource isdefaultand the name must be in the namespace where the Operator is deployed. spec.enableInjector-
Specifies if any
network-resources-injectorpod can run in the namespace. If not specified in the CR or explicitly set totrue, defaults tofalseor<none>, preventing anynetwork-resources-injectorpod from running in the namespace. The recommended setting istrue. spec.enableOperatorWebhook-
Specifies if any
operator-webhookpods can run in the namespace. TheenableOperatorWebhookfield, if not specified in the CR or explicitly set to true, defaults tofalseor<none>, preventing anyoperator-webhookpod from running in the namespace. The recommended setting istrue.
Apply the resource to your cluster by running the following command:
$ oc apply -f sriovOperatorConfig.yaml
10.2.2. SR-IOV Network Operator config custom resource
To customize the SR-IOV Network Operator, configure the sriovoperatorconfig custom resource.
The following table describes the sriovoperatorconfig CR fields:
Table 10.1. SR-IOV Network Operator config custom resource
| Field | Type | Description |
|---|---|---|
|
|
|
Specifies the name of the SR-IOV Network Operator instance. The default value is |
|
|
|
Specifies the namespace of the SR-IOV Network Operator instance. The default value is |
|
|
| Specifies the node selection to control scheduling the SR-IOV Network Config Daemon on selected nodes. By default, this field is not set and the Operator deploys the SR-IOV Network Config daemon set on compute nodes. |
|
|
|
Specifies whether to disable the node draining process or enable the node draining process when you apply a new policy to configure the NIC on a node. Setting this field to |
|
|
| Specifies whether to enable or disable the Network Resources Injector daemon set. |
|
|
| Specifies whether to enable or disable the Operator Admission Controller webhook daemon set. |
|
|
|
Specifies the log verbosity level of the Operator. By default, this field is set to |
|
|
|
Specifies whether to enable or disable the optional features. For example, |
|
|
|
Specifies whether to enable or disable the SR-IOV Network Operator metrics. By default, this field is set to |
|
|
|
Specifies whether to reset the firmware on virtual function (VF) changes in the SR-IOV Network Operator. Some chipsets, such as the Intel C740 Series, do not completely power off the PCI-E devices, which is required to configure VFs on NVIDIA/Mellanox NICs. By default, this field is set to Important
The For more information about the support scope of Red Hat Technology Preview features, see Technology Preview Features Support Scope. |
10.2.3. About the Network Resources Injector
You can use the Network Resources Injector, a Kubernetes Dynamic Admission Controller application, to mutate resource requests and limits in a pod specification and mutate a pod specification with a Downward API volume.
The Network Resources Injector provides the following capabilities:
- Mutation of resource requests and limits in a pod specification to add an SR-IOV resource name according to an SR-IOV network attachment definition annotation.
-
Mutation of a pod specification with a Downward API volume to expose pod annotations, labels, and huge pages requests and limits. Containers that run in the pod can access the exposed information as files under the
/etc/podnetinfopath.
The SR-IOV Network Operator enables the Network Resources Injector when the enableInjector is set to true in the SriovOperatorConfig CR. The network-resources-injector pod runs as a daemon set on all control plane nodes. The following is an example of Network Resources Injector pods running in a cluster with three control plane nodes:
$ oc get pods -n openshift-sriov-network-operator
Example output
NAME                                      READY   STATUS    RESTARTS   AGE
network-resources-injector-5cz5p          1/1     Running   0          10m
network-resources-injector-dwqpx          1/1     Running   0          10m
network-resources-injector-lktz5          1/1     Running   0          10m
By default, the failurePolicy field in the Network Resources Injector webhook is set to Ignore. This default setting prevents pod creation from being blocked if the webhook is unavailable.
If you set the failurePolicy field to Fail, and the Network Resources Injector webhook is unavailable, the webhook attempts to mutate all pod creation and update requests. This behavior can block pod creation and disrupt normal cluster operations. To prevent such issues, you can enable the featureGates.resourceInjectorMatchCondition feature in the SriovOperatorConfig object to limit the scope of the Network Resources Injector webhook. If this feature is enabled, the webhook applies only to pods with the secondary network annotation k8s.v1.cni.cncf.io/networks.
If you set the failurePolicy field to Fail after enabling the resourceInjectorMatchCondition feature, the webhook applies only to pods with the secondary network annotation k8s.v1.cni.cncf.io/networks. If the webhook is unavailable, the cluster still deploys pods without this annotation; this prevents unnecessary disruptions to cluster operations.
The featureGates.resourceInjectorMatchCondition feature is disabled by default. To enable this feature, set the featureGates.resourceInjectorMatchCondition field to true in the SriovOperatorConfig object.
Example SriovOperatorConfig object configuration
apiVersion: sriovnetwork.openshift.io/v1
kind: SriovOperatorConfig
metadata:
  name: default
  namespace: sriov-network-operator
spec:
# ...
  featureGates:
    resourceInjectorMatchCondition: true
# ...10.2.4. Disabling or enabling the Network Resources Injector
To control the automatic configuration of your cluster workloads, enable or disable the Network Resources Injector.
Prerequisites
-
Install the OpenShift CLI (
oc). -
Log in as a user with
cluster-adminprivileges. - You must have installed the SR-IOV Network Operator.
Procedure
Set the
enableInjectorfield. Replace<value>withfalseto disable the feature ortrueto enable the feature.$ oc patch sriovoperatorconfig default \ --type=merge -n openshift-sriov-network-operator \ --patch '{ "spec": { "enableInjector": <value> } }'TipYou can alternatively apply the following YAML to update the Operator:
apiVersion: sriovnetwork.openshift.io/v1
kind: SriovOperatorConfig
metadata:
  name: default
  namespace: openshift-sriov-network-operator
spec:
  enableInjector: <value>
# ...
10.2.5. About the SR-IOV Network Operator admission controller webhook
You can use the SR-IOV Network Operator Admission Controller webhook to mutate or validate the SriovNetworkNodePolicy CR.
-
Validation of the
SriovNetworkNodePolicyCR when it is created or updated. -
Mutation of the
SriovNetworkNodePolicyCR by setting the default value for thepriorityanddeviceTypefields when the CR is created or updated.
The SR-IOV Network Operator Admission Controller webhook is enabled by the Operator when the enableOperatorWebhook is set to true in the SriovOperatorConfig CR. The operator-webhook pod runs as a daemon set on all control plane nodes.
Use caution when disabling the SR-IOV Network Operator Admission Controller webhook. You can disable the webhook under specific circumstances, such as troubleshooting, or if you want to use unsupported devices. For information about configuring unsupported devices, see "Configuring the SR-IOV Network Operator to use an unsupported NIC".
The following is an example of the Operator Admission Controller webhook pods running in a cluster with three control plane nodes:
$ oc get pods -n openshift-sriov-network-operator
Example output
NAME                                      READY   STATUS    RESTARTS   AGE
operator-webhook-9jkw6                    1/1     Running   0          16m
operator-webhook-kbr5p                    1/1     Running   0          16m
operator-webhook-rpfrl                    1/1     Running   0          16m
Additional resources
10.2.6. Disabling or enabling the SR-IOV Network Operator admission controller webhook
To manage validation of your network configurations, enable or disable the SR-IOV Network Operator admission controller webhook.
Prerequisites
-
Install the OpenShift CLI (
oc). -
Log in as a user with
cluster-adminprivileges. - You must have installed the SR-IOV Network Operator.
Procedure
Set the
enableOperatorWebhookfield. Replace<value>withfalseto disable the feature ortrueto enable it:$ oc patch sriovoperatorconfig default --type=merge \ -n openshift-sriov-network-operator \ --patch '{ "spec": { "enableOperatorWebhook": <value> } }'TipYou can alternatively apply the following YAML to update the Operator:
apiVersion: sriovnetwork.openshift.io/v1
kind: SriovOperatorConfig
metadata:
  name: default
  namespace: openshift-sriov-network-operator
spec:
  enableOperatorWebhook: <value>
# ...
10.2.7. Configuring a custom NodeSelector for the SR-IOV Network Config daemon
The SR-IOV Network Config daemon discovers and configures the SR-IOV network devices on cluster nodes. By default, the daemon is deployed to all the compute nodes in the cluster. You can use node labels to specify on which nodes the SR-IOV Network Config daemon runs.
When you update the configDaemonNodeSelector field, the SR-IOV Network Config daemon is recreated on each selected node. While the daemon is recreated, cluster users are unable to apply any new SR-IOV Network node policy or create new SR-IOV pods.
Procedure
To update the node selector for the Operator, enter the following command:
$ oc patch sriovoperatorconfig default --type=json \ -n openshift-sriov-network-operator \ --patch '[{ "op": "replace", "path": "/spec/configDaemonNodeSelector", "value": {<node_label>} }]'Replace
<node_label>with a label to apply as in the following example:"node-role.kubernetes.io/worker": "".TipYou can alternatively apply the following YAML to update the Operator:
apiVersion: sriovnetwork.openshift.io/v1
kind: SriovOperatorConfig
metadata:
  name: default
  namespace: openshift-sriov-network-operator
spec:
  configDaemonNodeSelector:
    <node_label>
# ...
10.2.8. Configuring the SR-IOV Network Operator for single node installations
By default, the SR-IOV Network Operator drains workloads from a node before every policy change. The Operator performs this action to ensure that no workloads are using the virtual functions before the reconfiguration. As a result, you must configure the Operator to not drain workloads from the single node.
For installations on a single node, other nodes do not receive the workloads.
After performing the following procedure to disable draining workloads, you must remove any workload that uses an SR-IOV network interface before you change any SR-IOV network node policy.
Prerequisites
-
Install the OpenShift CLI (
oc). -
Log in as a user with
cluster-adminprivileges. - You must have installed the SR-IOV Network Operator.
Procedure
To set the
disableDrainfield totrueand theconfigDaemonNodeSelectorfield tonode-role.kubernetes.io/master: "", enter the following command:$ oc patch sriovoperatorconfig default --type=merge -n openshift-sriov-network-operator --patch '{ "spec": { "disableDrain": true, "configDaemonNodeSelector": { "node-role.kubernetes.io/master": "" } } }'TipYou can alternatively apply the following YAML to update the Operator:
apiVersion: sriovnetwork.openshift.io/v1
kind: SriovOperatorConfig
metadata:
  name: default
  namespace: openshift-sriov-network-operator
spec:
  disableDrain: true
  configDaemonNodeSelector:
   node-role.kubernetes.io/master: ""
# ...
10.2.8.1. Deploying the SR-IOV Operator for hosted control planes
After you configure and deploy your hosting service cluster, you can create a subscription to the SR-IOV Operator on a hosted cluster. The SR-IOV pod runs on worker machines rather than the control plane.
Prerequisites
You must configure and deploy the hosted cluster on AWS.
Procedure
Create a namespace and an Operator group:
apiVersion: v1
kind: Namespace
metadata:
  name: openshift-sriov-network-operator
---
apiVersion: operators.coreos.com/v1
kind: OperatorGroup
metadata:
  name: sriov-network-operators
  namespace: openshift-sriov-network-operator
spec:
  targetNamespaces:
  - openshift-sriov-network-operator
Create a subscription to the SR-IOV Operator:
apiVersion: operators.coreos.com/v1alpha1
kind: Subscription
metadata:
  name: sriov-network-operator-subsription
  namespace: openshift-sriov-network-operator
spec:
  channel: stable
  name: sriov-network-operator
  config:
    nodeSelector:
      node-role.kubernetes.io/worker: ""
  source: redhat-operators
  sourceNamespace: openshift-marketplace
Verification
To verify that the SR-IOV Operator is ready, run the following command and view the resulting output:
$ oc get csv -n openshift-sriov-network-operator
Example output
NAME                                         DISPLAY                   VERSION               REPLACES                                     PHASE
sriov-network-operator.4.22.0-202211021237   SR-IOV Network Operator   4.22.0-202211021237   sriov-network-operator.4.22.0-202210290517   Succeeded
To verify that the SR-IOV pods are deployed, run the following command:
$ oc get pods -n openshift-sriov-network-operator
10.2.9. About the SR-IOV network metrics exporter
The Single Root I/O Virtualization (SR-IOV) network metrics exporter reads the metrics for SR-IOV virtual functions (VFs) and exposes these VF metrics in Prometheus format. When the SR-IOV network metrics exporter is enabled, you can query the SR-IOV VF metrics by using the OpenShift Container Platform web console to monitor the networking activity of the SR-IOV pods.
When you query the SR-IOV VF metrics by using the web console, the SR-IOV network metrics exporter fetches and returns the VF network statistics along with the name and namespace of the pod that the VF is attached to.
The following table describes the SR-IOV VF metrics that the metrics exporter reads and exposes in Prometheus format:
Table 10.2. SR-IOV VF metrics
| Metric | Description | Example PromQL query to examine the VF metric |
|---|---|---|
|
| Received bytes per virtual function. |
|
|
| Transmitted bytes per virtual function. |
|
|
| Received packets per virtual function. |
|
|
| Transmitted packets per virtual function. |
|
|
| Dropped packets upon receipt per virtual function. |
|
|
| Dropped packets during transmission per virtual function. |
|
|
| Received multicast packets per virtual function. |
|
|
| Received broadcast packets per virtual function. |
|
|
| Virtual functions linked to active pods. | - |
You can also combine these queries by using the kube-state-metrics tool to get more information about the SR-IOV pods. For example, you can use the following query to get the VF network statistics along with the application name from the standard Kubernetes pod label:
(sriov_vf_tx_packets * on (pciAddr,node) group_left(pod,namespace) sriov_kubepoddevice) * on (pod,namespace) group_left (label_app_kubernetes_io_name) kube_pod_labels
10.2.9.1. Enabling the SR-IOV network metrics exporter
To enable the SR-IOV network metrics exporter, set the spec.featureGates.metricsExporter field to true. Because the exporter is disabled by default, you must explicitly enable the SR-IOV network metrics exporter.
When the metrics exporter is enabled, the SR-IOV Network Operator deploys the metrics exporter only on nodes with SR-IOV capabilities.
Prerequisites
-
You have installed the OpenShift CLI (
oc). -
You have logged in as a user with
cluster-adminprivileges. - You have installed the SR-IOV Network Operator.
Procedure
Enable cluster monitoring by running the following command:
$ oc label ns/openshift-sriov-network-operator openshift.io/cluster-monitoring=true
To enable cluster monitoring, you must add the
openshift.io/cluster-monitoring=truelabel in the namespace where you have installed the SR-IOV Network Operator.Set the
spec.featureGates.metricsExporterfield totrueby running the following command:$ oc patch -n openshift-sriov-network-operator sriovoperatorconfig/default \ --type='merge' -p='{"spec": {"featureGates": {"metricsExporter": true}}}'
Verification
Check that the SR-IOV network metrics exporter is enabled by running the following command:
$ oc get pods -n openshift-sriov-network-operator
Example output
NAME                                     READY   STATUS    RESTARTS   AGE
operator-webhook-hzfg4                   1/1     Running   0          5d22h
sriov-network-config-daemon-tr54m        1/1     Running   0          5d22h
sriov-network-metrics-exporter-z5d7t     1/1     Running   0          10s
sriov-network-operator-cc6fd88bc-9bsmt   1/1     Running   0          5d22h
Ensure that
sriov-network-metrics-exporterpod is in theREADYstate.- Optional: Examine the SR-IOV virtual function (VF) metrics by using the OpenShift Container Platform web console. For more information, see "Querying metrics".
10.3. Uninstalling the SR-IOV Network Operator
To uninstall the SR-IOV Network Operator, you must delete any running SR-IOV workloads, uninstall the Operator, and delete the webhooks that the Operator used.
10.3.1. Uninstalling the SR-IOV Network Operator
You can remove the SR-IOV Network Operator from your cluster by uninstalling the Operator. This ensures that the Operator and its associated resources are deleted when you no longer need to manage SR-IOV network devices.
Prerequisites
-
You have access to an OpenShift Container Platform cluster using an account with
cluster-adminpermissions. - You have the SR-IOV Network Operator installed.
Procedure
Delete all SR-IOV custom resources (CRs):
$ oc delete sriovnetwork -n openshift-sriov-network-operator --all
$ oc delete sriovnetworknodepolicy -n openshift-sriov-network-operator --all
$ oc delete sriovibnetwork -n openshift-sriov-network-operator --all
$ oc delete sriovoperatorconfigs -n openshift-sriov-network-operator --all
- Follow the instructions in the "Deleting Operators from a cluster" section to remove the SR-IOV Network Operator from your cluster.
Delete the SR-IOV custom resource definitions that remain in the cluster after the SR-IOV Network Operator is uninstalled:
$ oc delete crd sriovibnetworks.sriovnetwork.openshift.io
$ oc delete crd sriovnetworknodepolicies.sriovnetwork.openshift.io
$ oc delete crd sriovnetworknodestates.sriovnetwork.openshift.io
$ oc delete crd sriovnetworkpoolconfigs.sriovnetwork.openshift.io
$ oc delete crd sriovnetworks.sriovnetwork.openshift.io
$ oc delete crd sriovoperatorconfigs.sriovnetwork.openshift.io
Delete the SR-IOV Network Operator namespace:
$ oc delete namespace openshift-sriov-network-operator
10.3.2. Additional resources
Chapter 11. DPU Operator
11.1. DPU Operator
As a cluster administrator, you can add the Data Processing Unit (DPU) Operator to your cluster to manage DPU devices and network attachments.
The DPU Operator is a Technology Preview feature only. Technology Preview features are not supported with Red Hat production service level agreements (SLAs) and might not be functionally complete. Red Hat does not recommend using them in production. These features provide early access to upcoming product features, enabling customers to test functionality and provide feedback during the development process.
For more information about the support scope of Red Hat Technology Preview features, see Technology Preview Features Support Scope.
11.1.1. Orchestrating DPUs with the DPU Operator
You can use the Data Processing Unit (DPU) Operator to manage DPUs that offload networking, storage, and security workloads from host CPUs to improve cluster performance and efficiency.
A DPU is a type of programmable processor that represents one of the three fundamental pillars of computing, alongside CPUs and GPUs. While CPUs handle general computing tasks and GPUs accelerate specific workloads, the primary role of the DPU is to offload and accelerate data-centric workloads, such as networking, storage, and security functions.
DPUs are typically used in data centers and cloud environments to improve performance, reduce latency, and enhance security by offloading these tasks from the CPU. You can also use DPUs to create a more efficient and flexible infrastructure by enabling the deployment of specialized workloads closer to the data source.
The DPU Operator is responsible for managing the DPU devices and network attachments. The DPU Operator deploys the DPU daemon onto OpenShift Container Platform compute nodes that interface through an API controlling the DPU daemon running on the DPU. The DPU Operator is responsible for the life-cycle management of the ovn-kube components and the necessary host network initialization on the DPU.
The following table describes the currently supported DPU devices.
Table 11.1. Supported devices
| Vendor | Device | Firmware | Description |
|---|---|---|---|
| Intel | IPU E2100 | Version 2.0.0.11126 or later | A DPU designed to offload networking, storage, and security tasks from host CPUs in data centers, improving efficiency and performance. For instructions on deploying a full end-to-end solution, see the Red Hat Knowledgebase solution Accelerating Confidential AI on OpenShift with the Intel E2100 IPU, DPU Operator, and F5 NGINX. |
| Senao | SX904 | 35.23.47.0008 or later | A SmartNIC designed to offload compute and network services from the host CPUs in data centers and edge computing environments, improving efficiency and isolation of workloads. |
| Marvell | Marvell Octeon 10 CN106 | SDK12.25.01 or later | A DPU designed to offload workloads that require high speed data processing from host CPUs in data centers and edge computing environments, improving performance and energy efficiency |
The NVIDIA BlueField-3 is not supported.
11.1.2. Installing the DPU Operator
You can install the Data Processing Unit (DPU) Operator on both host and DPU clusters to manage device lifecycle and network attachments by using the CLI or web console.
Cluster administrators can install the DPU Operator on the host cluster and all DPU clusters by using the OpenShift Container Platform CLI or the web console. The DPU Operator manages the lifecycle, DPU devices, and network attachments for all supported DPUs.
You need to install the DPU Operator on the host cluster and each of the DPU clusters.
11.1.2.1. Installing the DPU Operator by using the CLI
You can install the DPU Operator by using the CLI. You can use the DPU Operator to simplify the installation process when setting up DPU device management on host clusters.
As a cluster administrator, you can install the DPU Operator by using the CLI.
The CLI must be used to install the DPU Operator on the DPU cluster.
Prerequisites
-
Install the OpenShift CLI (
oc). -
An account with
cluster-adminprivileges.
Procedure
Create the
openshift-dpu-operatornamespace by entering the following command:$ cat << EOF| oc create -f - apiVersion: v1 kind: Namespace metadata: name: openshift-dpu-operator annotations: workload.openshift.io/allowed: management EOFCreate an
OperatorGroupcustom resource (CR) by entering the following command:$ cat << EOF| oc create -f - apiVersion: operators.coreos.com/v1 kind: OperatorGroup metadata: name: dpu-operators namespace: openshift-dpu-operator spec: targetNamespaces: - openshift-dpu-operator EOF
Create a
SubscriptionCR for the DPU Operator by entering the following command:$ cat << EOF| oc create -f - apiVersion: operators.coreos.com/v1alpha1 kind: Subscription metadata: name: openshift-dpu-operator-subscription namespace: openshift-dpu-operator spec: channel: stable name: dpu-operator source: redhat-operators sourceNamespace: openshift-marketplace EOF
Verification
To verify that the Operator is installed, enter the following command and then check that output shows
Succeededfor the Operator:$ oc get csv -n openshift-dpu-operator \ -o custom-columns=Name:.metadata.name,Phase:.status.phase
Change to the
openshift-dpu-operatorproject:$ oc project openshift-dpu-operator
Verify the DPU Operator is running by entering the following command:
$ oc get pods -n openshift-dpu-operator
Example output
NAME READY STATUS RESTARTS AGE dpu-operator-controller-manager-6b7bbb5db8-7lvkj 2/2 Running 0 2m9s
11.1.2.2. Installing the DPU Operator using the web console
You can install the DPU Operator by using the web console. You can use the DPU Operator to simplify the installation process when setting up DPU device management on host clusters.
As a cluster administrator, you can install the DPU Operator by using the web console.
Prerequisites
-
Install the OpenShift CLI (
oc). -
An account with
cluster-adminprivileges.
Procedure
- In the OpenShift Container Platform web console, click Ecosystem → Software Catalog.
- Select DPU Operator from the list of available Operators, and then click Install.
On the Install Operator page, under Installed Namespace, the Operator recommended Namespace option is preselected by default. No action is required.
- Click Install.
Verification
- Navigate to the Ecosystem → Installed Operators page.
Ensure that the openshift-dpu-operator project lists DPU Operator with a Status of InstallSucceeded.
NoteDuring installation an Operator might display a Failed status. If the installation later succeeds with an InstallSucceeded message, you can ignore the Failed message.
Troubleshooting
- Inspect the Operator Subscriptions and Install Plans tabs for any failure or errors under Status.
-
Navigate to the Workloads → Pods page and check the logs for pods in the
openshift-dpu-operatorproject. Check the namespace of the YAML file. If the annotation is missing, you can add the annotation
workload.openshift.io/allowed=managementto the Operator namespace with the following command:$ oc annotate ns/openshift-dpu-operator workload.openshift.io/allowed=management
NoteFor single-node OpenShift clusters, the annotation
workload.openshift.io/allowed=managementis required for the namespace.
11.1.3. Configuring the DPU Operator
You can configure the DPU Operator after installation to enable management of DPU devices and network attachments in both dual cluster and single cluster deployment modes.
You can configure the DPU Operator to manage the DPU devices and network attachments in your cluster.
To configure the DPU Operator follow these steps:
Procedure
Create the
DpuOperatorConfigCustom Resource (CR) based on your deployment mode:-
Dual Cluster Deployment: You must create the
DpuOperatorConfigCR on both the host OpenShift Container Platform cluster and on each of the Red Hat build of MicroShift (MicroShift) DPU clusters. Single Cluster Deployment: This deployment uses a standard OpenShift Container Platform cluster. You only need to create the
DpuOperatorConfigCR once on this cluster.The content of the CR is the same for all clusters.
-
Dual Cluster Deployment: You must create the
Create a file named
dpu-operator-config.yamlby using the following YAML:apiVersion: config.openshift.io/v1 kind: DpuOperatorConfig metadata: name: dpu-operator-config spec: logLevel: 0
-
metadata.name: Specifies the name of the Custom Resource, which must bedpu-operator-config. -
spec.logLevel: Sets the required logging verbosity in the Operator container logs. The value0is the default setting.
-
Create the resource by running the following command:
$ oc apply -f dpu-operator-config.yaml
Label all nodes that either have an attached DPU or are functioning as a DPU. You can apply this label by running the following command:
$ oc label node <node_name> dpu=true
where:
node_nameRefers to the name of your node, such as
worker-1.NoteThere are two ways to deploy clusters that are compatible with DPUs:
-
Dual cluster deployment: This consists of OpenShift Container Platform running on the hosts and Red Hat build of MicroShift (MicroShift) running on the DPU. In this mode, the Red Hat build of MicroShift (MicroShift) instance also needs to deploy the DPU Operator, and you must set the label
dpu=trueon the node. -
Single cluster deployment: This consists of only OpenShift Container Platform running on hosts, where the DPUs are integrated into the main cluster. DPUs just require the label
dpu=truefor both the host nodes with DPUs installed and the DPU nodes themselves. The DPU Operator automatically detects the role of the node whether it is running as a DPU or a host with an attached DPU.
-
Dual cluster deployment: This consists of OpenShift Container Platform running on the hosts and Red Hat build of MicroShift (MicroShift) running on the DPU. In this mode, the Red Hat build of MicroShift (MicroShift) instance also needs to deploy the DPU Operator, and you must set the label
11.1.4. Running a workload on the host with DPU
You can deploy workloads on the host with DPU to offload specialized infrastructure tasks and improve performance while freeing up host CPU resources.
Running workloads on a DPU enables offloading specialized infrastructure tasks such as networking, security, and storage to a dedicated processing unit. This improves performance, enforces a stronger security boundary between infrastructure and application workloads, and frees up host CPU resources.
Follow these steps to deploy a workload on the host with DPU. This is the standard deployment model where the application runs on the host’s x86 CPU but utilizes the DPU for network acceleration and offload.
Prerequisites
-
The OpenShift CLI (
oc) is installed. -
An account with
cluster-adminprivileges is available. - The DPU Operator is installed.
Procedure
Create a sample workload designed to run on the host-side worker node by using the following YAML. Save the file as
workload-host.yaml:apiVersion: v1 kind: Pod metadata: name: my-pod namespace: default annotations: k8s.v1.cni.cncf.io/networks: default-sriov-net spec: nodeSelector: kubernetes.io/hostname: worker-237 containers: - name: appcntr1 image: registry.access.redhat.com/ubi9/ubi:latest command: ['/bin/sh', '-c', 'sleep infinity'] imagePullPolicy: Always securityContext: priviledged: true runAsNonRoot: false runAsUser: 0 seccompProfile: type: RuntimeDefault resources: requests: openshift.io/dpu: '1' limits: openshift.io/dpu: '1'spec.nodeSelector: The node selector schedules the pod on the node with the DPU resource. You can use any standard Kubernetes selector for this, such askubernetes.io/hostname, to target a specific node as shown in the example YAML.NoteFor flexible scheduling, the DPU Operator creates the label dpu.config.openshift.io/dpuside: "dpu-host". This label enables the default scheduler to place the workload on any host with a DPU. The workload automatically joins that DPU secondary network. When the label on the node is
dpu.config.openshift.io/dpuside: "dpu", this signifies that the node is the DPU itself. The DPU Operator creates and manages thedpu.config.openshift.io/dpusidelabel .Create the workload by running the following command:
$ oc apply -f workload-host.yaml
11.1.5. Running a workload on the DPU
You can deploy network workloads directly on the DPU to improve performance, enhance security isolation, and reduce host CPU usage.
The DPU offloads network workloads, such as security functions or virtualized appliances, to improve performance, enhance security isolation, and free host CPU resources.
Follow this procedure to deploy a simple pod directly onto the DPU.
Prerequisites
-
Install the OpenShift CLI (
oc). -
An account with
cluster-adminprivileges. - Install the DPU Operator.
Procedure
Save the following YAML file example as
dpu-pod.yaml. This is an example of a simple pod that will be scheduled directly onto a DPU node by the Kubernetes default scheduler.apiVersion: v1 kind: Pod metadata: name: "my-network-function" namespace: openshift-dpu-operator annotations: k8s.v1.cni.cncf.io/networks: dpunfcni-conf, dpunfcni-conf spec: nodeSelector: dpu.config.openshift.io/dpuside: "dpu" containers: - name: "my-network-function" image: "quay.io/example-org/my-network-function:latest" resources: requests: openshift.io/dpu: "2" limits: openshift.io/dpu: "2" securityContext: privileged: true capabilities: drop: - ALL add: - NET_RAW - NET_ADMIN-
metadata.name.annotations.k8s.v1.cni.cncf.io/networks: The valuedpunfcni-confspecifies the name of theNetworkAttachmentDefinitionresource. The DPU Operator creates this resource during installation to configure the DPU networking. -
spec.nodeSelector: ThenodeSelectoris the primary mechanism for scheduling this workload. The DPU Operator creates and maintains the label:dpu.config.openshift.io/dpuside: "dpu". This label ensures the pod is scheduled directly onto the DPU processing unit. -
spec.containers.name: The name of the container. -
spec.containers.image: The container image to pull and run.
-
Create the pod by running the following command:
$ oc apply -f dpu-pod.yaml
Verify the pod status by running the following command:
$ oc get pods -n openshift-dpu-operator
Ensure the pod’s status is
Running.
11.1.6. Monitoring the status of DPU
You can monitor the DPU infrastructure status to check the current state and health of your DPU devices across the cluster.
You can monitor the DPU status to see the current state of the DPU infrastructure.
The oc get dpu command shows the current state of the DPU infrastructure. Follow this procedure to monitor the status of various cards.
Prerequisites
-
The OpenShift CLI (
oc) is installed. -
An account with
cluster-adminprivileges is available. - The DPU Operator is installed.
Procedure
Run the following command to check the overall health of your nodes:
$ oc get nodes
The example output provides a list of all nodes in the cluster along with their status. Ensure that all nodes are in the
Readystate before proceeding.NAME STATUS ROLES AGE VERSION ocpcluster-master-1 Ready master 10d v1.32.9 ocpcluster-master-2 Ready master 10d v1.32.9 ocpcluster-master-3 Ready master 10d v1.32.9 ocpcluster-dpu-ipu-219 Ready worker 42h v1.32.9 ocpcluster-dpu-marvell-41 Ready worker 3d23h v1.32.9 ocpcluster-dpu-ptl-243 Ready worker 3d23h v1.32.9 worker-host-ipu-219 Ready worker 3d19h v1.32.9 worker-host-marvell-41 Ready worker 4d v1.32.9 worker-host-ptl-243 Ready worker 3d23h v1.32.9
This output shows three control plane nodes, and three worker nodes identified by the worker-host prefix, for example,
worker-host-ipu-219. Each worker node has a DPU identified by the ocpcluster-dpu prefix, for example,ocpcluster-dpu-ipu-219.Run the following command to report on the status of the DPUs:
$ oc get dpu
The example output provides a list of detected DPUs.
NAME DPU PRODUCT DPU SIDE MODE NAME STATUS 030001163eec00ff-host Intel Netsec Accelerator false worker-host-ptl-243 True d4-e5-c9-00-ec-3v-dpu Intel Netsec Accelerator true worker-dpu-ptl-243 True intel-ipu-0000-06-00.0-host Intel IPU E2100 false worker-host-ipu-219 False intel-ipu-dpu Intel IPU E2100 true worker-dpu-ipu-219 False marvell-dpu-0000-87-00.0-host Marvell DPU false worker-host-marvell-41 True marvell-dpu-ipu Marvell DPU true worker-dpu-marvell-41 True
where:
DPU PRODUCT- Displays the vendor or type of DPU, for example, Intel or Marvell.
DPU SIDE-
Indicates whether the DPU is operating on the host side (
false) or the DPU side (true). Each physical DPU is represented twice. MODE NAME-
The name of the node where the DPU is located. This is the host worker node for
falseentries and the DPU node fortrueentries. STATUSIndicates whether the DPU is functioning correctly (
True) or has issues (False).NoteRun
oc get dpu -o yamlto get more details about the status.
11.1.7. Uninstalling the DPU Operator
You can uninstall the DPU Operator from your cluster when you no longer need DPU device management, ensuring all workloads are deleted first.
To uninstall the DPU Operator, you must first delete any running DPU workloads. Follow this procedure to uninstall the DPU Operator.
Prerequisites
-
You have access to an OpenShift Container Platform cluster using an account with
cluster-adminpermissions. - You have the DPU Operator installed.
Procedure
Delete the
DpuOperatorConfigCR by running the following command:$ oc delete DpuOperatorConfig dpu-operator-config
Delete the subscription that was used to install the DPU Operator by running the following command:
$ oc delete Subscription openshift-dpu-operator-subscription -n openshift-dpu-operator
Remove the
OperatorGroupresource that was created by running the following command:$ oc delete OperatorGroup dpu-operators -n openshift-dpu-operator
Uninstall the DPU Operator as follows:
Check the installed Operators by running the following command:
$ oc get csv -n openshift-dpu-operator
The following example shows the output:
NAME DISPLAY VERSION REPLACES PHASE dpu-operator.v4.22.0-202503130333 DPU Operator 4.22.0-202503130333 Failed
Delete the DPU Operator by running the following command:
$ oc delete csv dpu-operator.v4.22.0-202503130333 -n openshift-dpu-operator
Delete the namespace that was created for the DPU Operator by running the following command:
$ oc delete namespace openshift-dpu-operator
Verification
Verify that the DPU Operator is uninstalled by running the following command. An example of successful command output is
No resources found in openshift-dpu-operator namespace.$ oc get csv -n openshift-dpu-operator
Additional resources
Chapter 12. NVIDIA DPF Operator
12.1. NVIDIA DPF Operator release notes
Use the release notes to learn what is new or changed in the NVIDIA DPF Operator.
12.1.1. Release notes for NVIDIA DPF Operator 26.4.1
The NVIDIA DPF Operator on OpenShift Container Platform has known limitations for uninstall, secrets, MTU, secure boot, multi-DPU hosts, and HBN, unsupported OVN-Kubernetes features, and issues that can affect Grafana and DTS metrics.
12.1.1.1. DPF Operator v26.4.1
New features and enhancements
- Enhanced observability with DTS integration
- Added comprehensive DPU telemetry monitoring through the DOCA Telemetry Service (DTS) with built-in OpenShift Container Platform Console dashboard integration. DTS metrics are now accessible directly through the OpenShift Container Platform web console without requiring additional tools.
- Improved hosted control planes integration
- The DPF HCP Provisioner Operator provides enhanced lifecycle management for DPU hosted clusters, including automatic CSR approval, kubeconfig injection, and BlueField container image lookup.
- Advanced traffic validation
-
A comprehensive traffic validation framework with pre-configured test pods uses
nicolaka/netshootcontainers to validate end-to-end DPU service chain functionality. - Enhanced troubleshooting capabilities
- Expanded diagnostic tools and troubleshooting procedures cover DPU provisioning, hosted cluster management, networking issues, and comprehensive log collection.
Bug fixes
- Improved BFB image handling
- Fixed issues with BlueField Bootstream File (BFB) image download and verification processes.
- Enhanced worker node detection
- Resolved Node Feature Discovery (NFD) compatibility issues for reliable DPU hardware detection.
- Networking stability improvements
-
Fixed OVN-Kubernetes integration issues that could cause worker nodes to remain in
NotReadystate.
Known issues and limitations
- Only x86_64 workers are supported
- Only x86_64 worker nodes are supported in this release. ARM-based DPU workers are not supported.
- DPF Operator uninstall is not supported
-
The DPF Operator does not support an automated uninstall. If you must remove DPF, set
spec.manageDPUServiceTemplatestofalsein theDPFHCPProvisionerConfigresource before you uninstall. This prevents the DPF HCP Provisioner Operator from continuing to manageDPUServiceTemplateresources during the uninstall process. - Secret references are immutable
-
The pull secret and SSH secret references are immutable after creation and cannot be modified. Ensure that each secret contains the correct data before you create it and reference it in the
DPFHCPProvisionercustom resource. - Secondary pod interfaces are not supported
- Secondary pod interfaces (MultiNetwork) are not supported.
- MTU changes are not supported after deployment
- You cannot change the MTU value after deployment.
controlPlaneMTUandhighSpeedMTUmust use the same value-
In the
DPFOperatorConfigcustom resource, you must setcontrolPlaneMTUandhighSpeedMTUto the same value, either1500or9000. - Secure boot firmware requirement
- To boot the RHCOS BFB image with secure boot enabled, the DPU firmware must be at version 3.1.0 or later. Use a BFB firmware bundle to upgrade the firmware.
- Multi-DPU hosts are not supported
- Hosts with more than one DPU are not supported.
- Redeploying a DPUDeployment is not supported
-
Redeploying a
DPUDeploymentis not supported in this release. - Deployments cannot target all nodes in a cluster
- Because of a limitation in the resource injector, a deployment can target either the DPU workers or all other nodes, but not both.
- Host-Based Networking (HBN) pods stuck in FailedCreatePodSandBox
-
An HBN daemon set pod might remain in the
FailedCreatePodSandBoxstate. As a workaround, delete and re-create the affected pods. For more information, see This content is not included.OCPBUGS-100251. - HostedCluster upgrade during an in-progress upgrade
-
Changing the
ocpReleaseImageof aHostedClusterwhile an upgrade is already in progress is not supported. - Connectivity loss after a DPU reboot or upgrade
When a DPU reboots, the corresponding DPU worker node loses connectivity and a
NoExecutetaint is added to the host. Most pods are evicted immediately, but some daemon set pods remain and might lose connectivity until you re-create them. For example:Example output
openshift-network-diagnostics network-check-target-lpkp2 0/1 Running
- DPU stuck in the NodeEffect or Initializing state
The NVIDIA Maintenance Operator might fail to pause the machine config pool, which leaves the DPU in the
NodeEffectorInitializingstate. As a workaround, pause theworker-dpumachine config pool manually:$ oc patch mcp worker-dpu --type merge -p '{ "spec": {"paused": true}, "metadata": {"annotations": {"maintenance.nvidia.com/mcp-paused": "true"}} }'- Workload pods do not recover after an IPMI reset reboot
- After an IPMI reset reboot, workload pods might fail to recover because of a known kubelet bug (Content from github.com is not included.Kubernetes issue 128043) that prevents virtual function (VF) devices from being re-created immediately at startup. This does not break functionality, but it leaves the cluster in an inconsistent state. Standard and IPMI2 reboots recover cleanly. As a workaround, re-create the affected pods manually if needed.
- The SR-IOV device plugin can report fewer virtual functions than configured
-
After a node reboot or DPU redeployment, the SR-IOV device plugin might publish the node’s virtual function (VF) resource count before all VFs are created. The init container unblocks when the first VF appears instead of waiting for all configured VFs, so the reported
openshift.io/bf3_vfscapacity can be lower than expected. As a workaround, restart the SR-IOV device plugin pod on the affected node, after which the full count is reported.
OVN-Kubernetes feature support
The following table lists the support and hardware offload status of OVN-Kubernetes features in this release.
Table 12.1. OVN-Kubernetes feature support and offload status
| Feature | Supported | Offloaded |
|---|---|---|
| Administrative Network Policies (ANP) | Yes | Yes |
| Egress IP | Yes | No |
| Egress Firewall | Yes | No |
| Egress Quality of Service (QoS) | Yes | No |
| Secondary networks | No | No |
| User Defined Networks (UDN) | No | No |
| Quality of Service (QoS) | No | No |
| Multiple External Gateways (MEG) | No | No |
| OVN-Kubernetes identity | No | No |
| Border Gateway Protocol (BGP) | No | No |
| Multicast | No | No |
| Hybrid Overlay | No | No |
| Local gateway mode | No | No |
| IPFIX or NetFlow sampling | No | No |
Grafana deployment issues
- Grafana shows that the application is not available
Grafana pods might be scheduled on worker nodes that depend on DPU networking, which creates a circular dependency.
Configure Grafana to run on control plane nodes by adding
nodeSelectorandtolerationsto the Grafana custom resource:spec: deployment: spec: template: spec: nodeSelector: node-role.kubernetes.io/control-plane: "" tolerations: - key: node-role.kubernetes.io/master operator: Exists effect: NoSchedule - key: node-role.kubernetes.io/control-plane operator: Exists effect: NoSchedule
DTS metrics collection issues
- DTS metrics are not appearing in Prometheus or Grafana
The
ServiceMonitormight not be configured correctly, or DTS pods might not be running.Verify that DTS pods are running:
$ oc get pods -n dpf-operator-system -l app=dts
Check the
ServiceMonitorconfiguration:$ oc get servicemonitor -n dpf-operator-system $ oc describe servicemonitor <servicemonitor-name> -n dpf-operator-system
Verify that user workload monitoring is enabled:
$ oc get configmap cluster-monitoring-config -n openshift-monitoring -o yaml
Check Prometheus targets to ensure that DTS endpoints are being scraped. Access the Prometheus web console and go to Status → Targets to verify that DTS endpoints are listed and healthy.
12.2. About the NVIDIA DPF Operator
The NVIDIA DOCA Platform Framework (DPF) Operator enables hardware-accelerated networking on OpenShift Container Platform by offloading OVN-Kubernetes data plane operations to NVIDIA BlueField-3 Data Processing Units (DPUs).
The DPF deployment creates a dual-cluster topology consisting of a management cluster running on x86 servers and a hosted DPU cluster running on BlueField-3 DPUs.
12.2.1. DPF architecture overview
The NVIDIA DOCA Platform Framework (DPF) v26.4.1 deployment on OpenShift Container Platform 4.22 offloads OVN-Kubernetes data plane operations to NVIDIA BlueField-3 DPUs.
In Host Trusted deployments, DPF uses BlueField DPUs as host accelerators, and the host is part of the trusted domain. Administrators can orchestrate both workloads and DPU-accelerated infrastructure by using standard OpenShift Container Platform APIs and custom resource definitions (CRDs).
By offloading critical OpenShift Container Platform networking functions, such as OVN-Kubernetes, to the DPU, the architecture frees host CPU resources for tenant applications. DPF also provides automated lifecycle management so that administrators can provision, configure, and update fleets of DPUs directly from OpenShift Container Platform.
In the current release, the supported DPU services are Host-Based Networking (HBN) with OVN-Kubernetes and the DOCA Telemetry Service (DTS).
The NVIDIA DPF Operator is distinct from the Red Hat DPU Operator. The Red Hat DPU Operator manages supported non-NVIDIA DPU devices. NVIDIA BlueField-3 deployments use the DPF Operator and related components.
12.2.1.1. The topology
The DPF deployment creates a specialized networking infrastructure consisting of two distinct cluster planes that work together to deliver hardware-accelerated networking:
- OpenShift Container Platform management cluster
The management cluster runs on the server’s main x86 CPU cores. It hosts the actual business logic, such as AI workloads or enterprise applications.
The management cluster serves as the primary administrative interface and the host cluster that provisions and manages both the fleet of DPUs and user workloads. In a Host Trusted deployment, the worker nodes in this cluster are the physical servers that house the BlueField DPUs.
The management cluster is responsible for the following functions:
- Running user workloads on x86 host processors.
-
Providing a single interface for defining the required state of the infrastructure by using Kubernetes CRDs such as
DPUSet,DPUDeployment, andDPUService. - Driving the discovery of DPUs, flashing BlueField Bootstream (BFB) images, and configuring host-to-DPU networking.
- Coordinating the deployment of services and network flows to the DPU cluster.
- OpenShift Container Platform DPU hosted cluster
The DPU hosted cluster is a dedicated, secondary Kubernetes control plane for managing the fleet of NVIDIA BlueField DPUs. The DPUs function as the worker nodes of this hosted cluster, separate from the bare-metal hosts they are physically attached to.
The DPU hosted cluster runs the following components:
- OVN-Kubernetes running in DPU mode to offload flows.
- DOCA services such as Host-Based Networking (HBN) for BGP routing, DOCA Telemetry Service (DTS) for monitoring, and Firefly for time synchronization.
- System components including NVIDIA IPAM, Multus, and SR-IOV Device Plugins to manage the DPU hardware resources.
12.2.1.2. Example topology
The following diagram illustrates the physical connectivity for a reference lab environment. It serves as a baseline example to demonstrate the core components and their interactions.

12.2.1.3. Architecture characteristics
- Host-managed DPU lifecycle
- In a Host Trusted deployment, the DPU is managed from the host. This model enables cloud operators to manage BlueField-bound services directly from their standard OpenShift Container Platform control plane. DPF automates the discovery and provisioning of DPUs: the DPF Operator detects worker nodes, creates DPU objects, and deploys the DOCA Management Service (DMS) to install the BFB firmware and configure networking between the host and DPU. This approach reduces manual low-level device configuration by using standard Kubernetes APIs and workflows.
- Infrastructure service offloading
- In Host Trusted mode, infrastructure services such as networking, storage, and security are offloaded from the host CPU to the DPU. This frees host CPU resources for applications. The framework routes data center traffic through dedicated ports on the BlueField DPU.
- Kubernetes-native orchestration
- DPF extends the Kubernetes control plane to the DPUs, enabling administrators to deploy and orchestrate NVIDIA DOCA services and third-party applications directly on the BlueField DPU by using familiar Kubernetes constructs. The architecture supports automated rolling updates, scaling, and rollbacks for services without disrupting ongoing operations.
12.2.2. DPF component placement
The software components and Operators run on the management cluster and the DPU hosted cluster to separate workload management from infrastructure acceleration.
12.2.2.1. Management cluster components
The following Operators and services run within the management cluster:
- NVIDIA DPF Operator
- The core Operator that manages DPU services and configurations within the hosted cluster, including DPU provisioning, networking acceleration, and DOCA service orchestration.
- DPF HCP Provisioner Operator
- Automates the hosted control plane’s cluster lifecycle for the DPU nodes.
- MultiCluster Engine (MCE) and hosted control planes
- Provide the control plane and management framework for the DPU hosted cluster.
- Node Feature Discovery (NFD) Operator
- Discovers and labels hardware features on the nodes, including the presence of DPUs.
- MetalLB Operator
- Provides load balancing services for the management cluster.
- GitOps Operator
- Facilitates ArgoCD-based deployment of applications and configurations.
- cert-manager Operator
- Automates the management, issuance, and renewal of TLS certificates within the cluster.
- NVIDIA Maintenance Operator
- Assists in performing maintenance tasks and gracefully draining DPU worker nodes.
- LVM Storage
- Provides persistent ReadWriteMany (RWX) storage required for various components, such as the etcd database of the hosted cluster.
NodeSRIOVDevicePluginConfig- A DPF-managed CRD that configures SR-IOV device plugin pods on worker nodes. It defines VF allocation ranges for management and workload traffic.
- Bare Metal Operator
- Provisions and adds worker nodes with DPUs to the management cluster.
12.2.3. DPF deployment flow overview
The end-to-end deployment process for the NVIDIA DPF Operator follows a series of high-level steps, from management cluster setup through workload verification.
The deployment flow consists of the following steps:
- Management cluster setup: Install and configure a standard OpenShift Container Platform cluster on x86 servers with control-plane nodes only.
- Management cluster configuration: Configure nodes and cluster-level settings, then install and configure the required Operators on the management cluster.
DPF installation: Deploy the DPF Operator, controllers, DPF resources, and DPU service definitions on the management cluster.
ImportantYou must install the DPF Operator before the DPF HCP Provisioner Operator because that Operator requires DPF custom resource definitions (CRDs) such as
DPUCluster,DPUFlavor,DPUDeployment, andDPFOperatorConfig.-
Hosted cluster creation: The DPF HCP Provisioner Operator automates the creation of a hosted DPU cluster by using hosted control planes. The Operator references the
DPUDeploymentresource during ignition generation. - Worker node scale-out and DPU provisioning: When worker nodes with DPUs are added to the cluster, the DPF Operator flashes the DPUs with a Red Hat Enterprise Linux CoreOS (RHCOS) image and configures them to join the hosted cluster as worker nodes.
- Worker node integration: Approve DPU worker node certificate signing requests (CSRs) and configure security context constraint (SCC) bindings on the hosted cluster.
- Service deployment: After the DPU hosted cluster is operational, data plane DPU services and chains are deployed by DPF.
-
Verification: Validate end-to-end connectivity through the DPU data plane by running
pingandnctraffic tests between workload pods and services.
12.2.4. DPF hardware requirements
A DPF v26.4.1 deployment on OpenShift Container Platform 4.22 requires a workstation with CLI tools, a management cluster, at least two worker servers with NVIDIA BlueField-3 DPUs, dedicated management and DPU network switches, and a shared storage server for BFB images.
12.2.4.1. Workstation
A workstation with the following command-line interface (CLI) tools installed:
-
OpenShift CLI (
oc) is installed. -
Helm CLI (
helm) is installed.
12.2.4.2. Control plane nodes
Three nodes form the control plane of the management cluster.
Table 12.2. Control plane node requirements
| Component | Requirement |
|---|---|
| Form factor | Virtual machines or physical servers |
| Memory | 60 GB RAM |
| CPU | 16 vCPUs (Intel or AMD x86_64) |
| Storage | 120 GB NVMe SSD storage, plus an additional 80 GB disk for LVM Storage |
| Networking | 1x 1GbE network interface |
| DPUs | DPUs must not be installed on control plane nodes |
12.2.4.3. Worker nodes
Two physical x86 servers host the NVIDIA BlueField-3 DPUs and act as worker nodes for the management cluster.
Table 12.3. Worker node requirements
| Component | Requirement |
|---|---|
| Memory | 256 GB RAM |
| CPU | 16 cores (Intel or AMD x86_64) |
| Storage | A minimum of 500 GB NVMe SSD storage for the base operating system |
| DPU slot | PCIe Gen 5 x16 slot required. Each server can have multiple DPUs but only one NVIDIA BlueField-3 DPU can be provisioned. |
| BIOS settings | SR-IOV must be enabled. In-Band Manageability Interface must be enabled. |
As part of the installation process, a Linux bridge named br-ex is automatically created on the worker node’s physical management port by using a MachineConfig custom resource to facilitate control-plane traffic from the DPU through the host server.
12.2.4.4. NVIDIA BlueField-3 DPUs
One NVIDIA BlueField-3 DPU is required per worker node.
Table 12.4. BlueField-3 DPU requirements
| Component | Requirement |
|---|---|
| Model | BlueField-3: Content from docs.nvidia.com is not included.B3240, Content from docs.nvidia.com is not included.B3220, or Content from docs.nvidia.com is not included.B3210 |
| Memory | 32 GB. Dual-port DPUs with 32 GB require an external power connection to the x86 server. |
| Networking | Dual 200GbE ports per DPU. Both ports must be connected to the high-speed switch for ECMP routing. |
| Management | The out-of-band management port is not used in this configuration. |
| Operating system and software | The DPUs are provisioned with a BlueField Bootstream File (BFB) that bundles a Red Hat Enterprise Linux CoreOS (RHCOS) base image and the NVIDIA DOCA software stack. The DOCA software stack includes the DPU firmware (version 32.49.1014). |
12.2.5. DPF network infrastructure requirements
A DPF deployment requires a management switch, a high-speed DPU switch, routable management and VTEP networks with reserved service IPs and a VIP, and a consistent MTU across all network components.
12.2.5.1. Switches
- Management switch
- Provides 1GbE connectivity for the control plane and worker node management interfaces.
- High-speed switch
- An NVIDIA SN3700 or similar switch providing 2x 200GbE connectivity per DPU.
12.2.5.2. Connectivity
- All nodes must have full internet access, both from the host out-of-band and DPU high-speed interfaces.
- The management network and the high-speed DPU network, which is the VTEP CIDR, must be routable to each other in both directions. Verify reachability in each direction before you begin the installation, because connectivity that works in only one direction allows the deployment to proceed partway and then fail.
- A dedicated IP address range, which is the VTEP Classless Inter-Domain Routing (CIDR), must be allocated from the high-speed DPU network for DPU service IPs used by HBN and OVN tunnels.
- A Virtual IP (VIP) from the management subnet must be reserved for the hosted DPU cluster control-plane services. The VIP must have a DNS A record.
12.2.5.3. MTU configuration
The deployment supports any maximum transmission unit (MTU) value, provided it is consistent across all network components, including switches, interfaces, and bridges. Common values are 1500 for standard frames and 9000 for jumbo frames. Whichever value you choose must be supported end-to-end by every component in the network path.
The MTU value is set during deployment and cannot be changed later. Ensure consistency across all environment components. When using VMs for control plane nodes, ensure the hypervisor bridge MTU matches the chosen value.
12.2.6. DPF software requirements
A DPF v26.4.1 deployment requires specific versions of OpenShift Container Platform, the OpenShift CLI (oc), hosted control planes, the NVIDIA DPF Operator, and RHCOS BFB, plus cluster-admin privileges on the management cluster.
Table 12.5. Software version requirements
| Component | Required version |
|---|---|
| OpenShift Container Platform | 4.22 |
|
OpenShift CLI ( | 4.22 |
| Hosted control planes OpenShift Container Platform cluster | 4.22 |
| NVIDIA DPF Operator | v26.4.1 |
| RHCOS BFB | 4.22 |
The RHCOS BFB entry refers to the base RHCOS BlueField Bootstream (BFB) image, which is available from the OpenShift Container Platform mirror. For example:
Example BFB image URL
https://rhcos.mirror.openshift.com/art/storage/prod/streams/rhel-10.2/builds/10.2.20260715-0/aarch64/rhcos-10.2.20260715-0-nvidiabluefield.aarch64.bfb
The base BFB is layered with the NVIDIA DOCA stack at provisioning time, and the DOCA services run on the DPUs as separately deployed DPUService resources. The following versions are pinned by this deployment:
Table 12.6. NVIDIA DOCA component versions
| Component | Required version |
|---|---|
| NVIDIA DOCA | 3.4.1 |
| Host-Based Networking (HBN) | 3.4.0 |
| DOCA Telemetry Service (DTS) | 1.25.5 |
| OVN-Kubernetes | Delivered by the DPF OVN-Kubernetes Helm chart |
12.2.6.1. Required command-line tools
Install the following tools on the workstation from which you run the deployment commands:
-
oc— the OpenShift Container Platform CLI, version 4.22. -
helm— required to install the DPF Operator and related Helm charts. -
envsubst— substitutes environment variables into the manifest templates used throughout this documentation (theenvsubst < file.yaml | oc apply -f -pattern). Provided by thegettextpackage. -
jq— parses JSON output during verification and troubleshooting.
12.2.6.2. Access requirements
-
cluster-adminprivileges are required for the management cluster.
12.2.7. Additional resources
- NVIDIA DPF Operator release notes
- Troubleshooting the DPF Operator
- DPU Operator
- Content from networking-docs.nvidia.com is not included.DOCA Platform Framework (DPF) documentation
- Content from networking-docs.nvidia.com is not included.Get Started with DPF Host Trusted
- Content from networking-docs.nvidia.com is not included.DPF OVN-Kubernetes with Host-Based Networking User Guide
- Content from mirror.openshift.com is not included.OpenShift mirror
- Content from helm.sh is not included.Helm installation guide
- Content from networking-docs.nvidia.com is not included.NVIDIA DPF uninstall guide
12.3. Set up the environment for DPF
Before installing the NVIDIA DPF Operator, you must set up the management cluster, configure worker nodes, and install and configure the required Operators.
12.3.1. Set up the management cluster
The management cluster is a standard OpenShift Container Platform 4.22 cluster installed by using the Assisted Installer. This cluster hosts the DPF Operators and the hosted control planes for managing the hosted cluster on DPUs.
Prerequisites
- You have access to the This content is not included.Red Hat Hybrid Cloud Console.
-
You have the OpenShift CLI (
oc) installed.
Procedure
- Go to the This content is not included.Red Hat Hybrid Cloud Console cluster creation page and create a cluster with control-plane nodes only. Select Data center → Assisted Installer.
Optional: Configure jumbo MTU for each control plane node.
- Under Hosts' network configuration in the Assisted Installer wizard, select Static IP, bridges, and bonds.
Set the Static network configurations section per node according to the following template, using the relevant MAC address and interface name for each node:
interfaces: - ipv4: dhcp: true enabled: true mac-address: <xx:xx:xx:xx:xx:xx> mtu: 1500 # Set to 1500 for standard MTU or 9000 for jumbo frames name: <interface-name> state: up type: ethernetNote- You can alternatively configure MTU allocation on the DHCP server that allocates IPs to the control plane nodes.
- If virtual machines are used for control-plane nodes, the MTU must be set on the bridge of the hypervisor used by the VMs.
- When using MTU 9000, ensure the switch ports that connect the cluster’s control-plane nodes are set to handle jumbo frames.
Select the following operators to install with the cluster:
- Storage → Logical Volume Manager Storage
- Platform Operations & Lifecycle → MultiCluster Engine
- Scheduling → Node Feature Discovery
- Click Add hosts to add hosts to the cluster. Only control plane nodes are required at this stage.
-
After the installation completes, download the
KUBECONFIGfile and save it asmgmt-kubeconfig.
Verification
Set the
KUBECONFIGenvironment variable:$ export KUBECONFIG="$(pwd)/mgmt-kubeconfig"
Verify that all nodes are in a
Readystate:$ oc get nodes
12.3.2. Configure worker nodes for DPU operation
You must deploy the dpu-worker-config Helm chart to configure worker nodes with DPUs before adding those nodes to the management cluster. The dpu-worker-config Helm chart creates the MachineConfigPool, dpu-worker-configuration MachineConfig, and other required resources that configure the bridge, OVS services, and IP routing on worker nodes. The MachineConfigPool groups DPU-equipped worker nodes so that the Machine Config Operator can apply DPU-specific configurations to them.
The MachineConfig resource performs several configuration tasks required by DPF:
-
Bridge Configuration: Creates a
br-exbridge interface that enables communication between the DPU and the hosted cluster control plane running on the management cluster. This name must match thedpuNodeOOBBridgeNamevalue in theDPFOperatorConfigresource, or DPU provisioning fails. For more information refer to Content from networking-docs.nvidia.com is not included.DPF Operator Prerequisites. - OVS Service Management: Disables OpenShift’s default OVS services on x86 worker nodes. This is required for OVN-Kubernetes DPU Host mode operation, where networking functions are offloaded to the DPU rather than running on the host CPU.
- IP Rules Configuration: Sets routing rules required for pod-to-host control-plane traffic.
Prerequisites
-
You have access to the cluster as a user with the
cluster-adminrole. -
You have installed the OpenShift CLI (
oc). -
The Helm CLI (
helm) is installed on your workstation. -
You have a pull secret file that includes credentials for
registry.redhat.io. Helm reads its registry credentials from this file, which is separate from the container runtime configuration.
Procedure
Set the
OPENSHIFT_PULL_SECRETenvironment variable to the path of your pull secret file:$ export OPENSHIFT_PULL_SECRET="/root/pull-secret.txt"
Deploy the
dpu-worker-configHelm chart to create the worker node MachineConfig:$ helm upgrade --install dpu-worker-config \ oci://registry.redhat.io/dpu-kit-for-nvidia/dpu-worker-config-chart \ --version 4.22.0 \ --registry-config "${OPENSHIFT_PULL_SECRET}" \ --namespace dpf-hcp-provisioner-system \ --create-namespace \ --disable-openapi-validation
Verification
Verify that the
dpu-worker-configHelm release is deployed:$ helm list -n dpf-hcp-provisioner-system
Verify that the
MachineConfigPoolwas created automatically:$ oc get mcp worker-dpu
Example output
NAME CONFIG UPDATED UPDATING DEGRADED MACHINECOUNT READYMACHINECOUNT UPDATEDMACHINECOUNT DEGRADEDMACHINECOUNT AGE worker-dpu rendered-worker-dpu-b4a44cc606c2ffcf07067d1e943a8758 True False False 0 0 0 0 2m
Verify that the
dpu-worker-configurationMachineConfig is created:$ oc get machineconfig dpu-worker-configuration
Example output
NAME GENERATEDBYCONTROLLER IGNITIONVERSION AGE dpu-worker-configuration 3.2.0 2m
The Machine Config Operator automatically reboots worker nodes to apply DPU-specific configurations after nodes with the worker-dpu label are added to the cluster.
12.3.3. Create the DPF namespace
You must create a dedicated namespace for the DPF Operator and its components before installing the Operator.
Prerequisites
-
You have access to the cluster as a user with the
cluster-adminrole. -
You have installed the OpenShift CLI (
oc).
Procedure
Create the
dpf-operator-systemnamespace:$ oc create namespace dpf-operator-system
Verification
Verify that the namespace was created:
$ oc get namespace dpf-operator-system
12.3.4. Required Operators
Before you install the DPF Operator, you must install the cert-manager Operator for Red Hat OpenShift, MetalLB Operator, Red Hat OpenShift GitOps, and NVIDIA Maintenance Operator.
The multicluster engine Operator and the Node Feature Discovery Operator can be installed during management cluster creation by using the Assisted Installer. After installation, configure those Operators, MetalLB, GitOps, and the Cluster Network Operator as described in "Configure the required Operators".
12.3.4.1. Install the NVIDIA Maintenance Operator
The NVIDIA Maintenance Operator assists in performing maintenance tasks and gracefully draining DPU worker nodes. You install this operator by using Helm.
Prerequisites
-
You have access to the cluster as a user with the
cluster-adminrole. -
You have installed the OpenShift CLI (
oc). -
You have installed the Helm CLI (
helm).
Procedure
Create a Helm values file named
maintenance-operator-values.yamlwith the following content:operatorConfig: deploy: true maxParallelOperations: 60% operator: affinity: nodeAffinity: requiredDuringSchedulingIgnoredDuringExecution: nodeSelectorTerms: - matchExpressions: - key: "node-role.kubernetes.io/master" operator: Exists - matchExpressions: - key: "node-role.kubernetes.io/control-plane" operator: Exists tolerations: - key: node-role.kubernetes.io/master operator: Exists effect: NoSchedule - key: node-role.kubernetes.io/control-plane operator: Exists effect: NoScheduleInstall the Operator by using Helm:
$ helm upgrade --install maintenance-operator oci://ghcr.io/mellanox/maintenance-operator-chart \ --namespace dpf-operator-system \ --create-namespace \ --disable-openapi-validation \ --version 0.3.0 \ --values maintenance-operator-values.yaml \ --wait
Verification
Verify that the Operator pod is running:
$ oc get pods -n dpf-operator-system
Example output
maintenance-operator-585767f779-kps9c 1/1 Running 0 2d23h
Additional resources
- Installing the cert-manager Operator for Red Hat OpenShift
- Installing the MetalLB Operator
- This page is not included, but the link has been rewritten to point to the nearest parent document.Installing Red Hat OpenShift GitOps
- Content from networking-docs.nvidia.com is not included.DPF Operator prerequisites
12.3.5. Configure the required Operators
After the required Operators are installed, configure Node Feature Discovery, MetalLB, GitOps, and Cluster Network Operator for the DPF environment. This procedure also verifies that the multicluster engine and hosted control planes components are ready.
Prerequisites
-
You have access to the cluster as a user with the
cluster-adminrole. -
You have installed the OpenShift CLI (
oc). - You have installed the cert-manager Operator for Red Hat OpenShift, MetalLB Operator, Red Hat OpenShift GitOps, and NVIDIA Maintenance Operator.
- You have installed the Logical Volume Manager Storage Operator, multicluster engine operator, and the Node Feature Discovery Operator. You can install them by using the Assisted Installer during cluster creation. For manual installation, see This content is not included.Installing multicluster engine operator and ensure that the hosted control planes component is enabled.
Procedure
Define the cluster variables used by Node Feature Discovery:
$ export CLUSTER_NAME="doca-mgmt" $ export BASE_DOMAIN="example.com" $ export HOST_CLUSTER_API="api.${CLUSTER_NAME}.${BASE_DOMAIN}"where:
CLUSTER_NAME- Specifies the management cluster name.
BASE_DOMAIN- Specifies the management cluster base domain.
HOST_CLUSTER_API- Specifies the management cluster API endpoint.
Create a file named
nfd-instance.yamlwith the followingNodeFeatureDiscoveryresource definition:apiVersion: nfd.openshift.io/v1 kind: NodeFeatureDiscovery metadata: name: nfd-instance namespace: openshift-nfd spec: operand: workerEnvs: - name: KUBERNETES_SERVICE_HOST value: $HOST_CLUSTER_API - name: KUBERNETES_SERVICE_PORT value: "6443" workerConfig: configData: | sources: pci: deviceClassWhitelist: - "0200" - "03" - "12" - "0207" deviceLabelFields: - "vendor" - "device" - "class"Apply the file by using
envsubstto substitute the environment variables:$ envsubst < nfd-instance.yaml | oc apply -f -
Create a file named
nfd-rule.yamlwith the followingNodeFeatureRuleresource definition to detect worker nodes with DPUs and label them with adpu-enabledlabel:apiVersion: nfd.openshift.io/v1alpha1 kind: NodeFeatureRule metadata: name: dpu-detection-rule namespace: openshift-nfd spec: rules: - labels: dpu-enabled: "" matchFeatures: - feature: pci.device matchExpressions: device: op: In value: - a2d6 - a2dc vendor: op: In value: - 15b3 name: DPU-detection-ruleApply the file:
$ oc apply -f nfd-rule.yaml
Ensure that the MetalLB Operator
Subscriptionschedules Operator pods on control-plane nodes. When you install the MetalLB Operator, include the followingspec.configsettings, or patch an existingSubscriptionto add them:apiVersion: operators.coreos.com/v1alpha1 kind: Subscription metadata: name: metallb-operator namespace: openshift-operators spec: channel: "stable" name: metallb-operator source: redhat-operators sourceNamespace: openshift-marketplace installPlanApproval: Automatic config: tolerations: - key: "node-role.kubernetes.io/control-plane" operator: "Exists" effect: "NoSchedule" affinity: nodeAffinity: requiredDuringSchedulingIgnoredDuringExecution: nodeSelectorTerms: - matchExpressions: - key: "node-role.kubernetes.io/control-plane" operator: "Exists"Create a file named
metallb-config.yamlwith the followingMetalLBresource definition:apiVersion: metallb.io/v1beta1 kind: MetalLB metadata: name: metallb namespace: openshift-operators spec: nodeSelector: node-role.kubernetes.io/control-plane: "" speakerTolerations: - key: node-role.kubernetes.io/control-plane operator: Exists effect: NoScheduleApply the MetalLB resource file:
$ oc apply -f metallb-config.yaml
Ensure that the Red Hat OpenShift GitOps
Subscriptionincludes the DPF-required environment variables. When you install the Operator, set the followingspec.config.envvalues, or patch an existingSubscriptionto add them so that Argo CD can manage thedpf-operator-systemnamespace:apiVersion: operators.coreos.com/v1alpha1 kind: Subscription metadata: name: openshift-gitops-operator namespace: openshift-gitops-operator spec: channel: gitops-1.21 config: env: - name: ARGOCD_CLUSTER_CONFIG_NAMESPACES value: "openshift-gitops,dpf-operator-system" - name: CONTROLLER_CLUSTER_ROLE value: "cluster-admin" - name: SERVER_CLUSTER_ROLE value: "cluster-admin" installPlanApproval: Automatic name: openshift-gitops-operator source: redhat-operators sourceNamespace: openshift-marketplace startingCSV: openshift-gitops-operator.v1.21.3Create a file named
argocd-instance.yamlwith the followingArgoCDresource definition:apiVersion: argoproj.io/v1beta1 kind: ArgoCD metadata: name: argocd namespace: dpf-operator-system spec: nodePlacement: nodeSelector: node-role.kubernetes.io/control-plane: "" tolerations: - key: node-role.kubernetes.io/master operator: Exists effect: NoSchedule - key: node-role.kubernetes.io/control-plane operator: Exists effect: NoSchedule server: route: enabled: true controller: {} repo: {} applicationSet: enabled: false resourceExclusions: | - apiGroups: - packages.operators.coreos.com kinds: - PackageManifest sso: provider: dex dex: openShiftOAuth: true notifications: enabled: falseApply the Argo CD file:
$ oc apply -f argocd-instance.yaml
Wait for the ArgoCD Redis deployment to be ready:
$ oc wait deployment argocd-redis -n dpf-operator-system \ --for=condition=Available --timeout=120s
Enable global IP forwarding on the OVN-Kubernetes configuration:
This command enables IP packet forwarding between different networks managed by OVN-Kubernetes.
$ oc patch network.operator.openshift.io cluster --type=merge -p \ '{"spec":{"defaultNetwork":{"ovnKubernetesConfig":{"gatewayConfig":{"ipForwarding":"Global"}}}}}'
Verification
Verify that the
MultiClusterEngineinstance is created:$ oc get multiclusterengine mce
Example output
NAME STATUS AGE CURRENTVERSION DESIREDVERSION MESSAGE mce Available 4m58s 2.17.2 2.17.2 All components available
Verify that the hosted control planes component is enabled:
$ oc get multiclusterengine mce -o jsonpath='{.spec.overrides.components[?(@.name=="hypershift")].enabled}{"\n"}'NoteIf the previous command returns
falseor an empty result, hosted control planes is not enabled and DPU provisioning fails.To continue, you must enable the
hypershiftcomponent on theMultiClusterEngineresource. In current multicluster engine Operator versions the component is namedhypershift; earlier versions usehypershift-preview.If the result is empty, no
hypershiftentry exists. Run the following command to add the entry and enable it:$ oc patch mce multiclusterengine --type=json \ -p='[{"op":"add","path":"/spec/overrides/components/-","value":{"name":"hypershift","enabled":true}}]'If the result is
false, an entry exists but is disabled. Edit the resource and set thehypershiftcomponent toenabled: true:$ oc edit multiclusterengine mce
ImportantDo not use
oc patch --type=mergeto enable the component, because a merge patch replaces the entirecomponentsarray and removes the other components. Use the JSONaddpatch when no entry exists, oroc editwhen an entry exists but is disabled.Verify that the
NodeFeatureDiscoveryinstance andNodeFeatureRuleare configured:$ oc get nodefeaturediscovery,nodefeaturerule -n openshift-nfd
Verify that the
MetalLBinstance was created:$ oc get metallb -n openshift-operators
Verify that the Argo CD pods are running:
$ oc get pods -n dpf-operator-system -l app.kubernetes.io/part-of=argocd
Verify that IP forwarding is set to
Global:$ oc get network.operator.openshift.io cluster -o jsonpath='{.spec.defaultNetwork.ovnKubernetesConfig.gatewayConfig.ipForwarding}'Example output
Global
12.4. Install and configure the DPF Operator
After setting up the environment, install the NVIDIA DPF Operator and create the required DPF resources and DPU services.
You must install the DPF Operator before the DPF HCP Provisioner Operator because that Operator requires DPF CRDs such as DPUCluster, DPUFlavor, DPUDeployment, and DPFOperatorConfig.
12.4.1. DPF Operator installation environment variables
Set the following required environment variables before you install and configure the DPF Operator on OpenShift Container Platform. The values of these variables are used in multiple DPF Operator installation and configuration procedures.
Table 12.7. DPF Operator environment variables
| Variable | Description | Example value |
|---|---|---|
|
| The name of the management cluster. |
|
|
| The base domain for the management cluster. |
|
|
|
The API server hostname of the management cluster. Derived from |
|
|
| The version tag for the DPF Operator Helm chart. |
|
|
| The port number of the hosted cluster API server. |
|
|
|
The CIDR range for the VTEP (tunnel endpoint) network. Used as the OVN |
|
|
|
The CIDR range of the subnet where the DPU host nodes reside. Used as the OVN |
|
|
|
Number of SR-IOV VFs per physical function. Sets |
|
|
| The OCI chart URL for the OVN-Kubernetes Helm chart. |
|
|
| The version of the OVN-Kubernetes Helm chart. |
|
|
|
The MTU value for OVN-Kubernetes overlay networking. Set to |
|
|
| The download URL for the BlueField Bootstream File image used to provision DPUs. |
|
|
|
The local file name for the BFB image, which is typically the base name of |
|
|
| The name of the hosted cluster running on the DPUs. |
|
|
| The Helm chart registry URL for the DPF Operator. |
|
|
|
The MTU value for the node network interfaces. Use |
|
|
| The pod CIDR for the Flannel network in the hosted cluster. Required for OpenShift Container Platform 4.22 and later. |
|
12.4.2. Install the DPF Operator
You can install the DPF Operator by using Helm to deploy the Operator into the dpf-operator-system namespace on your management cluster.
You must install the DPF Operator before the DPF HCP Provisioner Operator because that Operator requires the following DPF custom resource definitions to be available: DPUCluster, DPUFlavor, DPUDeployment, and DPFOperatorConfig.
Prerequisites
-
You have access to the management cluster as a user with the
cluster-adminrole. -
You have installed the
ocCLI. -
You have installed the
helmCLI. - You have set the DPF Operator environment variables. For details, see "DPF Operator installation environment variables".
Procedure
Add the DPF Helm repository and update the local cache:
$ helm repo add --force-update dpf-repository ${REGISTRY}$ helm repo update
Install the DPF Operator by using Helm:
$ helm upgrade --install dpf-operator dpf-repository/dpf-operator \ --namespace dpf-operator-system \ --version "${TAG}" \ --set kamajiEtcdDefrag.enabled=false \ --set isOpenshift=true \ --set enableNodeFeatureRules=false \ --wait
Verification
Verify that the Operator controller manager deployment has rolled out successfully:
$ oc rollout status deployment --namespace dpf-operator-system dpf-operator-controller-manager
Example output
deployment "dpf-operator-controller-manager" successfully rolled out
Verify that all pods in the
dpf-operator-systemnamespace are ready:$ oc wait --for=condition=ready --namespace dpf-operator-system pods --all
Example output
pod/argocd-application-controller-0 condition met pod/argocd-dex-server-6dd56c8469-bhsq4 condition met pod/argocd-redis-b4f94bb8d-wr86b condition met pod/argocd-repo-server-96765f997-79k9q condition met pod/argocd-server-648c7ff85f-7frtg condition met pod/dpf-operator-controller-manager-7bf9744c5f-cwrgc condition met pod/maintenance-operator-585767f779-8k2lx condition met
12.4.3. Create the DPFOperatorConfig custom resource
Create a DPFOperatorConfig custom resource to configure the DPF Operator components, including the provisioning controller, static cluster manager, and SR-IOV device plugin controller.
Prerequisites
- You have installed the DPF Operator.
- You have set the DPF Operator environment variables. For details, see "DPF Operator installation environment variables".
Procedure
Create a file named
dpfoperatorconfig.yamlwith the following content:NoteMTU Configuration: Set
NODES_MTUto1500for standard MTU environments or9000for jumbo frame environments. This value must be consistent across:- Assisted Installer host configuration
- DPFOperatorConfig networking section (this step)
- DPUServiceNAD configuration
Choose based on your network infrastructure capabilities.
apiVersion: operator.dpu.nvidia.com/v1alpha1 kind: DPFOperatorConfig metadata: name: dpfoperatorconfig namespace: dpf-operator-system spec: kamajiClusterManager: disable: true multus: disable: true cniInstaller: disable: true networking: controlPlaneMTU: $NODES_MTU # management/OOB MTU (= NODES_MTU: 1500 standard, 9000 jumbo) highSpeedMTU: $NODES_MTU # high-speed fabric MTU (= NODES_MTU; must match controlPlaneMTU) dpuNodeOOBBridgeName: br-ex # OOB bridge for DPU provisioning; br-ex on OpenShift overrides: dpuCNIBinPath: /var/lib/cni/bin/ dpuCNIPath: /run/multus/cni/net.d/ dpuOpenvSwitchSystemSharedLib64Path: /lib64 flannelSkipCNIConfigInstallation: false kubernetesAPIServerPort: $TARGETCLUSTER_API_SERVER_PORT kubernetesAPIServerVIP: $HOST_CLUSTER_API dpuLinkerCachePath: /etc/ld.so.cache dpuOptLibraryPath: /usr/opt provisioningController: enableDynamicBFCFGTemplates: true hostAgentDNSPolicy: Default dmsTimeout: 900 nodeSRIOVDevicePluginController: devicePlugin: defaultResourcePrefix: openshift.io disable: false replicas: 1 staticClusterManager: disable: false dpuServiceController: disableHostNetworkReadyNoExecuteTaints: false flannel: podCIDR: $FLANNEL_POD_CIDRApply the resource file:
$ envsubst < dpfoperatorconfig.yaml | oc apply -f -
Verification
Verify that the provisioning controller manager deployment has rolled out:
$ oc rollout status deployment --namespace dpf-operator-system dpf-provisioning-controller-manager
Example output
deployment "dpf-provisioning-controller-manager" successfully rolled out
Verify that the DPU service controller manager deployment has rolled out:
$ oc rollout status deployment --namespace dpf-operator-system dpuservice-controller-manager
Example output
deployment "dpuservice-controller-manager" successfully rolled out
Verify that all Operator deployments in the
dpf-operator-systemnamespace have rolled out:NoteYou might need to run this command more than once, because the deployments become available at different times as the Operator reconciles its resources.
$ oc rollout status deployment --namespace dpf-operator-system
Optional: List the pods in the
dpf-operator-systemnamespace to review their status:$ oc get pods -n dpf-operator-system
Example output
NAME READY STATUS RESTARTS AGE argocd-application-controller-0 1/1 Running 0 64m argocd-dex-server-9dd99cc6c-pkl6j 1/1 Running 0 64m argocd-redis-6749d85f98-mw9rc 1/1 Running 0 64m argocd-repo-server-5fd79d655c-9rl26 1/1 Running 0 64m argocd-server-5cc4f69c45-hzgm9 1/1 Running 0 64m bfb-registry 1/1 Running 0 98s dpf-nodesriovdeviceplugin-controller-7c7bb889f6-xk6nm 1/1 Running 0 107s dpf-operator-controller-manager-6969c6d8bc-4njxd 1/1 Running 0 4m54s dpf-provisioning-controller-manager-54b6bdc57f-69lr7 1/1 Running 0 109s dpf-provisioning-controller-manager-54b6bdc57f-fg9f6 1/1 Running 0 109s dpuservice-controller-manager-5d9c4f6f67-wsdzt 1/1 Running 0 108s maintenance-operator-68c794b549-pp2dp 1/1 Running 0 74m static-cm-controller-manager-745c8fd7d5-n8d2z 1/1 Running 0 110s
12.4.4. Create the NodeSRIOVDevicePluginConfig custom resource
You can create a NodeSRIOVDevicePluginConfig custom resource to define how SR-IOV virtual functions on the management cluster worker nodes are allocated to DPF components.
Prerequisites
- You have installed the DPF Operator.
-
You have created the
DPFOperatorConfigresource.
Procedure
Create a file named
nodesriovdevicepluginconfig.yamlwith the following content:apiVersion: noderesources.dpu.nvidia.com/v1alpha1 kind: NodeSRIOVDevicePluginConfig metadata: name: bf3-vfs namespace: dpf-operator-system spec: devicePluginResources: - name: bf3-p0-vfs-mgmt type: vf ranges: - pfIndex: 0 start: 1 end: 1 - name: bf3_vfs type: vf options: isRdma: true ranges: - pfIndex: 0 start: 2 end: 45 - pfIndex: 1 start: 0 end: 45where:
bf3-p0-vfs-mgmt-
Reserves VF index
1on PF0 for DPU management connectivity. bf3_vfs-
Allocates VF indices
2-45on PF0 and VF indices0-45on PF1 for workload traffic with RDMA enabled. pfIndex-
The
pfIndexvalues refer to the first (0) and second (1) physical functions of the BlueField-3 DPU.
Apply the resource file:
$ oc apply -f nodesriovdevicepluginconfig.yaml
Verification
Verify that the
NodeSRIOVDevicePluginConfigresource is created:$ oc get nodesriovdevicepluginconfig -n dpf-operator-system
Example output
bf3-vfs 30s
12.4.5. Create the DPUFlavor custom resource
You can create a DPUFlavor custom resource to define the DPU configuration, including NVConfig parameters, kernel arguments, hugepages settings, and the OVS initialization script. The DPUFlavor also supports an optional configFiles field for custom DPU configuration files.
The nvconfig section contains BlueField-3 firmware parameters that the DPU agent applies by using mlxconfig during provisioning. If any parameter differs from the current firmware configuration, the provisioning controller triggers a system-level reset so that the changes take effect. The following parameters are required for DPF operation:
Table 12.8. Required BlueField-3 NVConfig parameters
| Parameter | Value | Description |
|---|---|---|
|
|
|
Switches the BlueField-3 to DPU mode where the ARM cores are active. A value of |
|
|
| Enables SR-IOV on both physical functions. The host agent creates Virtual Functions (VFs) that carry tenant traffic between the host and the DPU. |
|
| Variable |
Number of VFs per physical function. Set this value by using the |
|
|
|
Sets both ports to Ethernet mode. DPF requires Ethernet. InfiniBand ( |
If BlueField-3 already has the correct values, the DPU agent reports that no action is required and does not trigger a reset.
Prerequisites
- You have installed the DPF Operator.
-
You have created the
DPFOperatorConfigresource. - You have set the DPF Operator environment variables. For details, see "DPF Operator installation environment variables".
Procedure
Create a file named
dpuflavor.yamlfor your MTU configuration and apply it.For Standard MTU (1500):
apiVersion: provisioning.dpu.nvidia.com/v1alpha1 kind: DPUFlavor metadata: name: hbn-ovnk namespace: dpf-operator-system annotations: provisioning.dpu.nvidia.com/skip-bfcfg-size-check: "" spec: grub: kernelParameters: - console=hvc0 - console=ttyAMA0 - earlycon=pl011,0x13010000 - iommu.passthrough=1 - cgroup_no_v1=net_prio,net_cls - hugepagesz=2048kB - hugepages=250 nvconfig: - device: '*' parameters: - PF_BAR2_ENABLE=0 - PER_PF_NUM_SF=1 - PF_TOTAL_SF=20 - PF_SF_BAR_SIZE=10 - NUM_PF_MSIX_VALID=0 - PF_NUM_PF_MSIX_VALID=1 - PF_NUM_PF_MSIX=228 - INTERNAL_CPU_MODEL=1 - INTERNAL_CPU_OFFLOAD_ENGINE=0 - SRIOV_EN=1 - NUM_OF_VFS=$NUM_VFS - LAG_RESOURCE_ALLOCATION=1 - LINK_TYPE_P1=ETH - LINK_TYPE_P2=ETH ovs: rawConfigScript: | #!/bin/bash set -e _ovs-vsctl() { ovs-vsctl --timeout 15 "$@" } restart_ovs=false _ovs-get-other-config() { _ovs-vsctl --if-exists get Open_vSwitch . "other_config:$1" 2>/dev/null | tr -d '"' } _ovs-set-other-config() { if [ "$(_ovs-get-other-config "$1")" != "$2" ]; then _ovs-vsctl set Open_vSwitch . "other_config:$1=$2" restart_ovs=true fi } _ovs-remove-other-config() { if [ -n "$(_ovs-get-other-config "$1")" ]; then _ovs-vsctl remove Open_vSwitch . other_config "$1" restart_ovs=true fi } _ovs-set-other-config doca-init true _ovs-set-other-config dpdk-max-memzones 50000 _ovs-set-other-config hw-offload true _ovs-set-other-config pmd-quiet-idle true _ovs-set-other-config max-idle 20000 _ovs-set-other-config max-revalidator 5000 _ovs-set-other-config doca-congestion-threshold 60 _ovs-set-other-config flow-limit 500000 _ovs-set-other-config hw-offload-ct-unidir-udp-enabled true _ovs-remove-other-config default-datapath-type if [ "$restart_ovs" = true ]; then if systemctl list-unit-files openvswitch-switch.service &>/dev/null; then systemctl restart openvswitch-switch elif systemctl list-unit-files openvswitch.service &>/dev/null; then systemctl restart openvswitch fi fi _ovs-vsctl --may-exist add-br br-sfc _ovs-vsctl set bridge br-sfc datapath_type=netdev _ovs-vsctl set bridge br-sfc fail_mode=secure _ovs-vsctl --if-exists del-br br-hbn _ovs-vsctl --may-exist add-br br-hbn _ovs-vsctl set bridge br-hbn datapath_type=netdev _ovs-vsctl set bridge br-hbn fail_mode=secure _ovs-vsctl --may-exist add-port br-sfc p0 _ovs-vsctl set Interface p0 type=dpdk _ovs-vsctl set Interface p0 mtu_request=9216 _ovs-vsctl set Port p0 external_ids:dpf-type=physical # Activate DOCA for OVNK _ovs-vsctl set Open_vSwitch . external-ids:ovn-bridge-datapath-type=netdev # setup ovnkube managed bridge, br-dpu (this corresponds to br-ex on ovnk docs) _ovs-vsctl --may-exist add-br br-dpu _ovs-vsctl br-set-external-id br-dpu bridge-id br-dpu _ovs-vsctl br-set-external-id br-dpu bridge-uplink pbrdputobrovn _ovs-vsctl set bridge br-dpu datapath_type=netdev _ovs-vsctl --may-exist add-port br-dpu pf0hpf _ovs-vsctl set Interface pf0hpf type=dpdk # Create OVS bridge (br-ovn) in between the SC managed bridge and OVNK _ovs-vsctl --may-exist add-br br-ovn _ovs-vsctl set bridge br-ovn datapath_type=netdev _ovs-vsctl --may-exist add-port br-ovn pbrovntobrdpu _ovs-vsctl --may-exist add-port br-dpu pbrdputobrovn # Patch br-ovn and br-dpu together _ovs-vsctl set Interface pbrovntobrdpu type=patch options:peer=pbrdputobrovn _ovs-vsctl set Interface pbrdputobrovn type=patch options:peer=pbrovntobrdpuFor Jumbo frames (MTU 9000):
apiVersion: provisioning.dpu.nvidia.com/v1alpha1 kind: DPUFlavor metadata: name: hbn-ovnk namespace: dpf-operator-system annotations: provisioning.dpu.nvidia.com/skip-bfcfg-size-check: "" spec: grub: kernelParameters: - console=hvc0 - console=ttyAMA0 - earlycon=pl011,0x13010000 - iommu.passthrough=1 - cgroup_no_v1=net_prio,net_cls - hugepagesz=2048kB - hugepages=250 nvconfig: - device: '*' parameters: - PF_BAR2_ENABLE=0 - PER_PF_NUM_SF=1 - PF_TOTAL_SF=20 - PF_SF_BAR_SIZE=10 - NUM_PF_MSIX_VALID=0 - PF_NUM_PF_MSIX_VALID=1 - PF_NUM_PF_MSIX=228 - INTERNAL_CPU_MODEL=1 - INTERNAL_CPU_OFFLOAD_ENGINE=0 - SRIOV_EN=1 - NUM_OF_VFS=$NUM_VFS - LAG_RESOURCE_ALLOCATION=1 - NUM_VF_MSIX=30 - LINK_TYPE_P1=ETH - LINK_TYPE_P2=ETH ovs: rawConfigScript: | #!/bin/bash set -e _ovs-vsctl() { ovs-vsctl --timeout 15 "$@" } restart_ovs=false _ovs-get-other-config() { _ovs-vsctl --if-exists get Open_vSwitch . "other_config:$1" 2>/dev/null | tr -d '"' } _ovs-set-other-config() { if [ "$(_ovs-get-other-config "$1")" != "$2" ]; then _ovs-vsctl set Open_vSwitch . "other_config:$1=$2" restart_ovs=true fi } _ovs-remove-other-config() { if [ -n "$(_ovs-get-other-config "$1")" ]; then _ovs-vsctl remove Open_vSwitch . other_config "$1" restart_ovs=true fi } _ovs-set-other-config doca-init true _ovs-set-other-config dpdk-max-memzones 50000 _ovs-set-other-config hw-offload true _ovs-set-other-config pmd-quiet-idle true _ovs-set-other-config max-idle 20000 _ovs-set-other-config max-revalidator 5000 _ovs-set-other-config doca-congestion-threshold 60 _ovs-set-other-config flow-limit 500000 _ovs-set-other-config hw-offload-ct-unidir-udp-enabled true _ovs-remove-other-config default-datapath-type if [ "$restart_ovs" = true ]; then if systemctl list-unit-files openvswitch-switch.service &>/dev/null; then systemctl restart openvswitch-switch elif systemctl list-unit-files openvswitch.service &>/dev/null; then systemctl restart openvswitch fi fi _ovs-vsctl --may-exist add-br br-sfc _ovs-vsctl set bridge br-sfc datapath_type=netdev _ovs-vsctl set bridge br-sfc fail_mode=secure _ovs-vsctl --if-exists del-br br-hbn _ovs-vsctl --may-exist add-br br-hbn _ovs-vsctl set bridge br-hbn datapath_type=netdev _ovs-vsctl set bridge br-hbn fail_mode=secure _ovs-vsctl --may-exist add-port br-sfc p0 _ovs-vsctl set Interface p0 type=dpdk _ovs-vsctl set Interface p0 mtu_request=9216 _ovs-vsctl set Port p0 external_ids:dpf-type=physical # Activate DOCA for OVNK _ovs-vsctl set Open_vSwitch . external-ids:ovn-bridge-datapath-type=netdev # setup ovnkube managed bridge, br-dpu (this corresponds to br-ex on ovnk docs) _ovs-vsctl --may-exist add-br br-dpu _ovs-vsctl br-set-external-id br-dpu bridge-id br-dpu _ovs-vsctl br-set-external-id br-dpu bridge-uplink pbrdputobrovn _ovs-vsctl set bridge br-dpu datapath_type=netdev _ovs-vsctl set Interface br-dpu mtu_request=9000 _ovs-vsctl --may-exist add-port br-dpu pf0hpf _ovs-vsctl set Interface pf0hpf type=dpdk # Create OVS bridge (br-ovn) in between the SC managed bridge and OVNK _ovs-vsctl --may-exist add-br br-ovn _ovs-vsctl set bridge br-ovn datapath_type=netdev _ovs-vsctl set Interface br-ovn mtu_request=9000 _ovs-vsctl --may-exist add-port br-ovn pbrovntobrdpu _ovs-vsctl --may-exist add-port br-dpu pbrdputobrovn # Patch br-ovn and br-dpu together _ovs-vsctl set Interface pbrovntobrdpu type=patch options:peer=pbrdputobrovn _ovs-vsctl set Interface pbrdputobrovn type=patch options:peer=pbrovntobrdpu
Apply the resource file:
$ envsubst < dpuflavor.yaml | oc apply -f -
Verification
Verify that the
DPUFlavorresource is created:$ oc get dpuflavor -n dpf-operator-system
12.4.6. Create the BFB resource
You can create a BFB custom resource to define the DPU image, known as a BlueField Bootstream File, that is downloaded and placed on shared storage for DPU provisioning.
Prerequisites
- You have installed the DPF Operator.
-
You have created the
DPFOperatorConfigresource. - You have set the DPF Operator environment variables. For details, see "DPF Operator installation environment variables".
Procedure
Create a file named
bfb.yamlwith the following content:apiVersion: provisioning.dpu.nvidia.com/v1alpha1 kind: BFB metadata: name: bf-bundle namespace: dpf-operator-system spec: fileName: $BFB_FILENAME url: $BFB_URL versions: atf: 4.15.0-4-g419fbf393 bsp: 4.15.0.13998 doca: 3.4.1 uefi: 4.15.0-19-g37c6f5adb2Set the
BFB_FILENAMEenvironment variable to the file name of the BFB image, which is the base name ofBFB_URL:$ export BFB_FILENAME=$(basename "$BFB_URL")
Apply the resource file:
$ envsubst < bfb.yaml | oc apply -f -
Verification
Verify that the BFB image phase is
Ready:$ oc get bfb -n dpf-operator-system bf-bundle
Example output
NAME PHASE AGE bf-bundle Ready 3m
12.4.7. Create the DPUDeployment custom resource
You can create a DPUDeployment custom resource as the main orchestration object that connects DPU services with specific BFB images and DPU flavors. The DPUDeployment defines DPU sets for DPU provisioning and configures service chains to deploy services across DPUs.
Prerequisites
- You have installed the DPF Operator.
-
You have created the
DPFOperatorConfigresource. -
You have created the
NodeSRIOVDevicePluginConfigresource. -
You have created the
DPUFlavorresource. -
You have created the
BFBresource and it is in theReadyphase.
Procedure
Create a file named
dpudeployment.yamlwith the following content:apiVersion: svc.dpu.nvidia.com/v1alpha1 kind: DPUDeployment metadata: name: dpudeployment namespace: dpf-operator-system spec: dpus: nodeEffect: drain: true dpuSetStrategy: type: RollingUpdate bfb: bf-bundle flavor: hbn-ovnk dpuSets: - nameSuffix: "dpuset1" dpuNodeSelector: matchLabels: feature.node.kubernetes.io/dpu-enabled: "" dpuAnnotations: noderesources.dpu.nvidia.com/nodesriovdevicepluginconfig: bf3-vfs services: hbn: serviceTemplate: hbn serviceConfiguration: hbn ovn: serviceTemplate: ovn serviceConfiguration: ovn doca-telemetry-service: serviceTemplate: doca-telemetry-service serviceConfiguration: doca-telemetry-service serviceChains: switches: - ports: - serviceInterface: matchLabels: uplink: p0 - service: name: hbn interface: p0_if - ports: - serviceInterface: matchLabels: uplink: p1 - service: name: hbn interface: p1_if - ports: - serviceInterface: matchLabels: port: ovn - service: name: hbn interface: pf2dpu2_ifApply the resource file:
$ oc apply -f dpudeployment.yaml
Verification
Verify the
DPUDeploymentstate:$ oc get DPUDeployment -n dpf-operator-system
Example output
NAME READY PHASE AGE dpudeployment False Pending 2m32s
NoteA
Pendingphase is expected at this stage. TheDPUDeploymenttransitions toReadyafter DPU provisioning is complete and all services are deployed.
12.4.8. Create the HBN DPU service configuration
You can create a DPUServiceConfiguration custom resource for the Host-Based Networking (HBN) DPU service. The HBN service provides BGP-based networking on the DPU with ECMP routing support.
HBN and OVN-Kubernetes are currently the only supported DPU network services. The DOCA Telemetry Service (DTS), which you configure in a later step, is deployed for observability and is not a network service.
The DPUServiceTemplate resources are automatically created and managed by the dpf-hcp-provisioner-operator. You only need to create the DPUServiceConfiguration resources.
Prerequisites
- The DPF Operator is installed.
-
The
DPFOperatorConfigresource is created. - The DPF Operator environment variables are set. For details, see "DPF Operator installation environment variables".
Procedure
Create a file named
hbn.yamlwith the following content:apiVersion: svc.dpu.nvidia.com/v1alpha1 kind: DPUServiceConfiguration metadata: name: hbn namespace: dpf-operator-system spec: deploymentServiceName: "hbn" serviceConfiguration: serviceDaemonSet: annotations: k8s.v1.cni.cncf.io/networks: |- [ {"name": "iprequest", "interface": "ip_lo", "cni-args": {"poolNames": ["loopback"], "poolType": "cidrpool"}}, {"name": "iprequest", "interface": "ip_pf2dpu2", "cni-args": {"poolNames": ["pool1"], "poolType": "cidrpool", "allocateDefaultGateway": true}} ] helmChart: values: configuration: perDPUValuesYAML: | - hostnamePattern: "*" values: bgp_peer_group: hbn startupYAMLJ2: | - header: model: BLUEFIELD nvue-api-version: nvue_v1 rev-id: 1.0 version: HBN 2.4.0 - set: interface: lo: ip: address: {{ ipaddresses.ip_lo.ip }}/32: {} type: loopback p0_if,p1_if: type: swp link: mtu: 9216 pf2dpu2_if: ip: address: {{ ipaddresses.ip_pf2dpu2.cidr }}: {} type: swp link: mtu: 9216 router: bgp: autonomous-system: {{ ( ipaddresses.ip_lo.ip.split(".")[3] | int ) + 65101 }} enable: on graceful-restart: mode: full router-id: {{ ipaddresses.ip_lo.ip }} vrf: default: router: bgp: address-family: ipv4-unicast: enable: on redistribute: connected: enable: on ipv6-unicast: enable: on redistribute: connected: enable: on enable: on neighbor: p0_if: peer-group: {{ config.bgp_peer_group }} type: unnumbered p1_if: peer-group: {{ config.bgp_peer_group }} type: unnumbered path-selection: multipath: aspath-ignore: on peer-group: {{ config.bgp_peer_group }}: remote-as: external interfaces: - name: p0_if network: mybrhbn - name: p1_if network: mybrhbn - name: pf2dpu2_if network: mybrhbnApply the resource file:
$ oc apply -f hbn.yaml
Example output
dpuserviceconfiguration.svc.dpu.nvidia.com/hbn created
12.4.9. Create the OVN-Kubernetes DPU service configuration
You can create a DPUServiceConfiguration custom resource for the OVN-Kubernetes DPU service. The OVN-Kubernetes service provides pod networking on the DPU.
Prerequisites
- You have installed the DPF Operator.
-
You have created the
DPFOperatorConfigresource. -
You have created the HBN
DPUServiceConfigurationresource. - You have set the DPF Operator environment variables. For details, see "DPF Operator installation environment variables".
Procedure
Create a file named
ovn-k.yamlwith the following content:apiVersion: svc.dpu.nvidia.com/v1alpha1 kind: DPUServiceConfiguration metadata: name: ovn namespace: dpf-operator-system spec: deploymentServiceName: "ovn" serviceConfiguration: helmChart: values: global: enableOvnKubeIdentity: false k8sAPIServer: https://$HOST_CLUSTER_API:6443 podNetwork: 10.128.0.0/14/23 serviceNetwork: 172.30.0.0/16 hostNetworkNamespace: "openshift-host-network" mtu: $OVN_MTU dpuManifests: kubernetesSecretName: "ovn-dpu" vtepCIDR: $VTEP_CIDR hostCIDR: $DPU_HOST_CIDR ipamPool: "pool1" ipamPoolType: "cidrpool" ipamVTEPIPIndex: 0 ipamPFIPIndex: 1 cniBinDir: "/var/lib/cni/bin/" cniConfDir: "/run/multus/cni/net.d"Apply the resource file:
$ envsubst < ovn-k.yaml | oc apply -f -
Verification
Verify that the HBN and OVN-Kubernetes service configurations are created:
$ oc get dpuserviceconfiguration -n dpf-operator-system
12.4.10. Create the DOCA Telemetry Service DPU service configuration
You can create a DPUServiceConfiguration custom resource for the DOCA Telemetry Service. The DOCA Telemetry Service provides metrics collection from the DPUs by using Prometheus.
The DPUServiceTemplate for DOCA Telemetry Service is automatically created and managed by the dpf-hcp-provisioner-operator controller. The operator uses the correct chart and image versions for the installed DPF version. You only need to create the DPUServiceConfiguration resource.
Prerequisites
- You have installed the DPF Operator.
-
You have created the
DPFOperatorConfigresource. - You have set the DPF Operator environment variables. For details, see "DPF Operator installation environment variables".
Procedure
Create a file named
dts.yamlwith the following content:apiVersion: svc.dpu.nvidia.com/v1alpha1 kind: DPUServiceConfiguration metadata: name: doca-telemetry-service namespace: dpf-operator-system spec: deploymentServiceName: "doca-telemetry-service" serviceConfiguration: configPorts: ports: - name: httpserverport port: 9189 protocol: TCP serviceType: NoneApply the resource file:
$ oc apply -f dts.yaml
Verification
Verify that the DOCA Telemetry Service configuration is created:
$ oc get dpuserviceconfiguration -n dpf-operator-system doca-telemetry-service
12.4.11. Create the OVN-Kubernetes credential request and role bindings
To authenticate with the management cluster API server, create a DPUServiceCredentialRequest custom resource and the associated role bindings to enable the OVN-Kubernetes DPU service on the hosted cluster. The ClusterRoleBinding grants the required permissions for OVN node network operations.
Prerequisites
- You have installed the DPF Operator.
-
You have created the
DPFOperatorConfigresource.
Procedure
Create a file named
dpucredentialreq.yamlwith the following content:apiVersion: svc.dpu.nvidia.com/v1alpha1 kind: DPUServiceCredentialRequest metadata: name: ovn-dpu namespace: dpf-operator-system spec: serviceAccount: name: ovn-kubernetes-node-dpu-service namespace: openshift-ovn-kubernetes duration: 24h type: tokenFile secret: name: ovn-dpu namespace: dpf-operator-system metadata: labels: dpu.nvidia.com/image-pull-secret: "" --- apiVersion: rbac.authorization.k8s.io/v1 kind: RoleBinding metadata: name: openshift-ovn-kubernetes-node-limited-dpu-service namespace: openshift-ovn-kubernetes roleRef: apiGroup: rbac.authorization.k8s.io kind: Role name: openshift-ovn-kubernetes-node-limited subjects: - kind: ServiceAccount name: ovn-kubernetes-node-dpu-service namespace: openshift-ovn-kubernetes --- apiVersion: rbac.authorization.k8s.io/v1 kind: ClusterRoleBinding metadata: name: ovn-kubernetes-node-limited-binding roleRef: apiGroup: rbac.authorization.k8s.io kind: ClusterRole name: openshift-ovn-kubernetes-node-limited subjects: - kind: ServiceAccount name: ovn-kubernetes-node-dpu-service namespace: openshift-ovn-kubernetesApply the resource file:
$ oc apply -f dpucredentialreq.yaml
Verification
Verify that the credential request and role bindings are created:
$ oc get dpuservicecredentialrequest -n dpf-operator-system
$ oc get clusterrolebinding ovn-kubernetes-node-limited-binding
12.4.12. Create the DPUServiceInterface custom resources
You can create DPUServiceInterface custom resources to define interface objects that are specified in service chains. You must create physical interface resources for the DPU ports and an OVN-Kubernetes interface resource for host workloads.
Prerequisites
- You have installed the DPF Operator.
-
You have created the
DPFOperatorConfigresource.
Procedure
Create a file named
physical-if.yamlwith the following content to define the physical DPU port interfaces:apiVersion: svc.dpu.nvidia.com/v1alpha1 kind: DPUServiceInterface metadata: name: p0 namespace: dpf-operator-system spec: template: spec: template: metadata: labels: uplink: "p0" spec: interfaceType: physical physical: interfaceName: p0 --- apiVersion: svc.dpu.nvidia.com/v1alpha1 kind: DPUServiceInterface metadata: name: p1 namespace: dpf-operator-system spec: template: spec: template: metadata: labels: uplink: "p1" spec: interfaceType: physical physical: interfaceName: p1Apply the physical interface resource file:
$ oc apply -f physical-if.yaml
Create a file named
ovnk-if.yamlwith the following content to define the OVN-Kubernetes interface:apiVersion: svc.dpu.nvidia.com/v1alpha1 kind: DPUServiceInterface metadata: name: ovn namespace: dpf-operator-system spec: template: spec: template: metadata: labels: port: ovn spec: interfaceType: ovnApply the OVN-Kubernetes interface resource file:
$ oc apply -f ovnk-if.yaml
Verification
Verify that all
DPUServiceInterfaceresources are created:$ oc get dpuserviceinterface -n dpf-operator-system
12.4.13. Create the DPUServiceNAD resource
Create a DPUServiceNAD custom resource to define the network attachment available to DPU services on the hosted cluster. The DPUServiceNAD resource maps to an Open vSwitch (OVS) bridge on the DPU and specifies the resource type, IP address management (IPAM) mode, and maximum transmission unit (MTU) configuration:
-
mybrhbnmaps to thebr-hbnbridge, used by the HBN service. IPAM is disabled because IP allocation is handled byDPUServiceIPAM.
Prerequisites
- You have installed the DPF Operator.
-
You have created the
DPFOperatorConfigresource. - You have set the DPF Operator environment variables. For details, see "DPF Operator installation environment variables".
Procedure
Create a file named
dpuservice-nad.yamlwith the following content:apiVersion: svc.dpu.nvidia.com/v1alpha1 kind: DPUServiceNAD metadata: name: mybrhbn namespace: dpf-operator-system spec: resourceType: sf ipam: false bridge: "br-hbn" serviceMTU: $NODES_MTU
Apply the resource file:
$ envsubst < dpuservice-nad.yaml | oc apply -f -
Verification
Verify that the
DPUServiceNADresource is created:$ oc get dpuservicenad mybrhbn -n dpf-operator-system
Example output
NAME READY AGE mybrhbn True 2m
12.4.14. Create the DPUServiceIPAM resources
You can create DPUServiceIPAM custom resources to configure IP address management for DPU services. Two IPAM pools are required: one for the VTEP network used by the high-speed data plane, and one for loopback addresses used by the HBN service.
Prerequisites
- You have installed the DPF Operator.
-
You have created the
DPFOperatorConfigresource. - You have set the DPF Operator environment variables. For details, see "DPF Operator installation environment variables".
Procedure
Create a file named
dpuservice-ipam.yamlwith the following content:--- apiVersion: svc.dpu.nvidia.com/v1alpha1 kind: DPUServiceIPAM metadata: name: pool1 namespace: dpf-operator-system spec: ipv4Network: network: $VTEP_CIDR gatewayIndex: 3 prefixSize: 29 --- apiVersion: svc.dpu.nvidia.com/v1alpha1 kind: DPUServiceIPAM metadata: name: loopback namespace: dpf-operator-system spec: ipv4Network: network: "11.0.0.0/24" prefixSize: 32Apply the resource file:
$ envsubst < dpuservice-ipam.yaml | oc apply -f -
Verification
Verify that the
DPUServiceIPAMresources are created:$ oc get dpuserviceipam -n dpf-operator-system
12.5. Provision the DPU hosted cluster
The DPF HCP Provisioner Operator automates the creation and lifecycle management of a hosted control plane cluster for DPU nodes.
12.5.1. DPU hosted cluster provisioning with the DPF HCP Provisioner Operator
The DPF HCP Provisioner Operator abstracts hosted control plane complexity for DPF by orchestrating the full lifecycle of hosted clusters for DPU environments. The Operator treats the hosted control plane as a black box and maintains a 1:1:1 relationship: each DPFHCPProvisioner custom resource maps to exactly one DPUCluster and one HostedCluster.
The Operator provides the following capabilities:
- HostedCluster lifecycle management
-
Creates, updates, and deletes
HostedCluster,NodePool, and associated secret resources. - Automatic CSR approval
- Approves Certificate Signing Requests from DPU worker nodes joining the hosted cluster.
- BlueField OpenShift Container Platform layer image lookup
- Matches OpenShift Container Platform release images to corresponding BlueField container images by using container registry tag lookup.
- Kubeconfig provisioning
-
Extracts the hosted cluster admin kubeconfig, stores it in a secret, and sets the
spec.kubeconfigfield of theDPUClustercustom resource to reference that secret, enabling the management cluster to communicate with the DPU hosted cluster. - MetalLB configuration
-
Deploys
IPAddressPoolandL2Advertisementresources forLoadBalancerservice exposure. - Ignition generation
- Generates BlueField-specific ignition configurations from hosted control plane ignition for DPU node provisioning.
- Status translation
-
Mirrors
HostedClusterconditions toDPFHCPProvisionerstatus without exposing hosted control plane internals.
12.5.2. Install the DPF HCP Provisioner Operator
You can install the DPF HCP Provisioner Operator by using a Helm chart. The operator manages the lifecycle of hosted clusters for DPU environments.
Prerequisites
- The Multicluster Engine (MCE) Operator is installed and hosted control planes is enabled.
-
The MetalLB Operator is installed and a
MetalLBinstance is created. - A storage class is available for etcd persistent volumes, such as LVM Storage or an equivalent.
- The DPF Operator is installed and DPF CRDs are available.
-
The Helm CLI (
helm) is installed on your workstation. -
You have a pull secret file that includes credentials for
registry.redhat.io. Helm reads its registry credentials from this file, which is separate from the container runtime configuration.
Procedure
Set the
OPENSHIFT_PULL_SECRETenvironment variable to the path of your pull secret file:$ export OPENSHIFT_PULL_SECRET="/root/pull-secret.txt"
Install the operator by using Helm:
$ helm upgrade --install dpf-hcp-provisioner-operator \ oci://registry.redhat.io/dpu-kit-for-nvidia/dpf-hcp-provisioner-chart \ --registry-config "${OPENSHIFT_PULL_SECRET}" \ --version 4.22.0 \ --namespace dpf-hcp-provisioner-system \ --create-namespace \ --set provisionerConfig.manageDPUServiceTemplates=trueExample output
NAME: dpf-hcp-provisioner-operator LAST DEPLOYED: ... NAMESPACE: dpf-hcp-provisioner-system STATUS: deployed
NoteThe Helm chart creates a
DPFHCPProvisionerConfigsingleton custom resource nameddefaultthat defines the Operator-wide configuration. This resource controls settings such as the BlueField OpenShift Container Platform layer image repository, MetalLB integration, andDPUServiceTemplatemanagement. To customize these settings, modify theprovisionerConfigsection in your Helmvalues.yamlfile before running thehelm upgrade --installcommand.
Verification
Verify that the Operator pod is running:
$ oc get pods -n dpf-hcp-provisioner-system
Example output
NAME READY STATUS RESTARTS AGE dpf-hcp-provisioner-operator-xxx-yyy 1/1 Running 0 1m
Verify that the
DPFHCPProvisionerConfigsingleton resource was created and thatmanageDPUServiceTemplatesis set totrue:$ oc get dpfhcpprovisionerconfigs.provisioning.dpu.hcp.io default -o yaml
Example output
apiVersion: provisioning.dpu.hcp.io/v1alpha1 kind: DPFHCPProvisionerConfig metadata: name: default labels: app.kubernetes.io/managed-by: Helm helm.sh/chart: dpf-hcp-provisioner-chart-4.22.0 spec: blueFieldOCPLayerRepo: registry.redhat.io/dpu-kit-for-nvidia/bluefield-ocp-layer-rhel10 1 disableMetalLB: false 2 manageDPUServiceTemplates: true 3where:
blueFieldOCPLayerRepo- The container registry repository for BlueField OpenShift Container Platform layer images. The operator queries this repository for an image tag that matches the OpenShift Container Platform version.
disableMetalLB- Disables MetalLB configuration even when a virtual IP is specified.
manageDPUServiceTemplates-
Controls whether the operator creates and manages the
DPUServiceTemplateresources for OVN-Kubernetes, DTS, and HBN in theDPUClusternamespace. This value must betrueotherwise DPU provisioning fails because the requiredDPUServiceTemplateresources are missing. This field is deprecated and will be removed in a future release, at which pointDPUServiceTemplatemanagement is always enabled.
12.5.3. Hosted cluster provisioning environment variables
The following environment variables are used throughout the hosted cluster provisioning procedures. These environment variables must be set before you create secrets, the DPUCluster resource, or the DPFHCPProvisioner resource.
Table 12.9. Hosted cluster provisioning environment variables
| Variable | Description | Example value |
|---|---|---|
|
| The name of the hosted DPU cluster. |
|
|
| The OpenShift Container Platform version for the hosted cluster. |
|
|
| The namespace where hosted cluster resources are created. |
|
|
| The base DNS domain for the hosted cluster. |
|
|
| The storage class used for etcd persistent volume claims. |
|
|
|
The OpenShift Container Platform release image for the hosted cluster. Derived from |
|
|
| The name of the Kubernetes secret that contains the pull secret for the hosted cluster. |
|
|
| The file path to the pull secret JSON file on your workstation. |
|
|
| The name of the Kubernetes secret that contains the SSH public key for the hosted cluster. |
|
|
| The file path to the SSH public key file on your workstation. Use ed25519 keys for better security. |
|
|
| The virtual IP address for the hosted cluster API server, allocated from the management cluster subnet. |
|
You must set all environment variables in your terminal session before you proceed.
$ export HOSTED_CLUSTER_NAME="dpf-hosted"
$ export OPENSHIFT_VERSION="4.22.7"
$ export CLUSTERS_NAMESPACE="clusters"
$ export BASE_DOMAIN="example.com"
$ export ETCD_STORAGE_CLASS="lvms-vg1"
$ export OCP_RELEASE_IMAGE="quay.io/openshift-release-dev/ocp-release:${OPENSHIFT_VERSION}-multi"
$ export PULL_SECRET_NAME="my-pull-secret"
$ export OPENSHIFT_PULL_SECRET="/root/pull-secret.txt"
$ export SSH_KEY_SECRET_NAME="my-ssh-key"
$ export SSH_KEY="/root/.ssh/id_ed25519.pub"
$ export HOSTED_CLUSTER_VIP="192.168.1.200"
$ export DPU_HOST_CIDR="10.0.110.0/24"
$ export VTEP_CIDR="10.0.120.0/22"
$ export NODES_MTU="1500" # Use 1500 for standard MTU, 9000 for jumbo frames
$ export FLANNEL_POD_CIDR="10.132.0.0/14"12.5.4. Create secrets for the hosted cluster
You must create a pull secret and an SSH key secret in the clusters namespace before provisioning the hosted cluster. The DPFHCPProvisioner resource references these secrets during hosted cluster creation.
The BlueField OpenShift Container Platform layer image that the Operator resolves automatically might require authentication to the Quay or Red Hat registry. Ensure that the pull secret includes credentials for that image registry.
Prerequisites
- You have set the environment variables described in "Hosted cluster provisioning environment variables".
-
You have a valid OpenShift Container Platform pull secret file at the path specified by
OPENSHIFT_PULL_SECRET. -
You have an SSH public key file at the path specified by
SSH_KEY.
Procedure
Create the clusters namespace:
$ oc create namespace $CLUSTERS_NAMESPACE
Create the pull secret:
$ oc create secret generic $PULL_SECRET_NAME \ --from-file=.dockerconfigjson=$OPENSHIFT_PULL_SECRET \ --type=Opaque \ -n $CLUSTERS_NAMESPACECreate the SSH key secret:
$ oc create secret generic $SSH_KEY_SECRET_NAME \ --from-file=id_rsa.pub=$SSH_KEY \ --type=Opaque \ -n $CLUSTERS_NAMESPACENoteThe
id_rsa.pubsecret data key is a fixed name that the provisioner expects and it does not require an RSA key. TheSSH_KEYvariable can point to any supported public key file, such as an Ed25519 key.
Verification
Verify that the secrets were created in the clusters namespace:
$ oc get secrets -n $CLUSTERS_NAMESPACE
Example output
NAME TYPE DATA AGE my-pull-secret Opaque 1 10s my-ssh-key Opaque 1 5s
12.5.5. Create the DPUCluster custom resource
The DPUCluster resource tells the DPF Operator about the hosted cluster where DPU services will run.
Do not set the spec.kubeconfig field. After you create the hosted cluster, the DPF HCP Provisioner Operator automatically creates the admin kubeconfig secret in the dpf-operator-system namespace and sets the spec.kubeconfig field of this resource to reference it.
Prerequisites
- You have set the environment variables described in "Hosted cluster provisioning environment variables".
- You have installed the DPF Operator.
Procedure
Create a file named
dpucluster.yamlwith the following content:apiVersion: provisioning.dpu.nvidia.com/v1alpha1 kind: DPUCluster metadata: name: $HOSTED_CLUSTER_NAME namespace: dpf-operator-system spec: type: static maxNodes: 10
Apply the resource with variable substitution:
$ envsubst < dpucluster.yaml | oc apply -f -
Verification
Verify that the
DPUClusterresource was created:$ oc get dpucluster -n dpf-operator-system
12.5.6. Create the DPFHCPProvisioner custom resource
The DPFHCPProvisioner custom resource triggers the creation of the complete hosted cluster infrastructure. This includes the HostedCluster, the MetalLB IPAddressPool, the L2Advertisement, and kubeconfig injection into the DPUCluster.
Prerequisites
- You have set the environment variables described in "Hosted cluster provisioning environment variables".
- You have installed the DPF HCP Provisioner Operator and it is running.
- You have created the pull secret and SSH key secret in the clusters namespace.
-
You have created the
DPUClusterresource in thedpf-operator-systemnamespace.
Procedure
Create a file named
dpfhcpprovisioner.yamlwith the following content:apiVersion: provisioning.dpu.hcp.io/v1alpha1 kind: DPFHCPProvisioner metadata: name: $HOSTED_CLUSTER_NAME namespace: $CLUSTERS_NAMESPACE spec: baseDomain: $BASE_DOMAIN dpuClusterRef: name: $HOSTED_CLUSTER_NAME namespace: dpf-operator-system dpuDeploymentRef: name: dpudeployment namespace: dpf-operator-system etcdStorageClass: $ETCD_STORAGE_CLASS ocpReleaseImage: $OCP_RELEASE_IMAGE pullSecretRef: name: $PULL_SECRET_NAME sshKeySecretRef: name: $SSH_KEY_SECRET_NAME virtualIP: $HOSTED_CLUSTER_VIPwhere:
baseDomain- Specifies the base DNS domain for the hosted cluster.
dpuClusterRef-
Specifies a reference to the
DPUClusterresource that represents the DPU hosted cluster. dpuDeploymentRef-
Specifies a reference to the
DPUDeploymentresource in thedpf-operator-systemnamespace. etcdStorageClass- Specifies the storage class for etcd persistent volume claims.
ocpReleaseImage- Specifies the OpenShift Container Platform release image for the hosted cluster.
pullSecretRef- Specifies the name of the pull secret in the same namespace.
sshKeySecretRef- Specifies the name of the SSH key secret in the same namespace.
virtualIP- Specifies the virtual IP address for the hosted cluster API server, allocated from the management cluster subnet.
The following optional fields use working defaults and do not need to be specified unless you want to override them:
controlPlaneAvailabilityPolicy-
Specifies the availability policy for the hosted cluster control plane. This optional parameter defaults to
HighlyAvailable. Set it toSingleReplicafor a single-node control plane, in which casevirtualIPis not required. flannelEnabled-
Specifies whether to enable Flannel networking in the hosted cluster. This optional parameter defaults to
true. clusterNetwork-
Specifies the pod network CIDR for the hosted cluster. This optional parameter defaults to
10.128.0.0/14. serviceNetwork-
Specifies the service network CIDR for the hosted cluster. This optional parameter defaults to
172.30.0.0/16. machineNetwork- Specifies the machine network CIDR for the hosted cluster. This optional parameter uses the management cluster network by default.
nodeSelector- Specifies a node selector for scheduling the hosted control plane pods. This optional parameter uses default scheduling by default.
Apply the resource with variable substitution:
$ envsubst < dpfhcpprovisioner.yaml | oc apply -f -
12.5.7. Verify hosted cluster creation
After creating the DPFHCPProvisioner resource, you can monitor its status to verify that the hosted cluster is provisioned and becomes ready. The provisioning process can take up to 30 minutes.
Prerequisites
-
You have created the
DPFHCPProvisionerresource in the clusters namespace.
Procedure
Monitor the
DPFHCPProvisionerstatus:$ oc get dpfhcpprovisioner -n ${CLUSTERS_NAMESPACE}Example output
NAME PHASE READY HOSTEDCLUSTER AGE dpf-hosted Provisioning False dpf-hosted 2m
Wait for the
DPFHCPProvisionerto reach theReadyphase:$ oc wait dpfhcpprovisioner ${HOSTED_CLUSTER_NAME} -n ${CLUSTERS_NAMESPACE} \ --for=jsonpath='{.status.phase}'=Ready --timeout=30mExample output
dpfhcpprovisioner.provisioning.dpu.hcp.io/dpf-hosted condition met
Verification
Confirm that the
DPUClusteris ready:$ oc get dpucluster ${HOSTED_CLUSTER_NAME} -n dpf-operator-systemA
Readystatus indicates that the operator created the admin kubeconfig secret referenced by theDPUClusterresource and that the hosted cluster API is reachable, which is the prerequisite for DPU worker nodes to join:Confirm that the admin kubeconfig secret referenced by the
DPUClusterwas created in thedpf-operator-systemnamespace:$ oc get secret ${HOSTED_CLUSTER_NAME}-admin-kubeconfig -n dpf-operator-systemExample output
NAME TYPE DATA AGE dpf-hosted-admin-kubeconfig Opaque 1 10m
12.5.8. Verify DPU service reconciliation
After the DPU hosted cluster and DPUCluster are ready, verify that the DPU services, IPAM pools, service interfaces, and service chains created for the DPUDeployment are reconciled.
Prerequisites
-
You have created the DPF custom resources:
DPFOperatorConfig,NodeSRIOVDevicePluginConfig,DPUFlavor,BFB, andDPUDeployment. - You have created the HBN, OVN-Kubernetes, and DTS DPU service resources.
-
The
DPUClusteris ready. -
You have access to the management cluster as a user with the
cluster-adminrole. -
You have installed the
ocCLI.
You might need to run the commands multiple times to ensure that the condition is met, because the DPU services can take time to converge.
Procedure
Verify that the
DPUServiceresources are created and reconciled:$ oc wait --for=condition=ApplicationsReconciled \ --namespace dpf-operator-system dpuservices \ -l svc.dpu.nvidia.com/owned-by-dpudeployment=dpf-operator-system_dpudeployment
Verify that the
DPUServiceIPAMresources are reconciled:$ oc wait --for=condition=DPUIPAMObjectReconciled \ --namespace dpf-operator-system dpuserviceipam --all
Verify that the
DPUServiceInterfaceresources are reconciled:$ oc wait --for=condition=ServiceInterfaceSetReconciled \ --namespace dpf-operator-system dpuserviceinterface --all
Verify that the
DPUServiceChainresources are reconciled:$ oc wait --for=condition=ServiceChainSetReconciled \ --namespace dpf-operator-system dpuservicechain --all
12.6. Add worker nodes and provision DPUs
After the DPF Operator and the hosted cluster are configured, adjust the OVN-Kubernetes CNI settings, add DPU-equipped worker nodes to the management cluster, and provision the DPUs.
12.6.1. Enable the OVN-Kubernetes resource injector
You can install the OVN-Kubernetes resource injector by using Helm to deploy a mutating admission webhook that automatically injects SR-IOV virtual function resource requests and network attachment annotations into each pod scheduled to a worker node.
Virtual function resource capacity on worker nodes is provided by the NodeSRIOVDevicePluginConfig resource, which replaces the manual SR-IOV device plugin DaemonSet and control plane node patching used in earlier DPF versions.
Prerequisites
-
You have access to the management cluster as a user with the
cluster-adminrole. -
You have installed the
ocCLI. -
You have installed the
helmCLI. - You have set the DPF Operator environment variables. For details, see "DPF Operator installation environment variables".
-
You have created the
NodeSRIOVDevicePluginConfigresource.
Procedure
Install the OVN-Kubernetes resource injector by using Helm:
$ helm upgrade --install -n openshift-ovn-kubernetes ovn-kubernetes \ "$OVN_TEMPLATE_CHART_URL/ovn-kubernetes-chart" \ --version "${OVN_CHART_VERSION}" \ --skip-crds \ --set ovn-kubernetes-resource-injector.enabled=true \ --set ovn-kubernetes-resource-injector.resourceName="openshift.io/bf3_vfs" \ --set ovn-kubernetes-resource-injector.prioritizeOffloading=false \ --set ovn-kubernetes-resource-injector.controllerManager.hostNetwork=true \ --set ovn-kubernetes-resource-injector.controllerManager.webhookPort="19443" \ --set ovn-kubernetes-resource-injector.controllerManager.healthProbeBindAddress=":18081" \ --set ovn-kubernetes-resource-injector.controllerManager.webhook.image.pullPolicy=IfNotPresent \ --set "ovn-kubernetes-resource-injector.controllerManager.webhook.args={--leader-elect,--metrics-bind-address=:29091}" \ --set nodeWithDPUManifests.enabled=false \ --set nodeWithoutDPUManifests.enabled=false \ --set dpuManifests.enabled=false \ --set controlPlaneManifests.enabled=false \ --set commonManifests.enabled=falseExample output
NAME: ovn-kubernetes LAST DEPLOYED: Sun Nov 2 17:10:29 2025 NAMESPACE: openshift-ovn-kubernetes STATUS: deployed REVISION: 1 DESCRIPTION: Install complete TEST SUITE: None
Verification
Verify the resource injector mutating webhook configuration was applied:
$ oc get mutatingwebhookconfiguration | grep ovn
Example output
NAME WEBHOOKS AGE ovn-kubernetes-ovn-kubernetes-resource-injector 1 22h
12.6.2. OVN-Kubernetes DPU-Host mode
DPU-Host mode on worker nodes with accelerated OVN-Kubernetes CNI is automatically configured by the DPF provisioning controller.
When the DPFOperatorConfig resource is created and worker nodes with the worker-dpu label are provisioned, the DPF provisioning controller automatically configures the required settings for DPU-Host mode, including the network node identity and hardware offload configuration.
12.6.3. Add worker nodes by using the Bare Metal Operator
You can add DPU-equipped worker nodes to the management cluster by creating BareMetalHost resources that the Bare Metal Operator provisions.
Prerequisites
-
You have access to the management cluster as a user with the
cluster-adminrole. -
You have installed the
ocCLI. - You have installed the Bare Metal Operator on the management cluster.
- Physical worker servers with Redfish-compatible BMC, iDRAC, or iLO access are available.
- Network connectivity exists from the management cluster to the worker BMC interfaces.
- You have the BMC IP address and access credentials for each server.
- You have the MAC address of the management network interface for each server.
- You have the name of the root disk device for each server.
Procedure
Set the following environment variables for the worker node:
$ export BMC_IP=<bmc_ip_address> $ export BMC_USER=<bmc_username> $ export BMC_PASSWORD=<bmc_password> $ export WORKER_NAME=<worker_name> $ export BOOT_MAC=<management_interface_mac> $ export ROOT_DEVICE=<root_device_path>
where:
<bmc_ip_address>- Specifies the IP address of the worker node BMC interface.
<bmc_username>- Specifies the username for BMC access.
<bmc_password>- Specifies the password for BMC access.
<worker_name>-
Specifies a name for the worker node, such as
worker-01. <management_interface_mac>-
Specifies the MAC address of the out-of-band management interface, such as
00:00:5E:00:53:01. <root_device_path>-
Specifies the path to the root disk device, such as
/dev/nvme0n1.
Verify BMC connectivity from one of the control plane nodes:
$ ping $BMC_IP
$ curl -k https://$BMC_IP/redfish/v1/
$ curl -k -u $BMC_USER:$BMC_PASSWORD https://$BMC_IP/redfish/v1/Systems
Verify that the Bare Metal Operator is available:
$ oc get clusteroperator baremetal
Create a file named
provisioning.yamlwith the following content to disable the provisioning network:apiVersion: metal3.io/v1alpha1 kind: Provisioning metadata: name: provisioning-configuration spec: provisioningNetwork: "Disabled" watchAllNamespaces: false
ImportantWhen
provisioningNetworkis set toDisabled, servers boot by using Redfish virtual media instead of PXE.Apply the
Provisioningresource:$ oc apply -f provisioning.yaml
Create a file named
bmc-secret.yamlwith the following content to store the BMC credentials:apiVersion: v1 kind: Secret metadata: name: ${WORKER_NAME}-bmc-secret namespace: openshift-machine-api type: Opaque stringData: username: ${BMC_USER} password: ${BMC_PASSWORD}Apply the BMC credentials secret:
$ envsubst < bmc-secret.yaml | oc apply -f -
Create a file named
baremetalhost.yaml. TheuserDatasecret determines the node type:For a DPU-equipped worker node, reference the
worker-dpu-user-data-managedsecret:apiVersion: metal3.io/v1alpha1 kind: BareMetalHost metadata: name: $WORKER_NAME namespace: openshift-machine-api spec: online: true bootMACAddress: $BOOT_MAC rootDeviceHints: deviceName: $ROOT_DEVICE bmc: address: redfish-virtualmedia+https://$BMC_IP credentialsName: $WORKER_NAME-bmc-secret disableCertificateVerification: true customDeploy: method: install_coreos userData: name: worker-dpu-user-data-managed namespace: openshift-machine-apiFor a regular worker node without a DPU, reference the
worker-user-data-managedsecret instead:apiVersion: metal3.io/v1alpha1 kind: BareMetalHost metadata: name: $WORKER_NAME namespace: openshift-machine-api spec: online: true bootMACAddress: $BOOT_MAC rootDeviceHints: deviceName: $ROOT_DEVICE bmc: address: redfish-virtualmedia+https://$BMC_IP credentialsName: $WORKER_NAME-bmc-secret disableCertificateVerification: true customDeploy: method: install_coreos userData: name: worker-user-data-managed namespace: openshift-machine-apiImportantAdding a regular worker node without a DPU is a Technology Preview feature.
Apply the
BareMetalHostresource:$ envsubst < baremetalhost.yaml | oc apply -f -
Verification
Monitor the provisioning progress:
$ oc get bmh -n openshift-machine-api -w
Example output
NAME STATE CONSUMER ONLINE ERROR AGE worker-01 registering true 10s worker-01 inspecting true 15s worker-01 preparing true 20s worker-01 available true 30s worker-01 provisioning true 1m worker-01 provisioned true 10m
12.6.4. Approve worker node CSRs
You must approve the pending certificate signing requests (CSRs) for worker nodes that join the management cluster.
Worker nodes provisioned by using a BareMetalHost resource do not have an associated Machine object, so the default OpenShift machine approver does not automatically approve their certificate signing requests (CSRs). You must manually approve the kube-apiserver-client-kubelet CSR from the node-bootstrapper service account and the kubelet-serving CSR from the node for each worker node.
Prerequisites
-
You have access to the management cluster as a user with the
cluster-adminrole. -
You have installed the
ocCLI. - Worker nodes are booted and attempting to join the management cluster.
Procedure
Watch for pending CSRs:
$ oc get csr -w
Approve all pending CSRs:
$ oc get csr -o go-template='{{range .items}}{{if not .status}}{{.metadata.name}}{{"\n"}}{{end}}{{end}}' | xargs oc adm certificate approveExample output
certificatesigningrequest.certificates.k8s.io/csr-27bgq approved certificatesigningrequest.certificates.k8s.io/csr-69g65 approved certificatesigningrequest.certificates.k8s.io/csr-7r862 approved certificatesigningrequest.certificates.k8s.io/csr-f5vk7 approved
Repeat this step until no pending CSRs remain. Each node typically generates multiple CSRs.
Verify that the worker nodes joined the cluster:
$ oc get nodes
Example output
NAME STATUS ROLES AGE VERSION host-worker1 NotReady worker 68s v1.35.6 host-worker2 NotReady worker 75s v1.35.6 master-0 Ready control-plane,master,worker 4d22h v1.35.6 master-1 Ready control-plane,master,worker 4d21h v1.35.6 master-2 Ready control-plane,master,worker 4d22h v1.35.6
NoteThe worker nodes show a status of
NotReadyuntil the DPU provisioning process is fully completed and all OVN-Kubernetes CNI components on the host and the DPU are running. Do not proceed to the next steps until all pending CSRs are approved.
12.6.5. Verify DPU provisioning
After the worker nodes join the management cluster, the DPUSet controller automatically detects nodes with the feature.node.kubernetes.io/dpu-enabled label, which the Node Feature Discovery Operator applies to DPU-equipped nodes. The controller then creates a DPU object for each node and starts the provisioning process. You can monitor the provisioning stages to verify progress.
Prerequisites
-
You have access to the management cluster as a user with the
cluster-adminrole. -
You have installed the
ocCLI. - The worker node CSRs are approved and the nodes have joined the management cluster.
Procedure
Watch for
DPUobject creation:$ oc get dpu -n dpf-operator-system -w
Example output
NAME READY OPERATIONAL PHASE AGE <node-name>-<dpu-id> Unknown Node Effect 25s <node-name>-<dpu-id> Unknown Initialize Interface 26s <node-name>-<dpu-id> Unknown Config FW Parameters 28s <node-name>-<dpu-id> Unknown Prepare BFB 28s <node-name>-<dpu-id> Unknown OS Installing 5m28s <node-name>-<dpu-id> Unknown DPU Config 15m <node-name>-<dpu-id> Unknown Rebooting 26m <node-name>-<dpu-id> Unknown Host Network Configuration 27m <node-name>-<dpu-id> False DPU Cluster Config 64m <node-name>-<dpu-id> Unknown Node Effect Removal 71m <node-name>-<dpu-id> True True Ready 71m
The
DPUobjects progress through the following provisioning stages:Initializing-
The
DPUobject is created. OS Installing- The BFB installation is in progress.
Rebooting- The host and DPU are resetting.
DPU Cluster Config- The DPU Kubernetes node join procedure is in progress. Manual CSR approval is required during this stage.
Host Network Configuration- Networking configuration adjustments are applied on the host.
Ready- The DPU is successfully provisioned and ready to use.
Error- Provisioning failed. Check events and conditions for details.
ImportantWhen the provisioning stage reaches
DPU Cluster Config, proceed to "Configure authorization for the hosted cluster" and "Approve DPU node CSRs" to complete the DPU node join process.Monitor detailed provisioning progress:
$ oc -n dpf-operator-system exec deploy/dpf-operator-controller-manager -- /dpfctl describe dpudeployments
Optional: View detailed status for a specific
DPUobject:In the following command, replace
<dpu_name>with the name of theDPUresource:$ oc describe dpu -n dpf-operator-system <dpu_name>
Optional: Follow the provisioning controller logs for a specific DPU:
In the following command, replace
<dpu_name>with the name of theDPUresource:$ oc logs -n dpf-operator-system -l dpu.nvidia.com/component=dpf-provisioning-controller-manager --tail=-1 -f | grep <dpu_name>
12.6.6. Configure authorization for the hosted cluster
DPF services running on DPU nodes require privileged access to host networking and devices. You must create a ClusterRoleBinding on the hosted cluster that grants the privileged security context constraint (SCC) to all service accounts in the dpf-operator-system namespace.
Prerequisites
-
You have access to the hosted cluster as a user with the
cluster-adminrole. -
You have installed the
ocCLI. - The hosted cluster kubeconfig file is available.
-
DPU provisioning has reached the
DPU Cluster Configstage.
Procedure
Get the hosted cluster kubeconfig:
$ oc get secret $HOSTED_CLUSTER_NAME-admin-kubeconfig -n $CLUSTERS_NAMESPACE -o jsonpath='{.data.kubeconfig}' | base64 -d > $HOSTED_CLUSTER_NAME.kubeconfigSwitch to the hosted cluster context:
$ export KUBECONFIG=$HOSTED_CLUSTER_NAME.kubeconfig
Create a file named
dpu-cluster-scc.yamlwith the following content:apiVersion: rbac.authorization.k8s.io/v1 kind: ClusterRoleBinding metadata: name: dpf-system-scc-privileged labels: app.kubernetes.io/component: rbac app.kubernetes.io/part-of: dpu-services roleRef: apiGroup: rbac.authorization.k8s.io kind: ClusterRole name: system:openshift:scc:privileged subjects: - kind: Group apiGroup: rbac.authorization.k8s.io name: system:serviceaccounts:dpf-operator-systemApply the resource file on the hosted cluster:
$ oc apply -f dpu-cluster-scc.yaml
12.6.7. Approve hosted cluster CSRs for DPU provisioning
You must approve the pending certificate signing requests (CSRs) for DPU nodes on the hosted cluster so that the DPU nodes can join the hosted cluster and complete provisioning.
When you use the DPF HCP Provisioner Operator, DPU CSR approval is handled automatically. Manual approval is provided as a fallback if automatic approval is not functioning.
Prerequisites
-
You have access to the hosted cluster as a user with the
cluster-adminrole. -
You have installed the
ocCLI. -
You have set the
KUBECONFIGenvironment variable to the hosted cluster kubeconfig file. -
DPU provisioning has reached the
DPU Cluster Configstage.
Procedure
Watch for pending CSRs from the DPU nodes:
$ oc get csr -w
The DPU node name typically follows the pattern
<host_worker_node_name>-<dpu_serial_number>.Approve all pending CSRs:
$ oc get csr -o go-template='{{range .items}}{{if not .status}}{{.metadata.name}}{{"\n"}}{{end}}{{end}}' | xargs oc adm certificate approveExample output
certificatesigningrequest.certificates.k8s.io/csr-6jx22 approved certificatesigningrequest.certificates.k8s.io/csr-tb6nd approved
Repeat this step until no pending CSRs remain.
Verification
Verify that the DPU nodes joined the hosted cluster and are in a
Readystate:$ oc get nodes
Example output
NAME STATUS ROLES AGE VERSION host-worker1-mt0000000001 Ready worker 2m48s v1.35.6 host-worker2-mt0000000002 Ready worker 2m45s v1.35.6
NoteAfter the DPU nodes join the hosted cluster, the DPU provisioning process continues to the remaining stages.
12.6.8. Verify full system readiness
After the DPU provisioning process completes, you can verify that all worker nodes, SR-IOV virtual functions, and DPU services are operational on the management cluster.
Prerequisites
-
You have access to the management cluster as a user with the
cluster-adminrole. -
You have installed the
ocCLI. - DPU provisioning has completed.
Procedure
Switch back to the management cluster context:
$ export KUBECONFIG="$(pwd)/mgmt-kubeconfig"
Verify that all worker nodes are in a
Readystate:$ oc get node
Example output
NAME STATUS ROLES AGE VERSION host-worker1 Ready worker 57m v1.35.6 host-worker2 Ready worker 57m v1.35.6 master-0 Ready control-plane,master,worker 4d23h v1.35.6 master-1 Ready control-plane,master,worker 4d22h v1.35.6 master-2 Ready control-plane,master,worker 4d23h v1.35.6
Verify that SR-IOV virtual functions are registered as Kubernetes node resources on the worker nodes:
$ oc get nodes -l 'node-role.kubernetes.io/worker,!node-role.kubernetes.io/control-plane' -o json | \ jq '.items[] | {name: .metadata.name, capacity: .status.capacity."openshift.io/bf3_vfs", allocatable: .status.allocatable."openshift.io/bf3_vfs"}'Example output
{ "name": "host-worker1", "capacity": "90", "allocatable": "90" } { "name": "host-worker2", "capacity": "90", "allocatable": "90" }Verify that all DPU services are in a
Successphase:$ oc get dpuservices -n dpf-operator-system
Example output
NAME READY PHASE AGE doca-telemetry-service-7s8pb True Success 42m flannel True Success 26h hbn-gffmv True Success 25m kube-state-metrics-rbac True Success 4h10m node-problem-detector True Success 4h10m nvidia-k8s-ipam-node True Success 4h10m ovn-f49zx True Success 17m ovs-cni True Success 26h servicechainset-rbac-and-crds True Success 138m sfc-controller True Success 26h sriov-device-plugin True Success 26h
Optional: View detailed DPU service status:
$ oc -n dpf-operator-system exec deploy/dpf-operator-controller-manager -- /dpfctl describe all --show-resources=dpuservice --grouping=false
12.7. Validate traffic and configure telemetry
After provisioning the DPUs and verifying system readiness, validate end-to-end traffic flow and configure DPU telemetry observability.
12.7.1. Deploy traffic test pods and services
You can deploy traffic test pods and services across the management cluster to validate end-to-end connectivity through the DPU data plane. The test workloads include a server pod on a control plane node and worker pods on DPU-enabled nodes, with both standard and host-network configurations.
These test workloads use the nicolaka/netshoot container image, a community networking-troubleshooting image that is not officially supported by Red Hat or NVIDIA. Use it only for connectivity validation and testing, not in production workloads.
Prerequisites
- You have installed the DPF Operator and provisioned the DPU hosted cluster.
- At least one DPU-enabled worker node is available.
-
You have access to the management cluster as a user with the
cluster-adminrole.
Procedure
Create a file named
traffic-pods.yamlwith the following content:# 1. Namespace --- apiVersion: v1 kind: Namespace metadata: name: workload # 2. SCC RoleBinding (grants 'default' ServiceAccount in 'workload' NS access to 'privileged' SCC) --- apiVersion: rbac.authorization.k8s.io/v1 kind: RoleBinding metadata: name: privileged-scc-default-sa namespace: workload subjects: - kind: ServiceAccount name: default namespace: workload roleRef: kind: ClusterRole name: system:openshift:scc:privileged apiGroup: rbac.authorization.k8s.io # 3. Deployments and Services # Deployment: traffic-test-master --- apiVersion: apps/v1 kind: Deployment metadata: name: traffic-test-master namespace: workload labels: app: traffic-test-master spec: replicas: 1 selector: matchLabels: app: traffic-test-master template: metadata: labels: app: traffic-test-master spec: topologySpreadConstraints: - maxSkew: 1 topologyKey: kubernetes.io/hostname whenUnsatisfiable: DoNotSchedule labelSelector: matchLabels: app: traffic-test-master nodeSelector: node-role.kubernetes.io/control-plane: "" tolerations: - key: node-role.kubernetes.io/master operator: Exists effect: NoSchedule - key: node-role.kubernetes.io/control-plane operator: Exists effect: NoSchedule containers: - name: nginx securityContext: privileged: true capabilities: add: - NET_ADMIN image: nicolaka/netshoot command: ["nc", "-kl", "5000"] ports: - containerPort: 5000 name: tcp-server resources: requests: cpu: 1 memory: 1Gi limits: cpu: 1 memory: 1Gi --- # Service: traffic-test-master apiVersion: v1 kind: Service metadata: name: traffic-test-master namespace: workload labels: app: traffic-test-master spec: selector: app: traffic-test-master ports: - protocol: TCP port: 5000 targetPort: 5000 --- # Service: traffic-test-master-nodeport apiVersion: v1 kind: Service metadata: name: traffic-test-master-nodeport namespace: workload labels: app: traffic-test-master spec: type: NodePort selector: app: traffic-test-master ports: - protocol: TCP port: 5000 targetPort: 5000 --- # Deployment: traffic-test-worker apiVersion: apps/v1 kind: Deployment metadata: name: traffic-test-worker namespace: workload labels: app: traffic-test-worker spec: replicas: 1 selector: matchLabels: app: traffic-test-worker template: metadata: labels: app: traffic-test-worker spec: topologySpreadConstraints: - maxSkew: 1 topologyKey: kubernetes.io/hostname whenUnsatisfiable: DoNotSchedule labelSelector: matchLabels: app: traffic-test-worker nodeSelector: feature.node.kubernetes.io/dpu-enabled: "" containers: - name: nginx securityContext: privileged: true capabilities: add: - NET_ADMIN image: nicolaka/netshoot command: ["nc", "-kl", "5000"] ports: - containerPort: 5000 name: tcp-server resources: requests: cpu: 16 memory: 6Gi limits: cpu: 16 memory: 6Gi --- # Service: traffic-test-worker apiVersion: v1 kind: Service metadata: name: traffic-test-worker namespace: workload labels: app: traffic-test-worker spec: selector: app: traffic-test-worker ports: - protocol: TCP port: 5000 targetPort: 5000 --- # Service: traffic-test-worker-nodeport apiVersion: v1 kind: Service metadata: name: traffic-test-worker-nodeport namespace: workload labels: app: traffic-test-worker spec: type: NodePort selector: app: traffic-test-worker ports: - protocol: TCP port: 5000 targetPort: 5000 --- # Deployment: traffic-test-worker-hostnetwork apiVersion: apps/v1 kind: Deployment metadata: name: traffic-test-worker-hostnetwork namespace: workload labels: app: traffic-test-worker-hostnetwork spec: replicas: 1 selector: matchLabels: app: traffic-test-worker-hostnetwork template: metadata: labels: app: traffic-test-worker-hostnetwork spec: topologySpreadConstraints: - maxSkew: 1 topologyKey: kubernetes.io/hostname whenUnsatisfiable: DoNotSchedule labelSelector: matchLabels: app: traffic-test-worker-hostnetwork nodeSelector: feature.node.kubernetes.io/dpu-enabled: "" hostNetwork: true containers: - name: nginx securityContext: privileged: true capabilities: add: - NET_ADMIN image: nicolaka/netshoot command: ["nc", "-kl", "5000"] ports: - containerPort: 5000 name: tcp-server resources: requests: cpu: 1 memory: 1Gi limits: cpu: 1 memory: 1Gi --- # Service: traffic-test-worker-hostnetwork apiVersion: v1 kind: Service metadata: name: traffic-test-worker-hostnetwork namespace: workload labels: app: traffic-test-worker-hostnetwork spec: selector: app: traffic-test-worker-hostnetwork ports: - protocol: TCP port: 5000 targetPort: 5000 --- # Service: traffic-test-worker-hostnetwork-nodeport apiVersion: v1 kind: Service metadata: name: traffic-test-worker-hostnetwork-nodeport namespace: workload labels: app: traffic-test-worker-hostnetwork spec: type: NodePort selector: app: traffic-test-worker-hostnetwork ports: - protocol: TCP port: 5000 targetPort: 5000The manifest creates the following resources:
-
A
workloadnamespace for the test pods. -
A
RoleBindingresource that grants thedefaultservice account in theworkloadnamespace access to theprivilegedsecurity context constraint. -
A
traffic-test-masterdeployment andClusterIPandNodePortservices on a control plane node. -
A
traffic-test-workerdeployment andClusterIPandNodePortservices on DPU-enabled worker nodes. A
traffic-test-worker-hostnetworkdeployment that uses host networking on DPU-enabled worker nodes, withClusterIPandNodePortservices.NoteThe worker deployments set
replicas: 1for a single DPU worker node. Set the replica count of thetraffic-test-workerandtraffic-test-worker-hostnetworkdeployments to the number of DPU-enabled worker nodes so that thetopologySpreadConstraintsplace one pod on each node.
-
A
Apply the manifest:
$ oc apply -f traffic-pods.yaml
Verification
Verify that the test pods are running:
$ oc get pods -n workload -o wide
Example output
NAME READY STATUS RESTARTS AGE IP NODE NOMINATED NODE READINESS GATES traffic-test-master-7448bb5cc-mdftd 1/1 Running 0 2m10s 10.129.0.145 master-2 <none> <none> traffic-test-worker-776486fb68-krz54 1/1 Running 0 2m10s 10.128.2.9 host-worker1 <none> <none> traffic-test-worker-776486fb68-lz8vf 1/1 Running 0 2m10s 10.131.0.9 host-worker2 <none> <none> traffic-test-worker-hostnetwork-596d569d99-cjpns 1/1 Running 0 2m10s 10.0.110.11 host-worker1 <none> <none> traffic-test-worker-hostnetwork-596d569d99-x6m7r 1/1 Running 0 2m10s 10.0.110.12 host-worker2 <none> <none>
Confirm that the
traffic-test-masterpod is on a control plane node and that thetraffic-test-workerpods are distributed across different DPU-enabled worker nodes.Verify that the services are created:
$ oc get svc -n workload
Example output
NAME TYPE CLUSTER-IP EXTERNAL-IP PORT(S) AGE traffic-test-master ClusterIP 172.30.102.123 <none> 5000/TCP 13m traffic-test-master-nodeport NodePort 172.30.98.22 <none> 5000:31368/TCP 13m traffic-test-worker ClusterIP 172.30.187.147 <none> 5000/TCP 13m traffic-test-worker-hostnetwork ClusterIP 172.30.122.242 <none> 5000/TCP 13m traffic-test-worker-hostnetwork-nodeport NodePort 172.30.122.214 <none> 5000:30209/TCP 13m traffic-test-worker-nodeport NodePort 172.30.108.72 <none> 5000:32570/TCP 13m
12.7.2. Run traffic validation tests
You can run connectivity tests between the traffic test pods and services to verify that the DPU services and service chains are configured correctly. A successful test confirms that end-to-end traffic flows through the DPU data plane as expected.
Prerequisites
-
The traffic test pods and services are deployed in the
workloadnamespace and all pods are in aRunningstate. -
You have access to the management cluster as a user with the
cluster-adminrole.
Procedure
Run a ping connectivity test between pods on different worker nodes.
In the following example, replace
<worker_pod_name>with the name of atraffic-test-workerpod and replace<target_pod_ip>with the IP address of atraffic-test-workerpod on a different worker node:$ oc -n workload exec -it <worker_pod_name> -- ping -c 4 <target_pod_ip>
Example output
PING 10.131.0.9 (10.131.0.9) 56(84) bytes of data. 64 bytes from 10.131.0.9: icmp_seq=1 ttl=62 time=1.61 ms 64 bytes from 10.131.0.9: icmp_seq=2 ttl=62 time=0.876 ms 64 bytes from 10.131.0.9: icmp_seq=3 ttl=62 time=0.510 ms 64 bytes from 10.131.0.9: icmp_seq=4 ttl=62 time=0.421 ms --- 10.131.0.9 ping statistics --- 4 packets transmitted, 4 received, 0% packet loss, time 3028ms rtt min/avg/max/mdev = 0.421/0.853/1.606/0.466 ms
Verify that all 4 packets are received with 0% packet loss.
Run a service connectivity test from a worker pod to a service on a control plane node.
In the following example, replace
<worker_pod_name>with the name of atraffic-test-workerpod and replace<service_cluster_ip>with the cluster IP address of thetraffic-test-masterservice:$ oc -n workload exec -it <worker_pod_name> -- nc -vz <service_cluster_ip> 5000
A
succeededmessage confirms that the service is reachable through the DPU-accelerated network.Run a service connectivity test from a worker pod to another worker pod.
In the following example, replace
<worker_pod_name>with the name of atraffic-test-workerpod and replace<service_cluster_ip>with the cluster IP address of thetraffic-test-workerservice:$ oc -n workload exec -it <worker_pod_name> -- nc -vz <service_cluster_ip> 5000
A
succeededmessage confirms end-to-end connectivity through the DPU-accelerated service chain between worker pods.Optional: Run an external service connectivity test.
In the following example, replace
<worker_pod_name>with the name of atraffic-test-workerpod, replace<node_ip>with the IP address of a cluster node, and replace<nodeport>with the NodePort for one of the services:$ oc -n workload exec -it <worker_pod_name> -- nc -vz <node_ip> <nodeport>
A
succeededmessage confirms that NodePort services are reachable through the DPU networking stack.
12.7.3. DPU telemetry observability with DOCA Telemetry Service
The DOCA Telemetry Service (DTS) exposes DPU hardware telemetry, such as PCIe link speed, uplink throughput, packets, errors, and NIC channel activity, as Prometheus metrics. You can view these metrics by using the OpenShift Container Platform web console or a Grafana dashboard.
In a standard DPF installation, the DTS deployment objects are applied automatically during the postinstallation step. Apply them manually only when you are adding DTS to an existing cluster.
Neither the DPF Operator nor the DTS DPUService installs Grafana on OpenShift Container Platform. Red Hat does not offer a certified Grafana Operator. The community Grafana Operator from OperatorHub is the standard way to run Grafana on OpenShift Container Platform.
DTS runs on every DPU in the hosted cluster and collects counters from sysfs and ethtool providers. OpenShift Container Platform includes a built-in Prometheus instance, so you do not need to deploy a separate monitoring stack to scrape DTS metrics.
12.7.3.1. How DPF exposes DTS metrics to the management cluster
DTS runs on the DPU hosted cluster, but Prometheus runs on the management cluster. DPF bridges this gap with a built-in port-mirroring mechanism.
When a DPUService resource declares a port in its configPorts field, DPF performs the following actions:
-
Publishes the service port as a
NodePorton the DPU hosted cluster. -
Creates a mirror
Serviceon the management cluster, labeled withdpu.nvidia.com/exposed-port-for-dpucluster.
The management-cluster Prometheus then scrapes the mirror service. This mechanism requires no additional configuration beyond the standard DTS deployment objects.
12.7.3.2. DTS deployment objects
DTS is deployed through three standard DPF resources:
DPUServiceTemplate-
Defines the Helm chart for the DOCA Telemetry Service, the DTS container image, and the metrics port. The
configMapData.prometheus.portfield is set to9189. DPUServiceConfiguration-
Declares the service port
httpserverport: 9189underconfigPorts. This declaration triggers the management-cluster port-mirroring mechanism described previously. DPUDeployment-
References the template and configuration so that DTS is rolled out to the DPUs as a
DaemonSeton the DPU hosted cluster. DTS defaults to thesysfsandethtoolproviders.
12.7.4. Enable user workload monitoring for DTS
OpenShift Container Platform includes Prometheus, but by default it only monitors OpenShift Container Platform platform components. You must enable user workload monitoring so that Prometheus can scrape user namespaces where DPF and DTS run, such as dpf-operator-system.
Prerequisites
- A DPF cluster is deployed with at least one provisioned DPU.
-
You have access to the management cluster as a user with the
cluster-adminrole.
Procedure
Create a
ConfigMapto enable user workload monitoring in theopenshift-monitoringnamespace:apiVersion: v1 kind: ConfigMap metadata: name: cluster-monitoring-config namespace: openshift-monitoring data: config.yaml: | enableUserWorkload: trueNoteIf the
cluster-monitoring-configConfigMapalready exists with other settings, edit it instead of replacing it, and add only theenableUserWorkload: trueline to the existingconfig.yamldata:$ oc -n openshift-monitoring edit configmap cluster-monitoring-config
Apply the
ConfigMap:$ oc apply -f cluster-monitoring-config.yaml
Verification
Verify that the user workload monitoring pods are running in the
openshift-user-workload-monitoringnamespace:$ oc -n openshift-user-workload-monitoring get pods
Example output
NAME READY STATUS RESTARTS AGE prometheus-operator-... 1/1 Running 0 ... prometheus-user-workload-0 ... Running 0 ... thanos-ruler-user-workload-0 ... Running 0 ...
Confirm that pods named
prometheus-user-workload,thanos-ruler-user-workload, andprometheus-operatorare all in aRunningstate.
12.7.5. Configure the DTS ServiceMonitor
Create a ServiceMonitor resource to instruct the user workload monitoring Prometheus instance to scrape the DOCA Telemetry Service (DTS) metrics endpoint. The ServiceMonitor selects the mirrored DTS service in the dpf-operator-system namespace and scrapes its /metrics path on the httpserverport every 30 seconds.
Prerequisites
- User workload monitoring is enabled in OpenShift Container Platform.
The DTS
DPUServiceConfigurationandDPUDeploymentresources are applied.For details, see "DPU telemetry observability with DTS".
-
You have access to the management cluster as a user with the
cluster-adminrole.
Procedure
Create a file named
dts-servicemonitor.yamlwith the following content:apiVersion: monitoring.coreos.com/v1 kind: ServiceMonitor metadata: name: doca-telemetry-service-monitor namespace: dpf-operator-system spec: selector: matchExpressions: - key: dpu.nvidia.com/dpuservice-name operator: Exists endpoints: - port: httpserverport interval: 30s path: /metrics relabelings: - sourceLabels: - __meta_kubernetes_service_label_dpu_nvidia_com_dpuservice_name regex: doca-telemetry-service.* action: keep namespaceSelector: matchNames: - dpf-operator-systemApply the
ServiceMonitor:$ oc apply -f dts-servicemonitor.yaml
Verification
Verify that the
ServiceMonitoris created in thedpf-operator-systemnamespace:$ oc -n dpf-operator-system get servicemonitor doca-telemetry-service-monitor
Example output
NAME AGE doca-telemetry-service-monitor ...
12.7.6. Install the DTS console dashboard
You can install a DTS dashboard that integrates directly into the OpenShift Container Platform web console. This dashboard provides visibility of DPU telemetry metrics without requiring Grafana or additional tools.
Prerequisites
- User workload monitoring is enabled in OpenShift Container Platform.
-
The DTS
ServiceMonitoris configured and collecting metrics. -
You have access to the management cluster as a user with the
cluster-adminrole.
Procedure
Create a file named
dts-console-dashboard.yamlwith the following content to define a console dashboardConfigMapin theopenshift-config-managednamespace:apiVersion: v1 kind: ConfigMap metadata: name: dpf-dts-console-dashboard namespace: openshift-config-managed labels: console.openshift.io/dashboard: "true" data: doca-dpu-telemetry-dts.json: | { "title": "DOCA DPU Telemetry (DTS)", "uid": "doca-dpu-telemetry-dts-console", "editable": false, "schemaVersion": 16, "tags": ["dpf", "dpu", "dts", "telemetry"], "timezone": "browser", "time": {"from": "now-1h", "to": "now"}, "refresh": "30s", "templating": {"list": []}, "rows": [ { "title": "PCIe / Link", "showTitle": true, "height": "250px", "panels": [ { "type": "graph", "title": "PCIe Link Speed (GT/s)", "span": 6, "datasource": "prometheus", "nullPointMode": "null", "legend": {"show": true}, "yaxes": [{"format": "none", "show": true}, {"format": "none", "show": false}], "targets": [ {"refId": "A", "format": "time_series", "intervalFactor": 2, "expr": "current_link_speed", "legendFormat": "{{source}} {{hca}}"} ] }, { "type": "graph", "title": "PCIe Link Width (lanes)", "span": 6, "datasource": "prometheus", "nullPointMode": "null", "legend": {"show": true}, "yaxes": [{"format": "none", "show": true}, {"format": "none", "show": false}], "targets": [ {"refId": "A", "format": "time_series", "intervalFactor": 2, "expr": "current_link_width", "legendFormat": "{{source}} {{hca}}"} ] } ] }, { "title": "Uplink Throughput (p0/p1)", "showTitle": true, "height": "250px", "panels": [ { "type": "graph", "title": "Uplink RX (bits/s)", "span": 6, "datasource": "prometheus", "nullPointMode": "null", "legend": {"show": true, "values": true, "avg": true, "max": true, "alignAsTable": true, "rightSide": true}, "yaxes": [{"format": "bps", "show": true}, {"format": "bps", "show": false}], "targets": [ {"refId": "A", "format": "time_series", "intervalFactor": 2, "expr": "sum by(source)(rate({__name__=~\"p[01]_eth_rx_bytes\"}[5m])) * 8", "legendFormat": "{{source}}"} ] }, { "type": "graph", "title": "Uplink TX (bits/s)", "span": 6, "datasource": "prometheus", "nullPointMode": "null", "legend": {"show": true, "values": true, "avg": true, "max": true, "alignAsTable": true, "rightSide": true}, "yaxes": [{"format": "bps", "show": true}, {"format": "bps", "show": false}], "targets": [ {"refId": "A", "format": "time_series", "intervalFactor": 2, "expr": "sum by(source)(rate({__name__=~\"p[01]_eth_tx_bytes\"}[5m])) * 8", "legendFormat": "{{source}}"} ] } ] }, { "title": "Uplink Packets & Errors", "showTitle": true, "height": "250px", "panels": [ { "type": "graph", "title": "Uplink packets/s (rx + tx)", "span": 6, "datasource": "prometheus", "nullPointMode": "null", "legend": {"show": true, "alignAsTable": true, "rightSide": true}, "yaxes": [{"format": "pps", "show": true}, {"format": "pps", "show": false}], "targets": [ {"refId": "A", "format": "time_series", "intervalFactor": 2, "expr": "sum by(source)(rate({__name__=~\"p[01]_eth_rx_packets\"}[5m]))", "legendFormat": "{{source}} rx"}, {"refId": "B", "format": "time_series", "intervalFactor": 2, "expr": "sum by(source)(rate({__name__=~\"p[01]_eth_tx_packets\"}[5m]))", "legendFormat": "{{source}} tx"} ] }, { "type": "graph", "title": "Uplink errors & drops/s", "span": 6, "datasource": "prometheus", "nullPointMode": "null", "legend": {"show": true, "alignAsTable": true, "rightSide": true}, "yaxes": [{"format": "cps", "show": true}, {"format": "cps", "show": false}], "targets": [ {"refId": "A", "format": "time_series", "intervalFactor": 2, "expr": "sum by(source)(rate({__name__=~\"p[01]_eth_rx_errors\"}[5m])) + sum by(source)(rate({__name__=~\"p[01]_eth_tx_errors\"}[5m])) + sum by(source)(rate({__name__=~\"p[01]_eth_rx_dropped\"}[5m])) + sum by(source)(rate({__name__=~\"p[01]_eth_tx_dropped\"}[5m])) + sum by(source)(rate({__name__=~\"p[01]_eth_rx_crc_errors\"}[5m]))", "legendFormat": "{{source}}"} ] } ] }, { "title": "NIC Channel Activity", "showTitle": true, "height": "250px", "panels": [ { "type": "graph", "title": "NIC channel poll/s", "span": 6, "datasource": "prometheus", "nullPointMode": "null", "legend": {"show": true, "alignAsTable": true, "rightSide": true}, "yaxes": [{"format": "cps", "show": true}, {"format": "cps", "show": false}], "targets": [ {"refId": "A", "format": "time_series", "intervalFactor": 2, "expr": "sum by(source)(rate(ch_poll[5m]))", "legendFormat": "{{source}}"} ] }, { "type": "graph", "title": "NIC channel events/s", "span": 6, "datasource": "prometheus", "nullPointMode": "null", "legend": {"show": true, "alignAsTable": true, "rightSide": true}, "yaxes": [{"format": "cps", "show": true}, {"format": "cps", "show": false}], "targets": [ {"refId": "A", "format": "time_series", "intervalFactor": 2, "expr": "sum by(source)(rate(ch_events[5m]))", "legendFormat": "{{source}}"} ] } ] } ] }Apply the console dashboard:
$ oc apply -f dts-console-dashboard.yaml
Verification
Verify that the dashboard
ConfigMapis created:$ oc -n openshift-config-managed get configmap dpf-dts-console-dashboard
Example output
NAME DATA AGE dpf-dts-console-dashboard 1 ...
Access the dashboard in the OpenShift Container Platform web console:
- Navigate to Observe → Dashboards.
In the Dashboard dropdown menu, select DOCA DPU Telemetry (DTS).
The dashboard displays PCIe link speed and width, uplink throughput, packets per second, errors and drops per second, and NIC channel activity, with each DPU as its own line.
The DTS console dashboard renders against the platform Thanos or user workload monitoring Prometheus instance. No Grafana dependency is required for basic DPU telemetry viewing.
12.7.7. Install Grafana for DTS metrics visualization
You can install the Grafana Operator and a Grafana instance to provide enhanced visualization for DPU telemetry metrics, including per-DPU filtering and customizable dashboards. You can also deploy a dashboard ConfigMap that adds DTS metrics to the OpenShift Container Platform web console.
Prerequisites
- You have enabled user workload monitoring in OpenShift Container Platform.
-
You have configured the DTS
ServiceMonitorand it is collecting metrics. -
You have access to the management cluster as a user with the
cluster-adminrole. -
You have installed the
ocCLI. -
You have installed the
helmCLI.
Procedure
Install the Grafana Operator by using Helm:
$ helm upgrade -i grafana-operator oci://ghcr.io/grafana/helm-charts/grafana-operator \ --version 5.24.0 \ --namespace grafana-operator \ --create-namespaceExample output
Pulled: ghcr.io/grafana/helm-charts/grafana-operator:5.24.0 Digest: sha256:4f69cdaecfed2cc61d4e5f4a8e7142795e9b00997e4bcbd37a8c154a225a2f1f Release "grafana-operator" has been upgraded. Happy Helming! NAME: grafana-operator LAST DEPLOYED: Tue Aug 4 08:51:36 2026 NAMESPACE: grafana-operator STATUS: deployed REVISION: 2 TEST SUITE: None
Grant OpenShift Route permissions to the Grafana Operator:
The community Grafana Operator requires additional RBAC permissions to manage OpenShift Container Platform routes. Create a file named
grafana-operator-route-rbac.yamlwith the following content:apiVersion: rbac.authorization.k8s.io/v1 kind: ClusterRole metadata: name: grafana-operator-route-manager rules: - apiGroups: - route.openshift.io resources: - routes - routes/custom-host verbs: - create - delete - get - list - patch - update - watch --- apiVersion: rbac.authorization.k8s.io/v1 kind: ClusterRoleBinding metadata: name: grafana-operator-route-manager roleRef: apiGroup: rbac.authorization.k8s.io kind: ClusterRole name: grafana-operator-route-manager subjects: - kind: ServiceAccount name: grafana-operator namespace: grafana-operator
Apply the file:
$ oc apply -f grafana-operator-route-rbac.yaml
Example output
clusterrole.rbac.authorization.k8s.io/grafana-operator-route-manager created clusterrolebinding.rbac.authorization.k8s.io/grafana-operator-route-manager created
Create Grafana RBAC for Prometheus access:
Create a
ServiceAccountwith a long-lived token and bind it to thecluster-monitoring-viewClusterRoleso Grafana can query the platform Prometheus:apiVersion: v1 kind: ServiceAccount metadata: name: grafana-prometheus-reader namespace: dpf-operator-system --- apiVersion: v1 kind: Secret metadata: name: grafana-prometheus-reader-token namespace: dpf-operator-system annotations: kubernetes.io/service-account.name: grafana-prometheus-reader type: kubernetes.io/service-account-token --- apiVersion: rbac.authorization.k8s.io/v1 kind: ClusterRoleBinding metadata: name: grafana-prometheus-reader-cluster-monitoring roleRef: apiGroup: rbac.authorization.k8s.io kind: ClusterRole name: cluster-monitoring-view subjects: - kind: ServiceAccount name: grafana-prometheus-reader namespace: dpf-operator-systemApply the YAML:
$ oc apply -f grafana-rbac.yaml
Deploy the Grafana instance with control-plane scheduling:
apiVersion: grafana.integreatly.org/v1beta1 kind: Grafana metadata: name: dpf-grafana namespace: dpf-operator-system labels: dashboards: "dpf-grafana" spec: route: spec: port: targetPort: grafana tls: termination: edge config: log: mode: "console" level: "info" auth.anonymous: enabled: "true" org_role: "Viewer" security: admin_user: "admin" admin_password: "admin" deployment: spec: template: spec: nodeSelector: node-role.kubernetes.io/control-plane: "" tolerations: - key: node-role.kubernetes.io/master operator: Exists effect: NoSchedule - key: node-role.kubernetes.io/control-plane operator: Exists effect: NoScheduleApply the YAML:
$ oc apply -f grafana-cr.yaml
WarningThe default credentials (
admin/admin) are suitable for lab environments only. Change theadmin_passwordfor non-lab deployments.Configure the Prometheus datasource:
apiVersion: grafana.integreatly.org/v1beta1 kind: GrafanaDatasource metadata: name: prometheus namespace: dpf-operator-system spec: instanceSelector: matchLabels: dashboards: "dpf-grafana" valuesFrom: - targetPath: "secureJsonData.httpHeaderValue1" valueFrom: secretKeyRef: name: grafana-prometheus-reader-token key: token datasource: name: prometheus type: prometheus uid: prometheus access: proxy url: https://thanos-querier.openshift-monitoring.svc.cluster.local:9091 isDefault: true jsonData: tlsSkipVerify: true httpHeaderName1: "Authorization" timeInterval: "30s" secureJsonData: httpHeaderValue1: "Bearer ${token}"Apply the YAML:
$ oc apply -f grafana-datasource.yaml
Deploy the DTS console dashboard for OpenShift Container Platform web console integration:
apiVersion: v1 kind: ConfigMap metadata: name: dpf-dts-console-dashboard namespace: openshift-config-managed labels: console.openshift.io/dashboard: "true" data: doca-dpu-telemetry-dts.json: | { "title": "DOCA DPU Telemetry (DTS)", "uid": "doca-dpu-telemetry-dts-console", "editable": false, "schemaVersion": 16, "tags": ["dpf", "dpu", "dts", "telemetry"], "timezone": "browser", "time": {"from": "now-1h", "to": "now"}, "refresh": "30s", "templating": {"list": []}, "rows": [ { "title": "PCIe / Link", "showTitle": true, "height": "250px", "panels": [ { "type": "graph", "title": "PCIe Link Speed (GT/s)", "span": 6, "datasource": "prometheus", "nullPointMode": "null", "legend": {"show": true}, "yaxes": [{"format": "none", "show": true}, {"format": "none", "show": false}], "targets": [ {"refId": "A", "format": "time_series", "intervalFactor": 2, "expr": "current_link_speed", "legendFormat": "{{source}} {{hca}}"} ] }, { "type": "graph", "title": "PCIe Link Width (lanes)", "span": 6, "datasource": "prometheus", "nullPointMode": "null", "legend": {"show": true}, "yaxes": [{"format": "none", "show": true}, {"format": "none", "show": false}], "targets": [ {"refId": "A", "format": "time_series", "intervalFactor": 2, "expr": "current_link_width", "legendFormat": "{{source}} {{hca}}"} ] } ] }, { "title": "Uplink Throughput (p0/p1)", "showTitle": true, "height": "250px", "panels": [ { "type": "graph", "title": "Uplink RX (bits/s)", "span": 6, "datasource": "prometheus", "nullPointMode": "null", "legend": {"show": true, "values": true, "avg": true, "max": true, "alignAsTable": true, "rightSide": true}, "yaxes": [{"format": "bps", "show": true}, {"format": "bps", "show": false}], "targets": [ {"refId": "A", "format": "time_series", "intervalFactor": 2, "expr": "sum by(source)(rate({__name__=~\"p[01]_eth_rx_bytes\"}[5m])) * 8", "legendFormat": "{{source}}"} ] }, { "type": "graph", "title": "Uplink TX (bits/s)", "span": 6, "datasource": "prometheus", "nullPointMode": "null", "legend": {"show": true, "values": true, "avg": true, "max": true, "alignAsTable": true, "rightSide": true}, "yaxes": [{"format": "bps", "show": true}, {"format": "bps", "show": false}], "targets": [ {"refId": "A", "format": "time_series", "intervalFactor": 2, "expr": "sum by(source)(rate({__name__=~\"p[01]_eth_tx_bytes\"}[5m])) * 8", "legendFormat": "{{source}}"} ] } ] }, { "title": "Uplink Packets & Errors", "showTitle": true, "height": "250px", "panels": [ { "type": "graph", "title": "Uplink packets/s (rx + tx)", "span": 6, "datasource": "prometheus", "nullPointMode": "null", "legend": {"show": true, "alignAsTable": true, "rightSide": true}, "yaxes": [{"format": "pps", "show": true}, {"format": "pps", "show": false}], "targets": [ {"refId": "A", "format": "time_series", "intervalFactor": 2, "expr": "sum by(source)(rate({__name__=~\"p[01]_eth_rx_packets\"}[5m]))", "legendFormat": "{{source}} rx"}, {"refId": "B", "format": "time_series", "intervalFactor": 2, "expr": "sum by(source)(rate({__name__=~\"p[01]_eth_tx_packets\"}[5m]))", "legendFormat": "{{source}} tx"} ] }, { "type": "graph", "title": "Uplink errors & drops/s", "span": 6, "datasource": "prometheus", "nullPointMode": "null", "legend": {"show": true, "alignAsTable": true, "rightSide": true}, "yaxes": [{"format": "cps", "show": true}, {"format": "cps", "show": false}], "targets": [ {"refId": "A", "format": "time_series", "intervalFactor": 2, "expr": "sum by(source)(rate({__name__=~\"p[01]_eth_rx_errors\"}[5m])) + sum by(source)(rate({__name__=~\"p[01]_eth_tx_errors\"}[5m])) + sum by(source)(rate({__name__=~\"p[01]_eth_rx_dropped\"}[5m])) + sum by(source)(rate({__name__=~\"p[01]_eth_tx_dropped\"}[5m])) + sum by(source)(rate({__name__=~\"p[01]_eth_rx_crc_errors\"}[5m]))", "legendFormat": "{{source}}"} ] } ] }, { "title": "NIC Channel Activity", "showTitle": true, "height": "250px", "panels": [ { "type": "graph", "title": "NIC channel poll/s", "span": 6, "datasource": "prometheus", "nullPointMode": "null", "legend": {"show": true, "alignAsTable": true, "rightSide": true}, "yaxes": [{"format": "cps", "show": true}, {"format": "cps", "show": false}], "targets": [ {"refId": "A", "format": "time_series", "intervalFactor": 2, "expr": "sum by(source)(rate(ch_poll[5m]))", "legendFormat": "{{source}}"} ] }, { "type": "graph", "title": "NIC channel events/s", "span": 6, "datasource": "prometheus", "nullPointMode": "null", "legend": {"show": true, "alignAsTable": true, "rightSide": true}, "yaxes": [{"format": "cps", "show": true}, {"format": "cps", "show": false}], "targets": [ {"refId": "A", "format": "time_series", "intervalFactor": 2, "expr": "sum by(source)(rate(ch_events[5m]))", "legendFormat": "{{source}}"} ] } ] } ] }Apply the YAML:
$ oc apply -f dts-console-dashboard.yaml
Deploy the complete DTS Grafana dashboard:
apiVersion: v1 kind: ConfigMap metadata: name: dpf-dts-grafana-dashboard namespace: dpf-operator-system labels: app.kubernetes.io/part-of: dpf data: doca-dpu-telemetry-dts.json: | { "title": "DOCA DPU Telemetry (DTS)", "uid": "doca-dpu-telemetry-dts", "tags": ["dpf", "dpu", "dts", "telemetry"], "timezone": "browser", "schemaVersion": 39, "editable": true, "time": {"from": "now-1h", "to": "now"}, "refresh": "30s", "templating": { "list": [ { "name": "source", "label": "DPU (source)", "type": "query", "datasource": {"type": "prometheus", "uid": "prometheus"}, "query": "label_values(current_link_speed, source)", "refresh": 2, "includeAll": true, "multi": true, "current": {"text": "All", "value": "$__all"}, "sort": 1 } ] }, "panels": [ { "type": "stat", "title": "PCIe Link Speed (GT/s)", "datasource": {"type": "prometheus", "uid": "prometheus"}, "gridPos": {"h": 4, "w": 6, "x": 0, "y": 0}, "fieldConfig": {"defaults": {"unit": "none"}, "overrides": []}, "options": {"reduceOptions": {"calcs": ["lastNotNull"]}, "colorMode": "value", "graphMode": "none"}, "targets": [ {"refId": "A", "datasource": {"type": "prometheus", "uid": "prometheus"}, "expr": "current_link_speed{source=~\"$source\"}", "legendFormat": "{{source}} {{hca}}"} ] }, { "type": "stat", "title": "PCIe Link Width (lanes)", "datasource": {"type": "prometheus", "uid": "prometheus"}, "gridPos": {"h": 4, "w": 6, "x": 6, "y": 0}, "fieldConfig": {"defaults": {"unit": "none"}, "overrides": []}, "options": {"reduceOptions": {"calcs": ["lastNotNull"]}, "colorMode": "value", "graphMode": "none"}, "targets": [ {"refId": "A", "datasource": {"type": "prometheus", "uid": "prometheus"}, "expr": "current_link_width{source=~\"$source\"}", "legendFormat": "{{source}} {{hca}}"} ] }, { "type": "stat", "title": "Max PCIe Link Speed (GT/s)", "datasource": {"type": "prometheus", "uid": "prometheus"}, "gridPos": {"h": 4, "w": 6, "x": 12, "y": 0}, "fieldConfig": {"defaults": {"unit": "none"}, "overrides": []}, "options": {"reduceOptions": {"calcs": ["lastNotNull"]}, "colorMode": "value", "graphMode": "none"}, "targets": [ {"refId": "A", "datasource": {"type": "prometheus", "uid": "prometheus"}, "expr": "max_link_speed{source=~\"$source\"}", "legendFormat": "{{source}} {{hca}}"} ] }, { "type": "stat", "title": "Max PCIe Link Width (lanes)", "datasource": {"type": "prometheus", "uid": "prometheus"}, "gridPos": {"h": 4, "w": 6, "x": 18, "y": 0}, "fieldConfig": {"defaults": {"unit": "none"}, "overrides": []}, "options": {"reduceOptions": {"calcs": ["lastNotNull"]}, "colorMode": "value", "graphMode": "none"}, "targets": [ {"refId": "A", "datasource": {"type": "prometheus", "uid": "prometheus"}, "expr": "max_link_width{source=~\"$source\"}", "legendFormat": "{{source}} {{hca}}"} ] }, { "type": "timeseries", "title": "Uplink RX throughput (p0/p1)", "datasource": {"type": "prometheus", "uid": "prometheus"}, "gridPos": {"h": 8, "w": 12, "x": 0, "y": 4}, "fieldConfig": {"defaults": {"unit": "bps", "custom": {"drawStyle": "line", "fillOpacity": 10}}, "overrides": []}, "options": {"legend": {"displayMode": "table", "placement": "bottom", "calcs": ["mean", "max"]}, "tooltip": {"mode": "multi"}}, "targets": [ {"refId": "A", "datasource": {"type": "prometheus", "uid": "prometheus"}, "expr": "sum by(source)(rate({__name__=~\"p[01]_eth_rx_bytes\", source=~\"$source\"}[5m])) * 8", "legendFormat": "{{source}}"} ] }, { "type": "timeseries", "title": "Uplink TX throughput (p0/p1)", "datasource": {"type": "prometheus", "uid": "prometheus"}, "gridPos": {"h": 8, "w": 12, "x": 12, "y": 4}, "fieldConfig": {"defaults": {"unit": "bps", "custom": {"drawStyle": "line", "fillOpacity": 10}}, "overrides": []}, "options": {"legend": {"displayMode": "table", "placement": "bottom", "calcs": ["mean", "max"]}, "tooltip": {"mode": "multi"}}, "targets": [ {"refId": "A", "datasource": {"type": "prometheus", "uid": "prometheus"}, "expr": "sum by(source)(rate({__name__=~\"p[01]_eth_tx_bytes\", source=~\"$source\"}[5m])) * 8", "legendFormat": "{{source}}"} ] }, { "type": "timeseries", "title": "Uplink packets/s (p0/p1 rx+tx)", "datasource": {"type": "prometheus", "uid": "prometheus"}, "gridPos": {"h": 8, "w": 12, "x": 0, "y": 12}, "fieldConfig": {"defaults": {"unit": "pps", "custom": {"drawStyle": "line", "fillOpacity": 10}}, "overrides": []}, "options": {"legend": {"displayMode": "table", "placement": "bottom", "calcs": ["mean", "max"]}, "tooltip": {"mode": "multi"}}, "targets": [ {"refId": "A", "datasource": {"type": "prometheus", "uid": "prometheus"}, "expr": "sum by(source)(rate({__name__=~\"p[01]_eth_rx_packets\", source=~\"$source\"}[5m]))", "legendFormat": "{{source}} rx"}, {"refId": "B", "datasource": {"type": "prometheus", "uid": "prometheus"}, "expr": "sum by(source)(rate({__name__=~\"p[01]_eth_tx_packets\", source=~\"$source\"}[5m]))", "legendFormat": "{{source}} tx"} ] }, { "type": "timeseries", "title": "Uplink errors & drops/s (p0/p1)", "datasource": {"type": "prometheus", "uid": "prometheus"}, "gridPos": {"h": 8, "w": 12, "x": 12, "y": 12}, "fieldConfig": {"defaults": {"unit": "cps", "custom": {"drawStyle": "line", "fillOpacity": 10}}, "overrides": []}, "options": {"legend": {"displayMode": "table", "placement": "bottom", "calcs": ["max"]}, "tooltip": {"mode": "multi"}}, "targets": [ {"refId": "A", "datasource": {"type": "prometheus", "uid": "prometheus"}, "expr": "sum by(source)(rate({__name__=~\"p[01]_eth_rx_errors\", source=~\"$source\"}[5m])) + sum by(source)(rate({__name__=~\"p[01]_eth_tx_errors\", source=~\"$source\"}[5m])) + sum by(source)(rate({__name__=~\"p[01]_eth_rx_dropped\", source=~\"$source\"}[5m])) + sum by(source)(rate({__name__=~\"p[01]_eth_tx_dropped\", source=~\"$source\"}[5m])) + sum by(source)(rate({__name__=~\"p[01]_eth_rx_crc_errors\", source=~\"$source\"}[5m]))", "legendFormat": "{{source}}"} ] }, { "type": "timeseries", "title": "NIC channel poll/s", "datasource": {"type": "prometheus", "uid": "prometheus"}, "gridPos": {"h": 8, "w": 12, "x": 0, "y": 20}, "fieldConfig": {"defaults": {"unit": "cps", "custom": {"drawStyle": "line", "fillOpacity": 10}}, "overrides": []}, "options": {"legend": {"displayMode": "table", "placement": "bottom", "calcs": ["mean", "max"]}, "tooltip": {"mode": "multi"}}, "targets": [ {"refId": "A", "datasource": {"type": "prometheus", "uid": "prometheus"}, "expr": "rate(ch_poll{source=~\"$source\"}[5m])", "legendFormat": "{{source}} {{device_name}}"} ] }, { "type": "timeseries", "title": "NIC channel events/s", "datasource": {"type": "prometheus", "uid": "prometheus"}, "gridPos": {"h": 8, "w": 12, "x": 12, "y": 20}, "fieldConfig": {"defaults": {"unit": "cps", "custom": {"drawStyle": "line", "fillOpacity": 10}}, "overrides": []}, "options": {"legend": {"displayMode": "table", "placement": "bottom", "calcs": ["mean", "max"]}, "tooltip": {"mode": "multi"}}, "targets": [ {"refId": "A", "datasource": {"type": "prometheus", "uid": "prometheus"}, "expr": "rate(ch_events{source=~\"$source\"}[5m])", "legendFormat": "{{source}} {{device_name}}"} ] } ] } --- apiVersion: grafana.integreatly.org/v1beta1 kind: GrafanaDashboard metadata: name: doca-dpu-telemetry-dts namespace: dpf-operator-system spec: instanceSelector: matchLabels: dashboards: "dpf-grafana" configMapRef: name: dpf-dts-grafana-dashboard key: doca-dpu-telemetry-dts.jsonApply the YAML:
$ oc apply -f dts-grafana-dashboard.yaml
Verification
Verify that the Grafana Operator is running:
$ oc get pods -n grafana-operator
Example output
NAME READY STATUS RESTARTS AGE grafana-operator-66d8c8c7b-xyz12 1/1 Running 0 5m42s
Verify that the Grafana instance is running:
$ oc get grafana -n dpf-operator-system
Example output
NAME AGE dpf-grafana 3m15s
Verify that the Grafana pod is running on a control plane node:
$ oc get pods -n dpf-operator-system -l app.kubernetes.io/name=grafana -o wide
Example output
NAME READY STATUS RESTARTS AGE IP NODE NOMINATED NODE READINESS GATES grafana-deployment-7c8b9d-xyz12 1/1 Running 0 2m38s 10.128.0.45 master-node-1 <none> <none>
Verify the Grafana route exists:
$ oc get route -n dpf-operator-system
Example output
NAME HOST/PORT PATH SERVICES PORT TERMINATION WILDCARD dpf-grafana-route dpf-grafana-route-dpf-operator-system.apps.cluster.example.com dpf-grafana grafana edge None
Verify that the console dashboard ConfigMap exists:
$ oc get configmap dpf-dts-console-dashboard -n openshift-config-managed
Access the Grafana web interface:
Get the Grafana URL:
$ echo "https://$(oc -n dpf-operator-system get route dpf-grafana-route -o jsonpath='{.spec.host}')"Open the returned URL in a web browser. Use anonymous access (read-only) or sign in with the default credentials (
admin/admin) for editing capabilities.Navigate to the DTS dashboard:
- In Grafana, go to Dashboards and open DOCA DPU Telemetry (DTS).
- Use the DPU (source) dropdown menu to focus on a specific DPU or select All.
- Adjust the time range by using the time-range control on the dashboard toolbar. The dashboard refreshes every 30 seconds.
- Optional: In the OpenShift Container Platform web console, go to Observe → Dashboards and open DOCA DPU Telemetry (DTS) to view the console-integrated dashboard.
Review the following metrics:
- PCIe status: current and maximum link speed and width
-
Throughput: receive (RX) and transmit (TX) data rates for uplink ports
p0andp1 - Packet rates: packets-per-second statistics with RX and TX breakdown
- Error monitoring: combined error, drop, and CRC error rates
12.7.8. View DTS metrics and dashboards
After you configure the DTS ServiceMonitor, you can view DPU telemetry metrics by using the OpenShift Container Platform web console, PromQL queries, or Grafana dashboards.
Prerequisites
-
You have configured the DTS
ServiceMonitor. -
You have access to the management cluster as a user with the
cluster-adminrole. -
You have installed the
ocCLI. - Optional: You have installed Grafana for DTS metrics visualization.
Procedure
Verify that the DTS
DPUServiceis ready on the management cluster. The object name carries a generated suffix, so select it by its stable label:$ oc -n dpf-operator-system get dpuservice \ -l svc.dpu.nvidia.com/dpudeployment-service=doca-telemetry-service
Example output
NAME READY PHASE AGE doca-telemetry-service-89p28 True Success ...
A status of
READY: TrueandPHASE: Successconfirms that DTS is deployed and running.Deploy the DTS console dashboard for the OpenShift Container Platform web console:
The console dashboard provides in-console visibility of DPU performance without requiring Grafana:
apiVersion: v1 kind: ConfigMap metadata: name: dpf-dts-console-dashboard namespace: openshift-config-managed labels: console.openshift.io/dashboard: "true" data: doca-dpu-telemetry-dts.json: | { "title": "DOCA DPU Telemetry (DTS)", "uid": "doca-dpu-telemetry-dts-console", "editable": false, "schemaVersion": 16, "tags": ["dpf", "dpu", "dts", "telemetry"], "timezone": "browser", "time": {"from": "now-1h", "to": "now"}, "refresh": "30s", "templating": {"list": []}, "rows": [ { "title": "PCIe / Link", "showTitle": true, "height": "250px", "panels": [ { "type": "graph", "title": "PCIe Link Speed (GT/s)", "span": 6, "datasource": "prometheus", "nullPointMode": "null", "legend": {"show": true}, "yaxes": [{"format": "none", "show": true}, {"format": "none", "show": false}], "targets": [ {"refId": "A", "format": "time_series", "intervalFactor": 2, "expr": "current_link_speed", "legendFormat": "{{source}} {{hca}}"} ] }, { "type": "graph", "title": "PCIe Link Width (lanes)", "span": 6, "datasource": "prometheus", "nullPointMode": "null", "legend": {"show": true}, "yaxes": [{"format": "none", "show": true}, {"format": "none", "show": false}], "targets": [ {"refId": "A", "format": "time_series", "intervalFactor": 2, "expr": "current_link_width", "legendFormat": "{{source}} {{hca}}"} ] } ] }, { "title": "Uplink Throughput (p0/p1)", "showTitle": true, "height": "250px", "panels": [ { "type": "graph", "title": "Uplink RX (bits/s)", "span": 6, "datasource": "prometheus", "nullPointMode": "null", "legend": {"show": true, "values": true, "avg": true, "max": true, "alignAsTable": true, "rightSide": true}, "yaxes": [{"format": "bps", "show": true}, {"format": "bps", "show": false}], "targets": [ {"refId": "A", "format": "time_series", "intervalFactor": 2, "expr": "sum by(source)(rate({__name__=~\"p[01]_eth_rx_bytes\"}[5m])) * 8", "legendFormat": "{{source}}"} ] }, { "type": "graph", "title": "Uplink TX (bits/s)", "span": 6, "datasource": "prometheus", "nullPointMode": "null", "legend": {"show": true, "values": true, "avg": true, "max": true, "alignAsTable": true, "rightSide": true}, "yaxes": [{"format": "bps", "show": true}, {"format": "bps", "show": false}], "targets": [ {"refId": "A", "format": "time_series", "intervalFactor": 2, "expr": "sum by(source)(rate({__name__=~\"p[01]_eth_tx_bytes\"}[5m])) * 8", "legendFormat": "{{source}}"} ] } ] }, { "title": "Uplink Packets & Errors", "showTitle": true, "height": "250px", "panels": [ { "type": "graph", "title": "Uplink packets/s (rx + tx)", "span": 6, "datasource": "prometheus", "nullPointMode": "null", "legend": {"show": true, "alignAsTable": true, "rightSide": true}, "yaxes": [{"format": "pps", "show": true}, {"format": "pps", "show": false}], "targets": [ {"refId": "A", "format": "time_series", "intervalFactor": 2, "expr": "sum by(source)(rate({__name__=~\"p[01]_eth_rx_packets\"}[5m]))", "legendFormat": "{{source}} rx"}, {"refId": "B", "format": "time_series", "intervalFactor": 2, "expr": "sum by(source)(rate({__name__=~\"p[01]_eth_tx_packets\"}[5m]))", "legendFormat": "{{source}} tx"} ] }, { "type": "graph", "title": "Uplink errors & drops/s", "span": 6, "datasource": "prometheus", "nullPointMode": "null", "legend": {"show": true, "alignAsTable": true, "rightSide": true}, "yaxes": [{"format": "cps", "show": true}, {"format": "cps", "show": false}], "targets": [ {"refId": "A", "format": "time_series", "intervalFactor": 2, "expr": "sum by(source)(rate({__name__=~\"p[01]_eth_rx_errors\"}[5m])) + sum by(source)(rate({__name__=~\"p[01]_eth_tx_errors\"}[5m])) + sum by(source)(rate({__name__=~\"p[01]_eth_rx_dropped\"}[5m])) + sum by(source)(rate({__name__=~\"p[01]_eth_tx_dropped\"}[5m])) + sum by(source)(rate({__name__=~\"p[01]_eth_rx_crc_errors\"}[5m]))", "legendFormat": "{{source}}"} ] } ] }, { "title": "NIC Channel Activity", "showTitle": true, "height": "250px", "panels": [ { "type": "graph", "title": "NIC channel poll/s", "span": 6, "datasource": "prometheus", "nullPointMode": "null", "legend": {"show": true, "alignAsTable": true, "rightSide": true}, "yaxes": [{"format": "cps", "show": true}, {"format": "cps", "show": false}], "targets": [ {"refId": "A", "format": "time_series", "intervalFactor": 2, "expr": "sum by(source)(rate(ch_poll[5m]))", "legendFormat": "{{source}}"} ] }, { "type": "graph", "title": "NIC channel events/s", "span": 6, "datasource": "prometheus", "nullPointMode": "null", "legend": {"show": true, "alignAsTable": true, "rightSide": true}, "yaxes": [{"format": "cps", "show": true}, {"format": "cps", "show": false}], "targets": [ {"refId": "A", "format": "time_series", "intervalFactor": 2, "expr": "sum by(source)(rate(ch_events[5m]))", "legendFormat": "{{source}}"} ] } ] } ] }Create a file named
dts-console-dashboard.yamlwith the preceding content and apply it:$ oc apply -f dts-console-dashboard.yaml
View metrics in the OpenShift Container Platform web console.
NoteThe OpenShift Container Platform web console reads from the cluster Prometheus instance through Thanos and user workload monitoring. Grafana is not required for basic metric viewing.
To run an ad hoc query, go to Observe → Metrics in the web console, enter a DTS
PromQLquery, and click Run queries.Example query to validate DTS metrics:
current_link_speed{job=~"doca-telemetry-service.*"}You should get one series per DPU. Hover over a line to see its labels. Note the
sourcelabel, which is the DPU node name that identifies each DPU.Table 12.10. DTS
PromQLqueriesQuery Description current_link_speed{job=~"doca-telemetry-service.*"}Returns the current PCIe link speed for each DPU. Each series includes a
sourcelabel that identifies the DPU node name.rate(p0_eth_rx_bytes{job=~"doca-telemetry-service.*"}[5m]) * 8Calculates the uplink receive throughput in bits per second over a 5-minute window.
rate(ch_poll{job=~"doca-telemetry-service.*"}[5m])Calculates the NIC channel polling activity rate over a 5-minute window.
To view the console dashboard, go to Observe → Dashboards, then in the Dashboard dropdown menu, select DOCA DPU Telemetry (DTS). The dashboard displays PCIe link speed and width, uplink throughput, packets per second, errors and drops per second, and NIC channel activity, with each DPU as its own line.
Optional: View metrics in Grafana.
Grafana provides richer dashboards with per-DPU dropdown filters and customizable panels. After you install the Grafana Operator and Grafana instance, retrieve the route URL:
$ echo "https://$(oc -n dpf-operator-system get route dpf-grafana-route -o jsonpath='{.spec.host}')"Open the outputted URL in a browser. Anonymous access provides read-only viewer permissions. To edit dashboards, click Sign in and use
admin/adminas the default credentials set in the Grafana custom resource.ImportantChange the default Grafana credentials for non-lab clusters.
In Grafana, go to Dashboards and open DOCA DPU Telemetry (DTS). Use the DPU (source) dropdown menu to focus on a specific DPU or select All. Adjust the time range by using the time-range control on the dashboard toolbar. The dashboard refreshes every 30 seconds.
Optional: Review DPF framework dashboards in Grafana.
The DPF Operator installs framework dashboards that track DPU lifecycle and control-plane health separately from the DTS hardware telemetry dashboard. These dashboards are loaded into Grafana automatically through
GrafanaDashboardresources created fromConfigMaps.Table 12.11. DPF framework dashboards
Dashboard Description DOCA Platform DPU Fleet Health
Fleet-wide DPU health, provisioning state, and version distribution.
DOCA Platform DPU Health Detail
Per-DPU status, conditions, and history timelines.
DOCA Platform Framework State
Inventory and readiness of every DPF resource type.
DOCA Platform Framework Performance
Time for DPF resources to reach their conditions, including reconcile and provisioning timings.
Controller Runtime
DPF controller internals: CPU and memory usage, reconcile rates, queues, and errors.
12.8. Troubleshoot DPF
You can diagnose and resolve common NVIDIA DPF Operator issues with DPU provisioning, hosted cluster readiness, networking, and collect diagnostic logs for support. These procedures complement the official NVIDIA debugging tools and guides.
12.8.1. DPU provisioning does not start
If DPU provisioning does not start immediately after you add worker nodes to the management cluster, verify that certificate signing requests (CSRs), controller pods, Node Feature Discovery (NFD) labels, and DPF resource objects are in the correct state.
- Verify that all worker CSRs are approved
Run the following command to list the CSR status on the management cluster:
$ oc get csr
Ensure that all CSRs for the worker nodes show an
Approvedstatus.- Verify that all DPF controller pods are running
Run the following command to check the status of the DPF Operator pods:
$ oc get pod -n dpf-operator-system
Ensure that all pods are in a
Runningstate.- Verify that worker nodes are labeled for DPU provisioning by NFD
Run the following command to confirm that the
dpu-enabledlabel is present on the worker nodes:$ oc get nodes -l feature.node.kubernetes.io/dpu-enabled=""
The output lists the worker nodes that NFD has labeled for DPU provisioning. For example:
Example output
NAME STATUS ROLES AGE VERSION host-worker1 NotReady worker,worker-dpu 62s v1.35.6 host-worker2 NotReady worker,worker-dpu 66s v1.35.6
- Check BFB object status
Run the following command to verify that the BlueField Bootstream File (BFB) image is downloaded and ready:
$ oc describe bfb -n dpf-operator-system bf-bundle
Check the
status.conditionsfield for download progress and any error messages.- Verify that the BFB image URL is reachable
If the BFB download fails, run the following command to confirm that the image URL is reachable, replacing
$BFB_URLwith the image URL:$ curl -I $BFB_URL
Ensure that the response returns a
200 OKstatus code. If the download fails, verify network connectivity to the image registry, check for firewall or proxy restrictions, and ensure that sufficient disk space is available on the node.- Monitor DPU provisioning progress
Run the following command to watch the DPU objects progress through provisioning:
$ oc get dpu -n dpf-operator-system -w
Wait for each DPU to progress from
PendingtoProvisioningtoReady.- Verify that the DPU hardware is detected on the worker node
Open a debug shell on the worker node:
$ oc debug node/<worker-node-name>
Inside the debug shell, run the following commands to confirm that a BlueField device is present:
sh-5.1# chroot /host
sh-5.1# lspci | grep -i mellanox
If the DPU is not listed, verify that it is properly seated in the PCIe slot and that it is not disabled in the server BIOS.
- Verify DPU firmware and software compatibility
Inside the debug shell, run the following command to check the DPU firmware version:
sh-5.1# mlxfwmanager --query
Confirm that the BlueField firmware and DOCA software versions on the DPU are compatible with the DPF Operator version that you deployed.
- Check
DPUDeploymentobject status Inspect the
DPUDeploymentobject for information about the following resources:- BFB object state
-
DPUServiceTemplateobjects state -
DPUServiceConfigurationobjects state
Run the following command to view the full
DPUDeploymentstatus:$ oc get dpudeployments -n dpf-operator-system dpudeployment -o yaml
Alternatively, run the following
dpfctlcommand for a summarized view:$ oc -n dpf-operator-system exec deploy/dpf-operator-controller-manager -- /dpfctl describe dpudeployments
12.8.2. DPU objects remain in the DPU Cluster Config state
If DPU objects remain in a DPU Cluster Config state and do not progress, the hosted cluster might have pending certificate signing requests (CSRs) that must be approved.
- Check for pending CSRs in the hosted cluster
Switch to the hosted cluster context and check for any pending CSRs:
$ export KUBECONFIG=<path_to_hosted_cluster_kubeconfig>
$ oc get csr
Review the output and approve any CSRs that show a
Pendingstatus.
12.8.3. Management cluster nodes do not become ready
If management cluster nodes do not reach a Ready state after DPU provisioning completes, the OVN-Kubernetes CNI pods might not be running correctly on the management cluster or the hosted cluster.
- Check OVN-Kubernetes pods on the management cluster
Switch to the management cluster context and verify that all OVN-Kubernetes pods are running on the x86_64 worker nodes and control plane nodes:
$ export KUBECONFIG=<path_to_management_cluster_kubeconfig>
$ oc get pods -n openshift-ovn-kubernetes -o wide
- Check OVN-Kubernetes pods on the hosted cluster
Switch to the hosted cluster context and verify that all OVN-Kubernetes pods are running on the DPU workers:
$ export KUBECONFIG=<path_to_hosted_cluster_kubeconfig>
$ oc get pods -n openshift-ovn-kubernetes -o wide
Ensure that all pods in the
openshift-ovn-kubernetesnamespace are in aRunningstate on both clusters.
12.8.4. DPU provisioning fails with BMC certificate errors
If DPU provisioning fails with certificate errors when you add worker nodes by using the Bare Metal Operator, the baseboard management controller (BMC) certificates might be untrusted or expired, or the BareMetalHost credentials might be incorrect.
- Verify BMC certificate validity
Run the following command to inspect the BMC TLS certificate, replacing
<bmc_ip>with the BMC IP address and<bmc_hostname>with the BMC hostname:$ openssl s_client -connect <bmc_ip>:443 -servername <bmc_hostname>
Update the certificates in the BMC configuration if they are expired or untrusted.
- Verify BareMetalHost BMC credentials
-
Ensure that the
BareMetalHostresource references the correct BMC secret and connection details, including the Redfish address and credentials for the worker server.
12.8.5. Worker node CSR approval fails
If certificate signing request (CSR) approval for worker nodes fails, network connectivity between the management cluster and the DPU or hosted cluster path might be incomplete.
- Check Host-Based Networking pods on worker nodes
Run the following command to verify that HBN pods are running:
$ oc get pods -n openshift-hbn -o wide
- Verify DPU management network connectivity
From a management cluster node, ping the DPU management IP address:
$ ping <dpu_management_ip>
- Verify the
br-exbridge on worker nodes -
Confirm that the
br-exbridge that the workerMachineConfigresource creates is present and that required firewall rules allow traffic on the DPU management and high-speed networks.
12.8.6. DPU nodes remain NotReady in the hosted cluster
If DPU nodes remain in a NotReady state in the hosted cluster, DPU provisioning might be incomplete, or the DPU firmware and DOCA software versions might be incompatible with the DPF Operator version.
- Check DPU and DPU service status on the management cluster
Run the following commands:
$ oc get dpu -n dpf-operator-system
$ oc get dpuservice -n dpf-operator-system
- Verify node status in the hosted cluster
Switch to the hosted cluster kubeconfig and list the nodes:
$ export KUBECONFIG=<path_to_hosted_cluster_kubeconfig>
$ oc get nodes
- Check DPF Operator and related pod logs
On the management cluster, inspect logs from DPF-related pods for provisioning or networking errors:
$ oc logs -n dpf-operator-system <dpu_related_pod_name>
- Verify firmware and software compatibility
- Confirm that the BlueField firmware and DOCA software versions on the DPU are compatible with the DPF Operator version that you deployed.
12.8.7. Troubleshoot hosted cluster issues
You can diagnose and resolve DPU hosted cluster issues, including CSR approval failures, kubeconfig access problems, and worker node join failures.
Prerequisites
- The DPF HCP Provisioner is installed and configured.
- DPU provisioning has completed on the management cluster.
- You have access to kubeconfig files for both the management cluster and the hosted cluster.
Procedure
Verify that the hosted cluster is accessible by running the following commands:
$ export KUBECONFIG=/path/to/hosted-cluster.kubeconfig
$ oc cluster-info
If the hosted cluster API server is not accessible, check the hosted control planes status on the management cluster.
Switch to the management cluster context and verify that the hosted control plane components are running:
$ export KUBECONFIG=/path/to/management-cluster.kubeconfig
$ oc get pods -n clusters-$HOSTED_CLUSTER_NAME
Verify that the
etcd,kube-apiserver,kube-controller-manager, andkube-schedulerpods are all in aRunningstate.Check the DPF HCP Provisioner status for any error conditions:
$ oc get dpfhcpprovisioner -n dpf-operator-system -o yaml
Review the
status.conditionsfield for any conditions that indicate a failure.Return to the hosted cluster context and check for pending CSRs:
$ export KUBECONFIG=/path/to/hosted-cluster.kubeconfig
$ oc get csr --sort-by=.metadata.creationTimestamp
Example output
NAME AGE SIGNERNAME REQUESTOR CONDITION csr-abc12 30s kubernetes.io/kubelet-serving system:node:dpu-worker1 Pending csr-def34 25s kubernetes.io/kube-apiserver-client-kubelet system:bootstrap:abc123 Pending
Approve any pending CSRs. To approve a single CSR, run the following command, replacing
<csr-name>with the CSR name:$ oc adm certificate approve <csr-name>
To approve all pending CSRs in a single command, run:
$ oc get csr -o name | xargs oc adm certificate approve
Verify that the DPU workers are joining the hosted cluster:
$ oc get nodes
Example output
NAME STATUS ROLES AGE VERSION dpu-worker1 Ready worker 5m v1.35.6 dpu-worker2 Ready worker 5m v1.35.6
If nodes are not joining, check whether the bootstrap token is still valid by running the following command on the hosted cluster:
$ oc get secrets -n kube-system | grep bootstrap-token
Bootstrap tokens have a limited lifetime. The DPF HCP Provisioner should create new tokens automatically. If tokens are expired and not being renewed, check the provisioner logs for errors.
Check the kubelet logs on the DPU for authentication or certificate errors. Switch to the management cluster context and open a debug shell on the DPU-enabled worker node:
$ export KUBECONFIG=/path/to/management-cluster.kubeconfig
$ oc debug node/<dpu-enabled-worker-node>
Inside the debug shell, run the following commands to stream the kubelet logs:
sh-5.1# chroot /host
sh-5.1# journalctl -u kubelet -f
Look for authentication errors or certificate-related failures in the log output.
Verify that OVN-Kubernetes is running correctly on the hosted cluster. Switch to the hosted cluster context and run the following command:
$ export KUBECONFIG=/path/to/hosted-cluster.kubeconfig
$ oc get pods -n openshift-ovn-kubernetes -o wide
Ensure that OVN-Kubernetes pods are running on the DPU ARM cores.
Troubleshooting
CSR approval failures: Verify that the DPF HCP Provisioner has the required RBAC permissions to approve CSRs, check the provisioner logs for certificate-related errors, and ensure that the cluster CA is configured correctly.
Node join failures: Verify that the bootstrap kubeconfig was correctly generated by the provisioner, check network connectivity between the DPUs and the hosted control plane API server, and ensure that the kubelet configuration includes the correct API server endpoint.
Control plane access issues: Verify that the hosted cluster virtual IP address is configured and accessible, check the LoadBalancer service status for the hosted API server, and ensure that MetalLB is correctly configured and announcing the VIP.
Network connectivity problems: Verify the VTEP network configuration between DPUs, check that the DPU high-speed network interfaces are operational, and ensure that the required ports are open for inter-DPU communication.
12.8.8. Troubleshoot DPF networking issues
You can diagnose and resolve DPF networking issues, including OVN-Kubernetes configuration problems, MTU mismatches, and connectivity failures.
Prerequisites
- DPU provisioning completed successfully.
- The hosted cluster is accessible with DPU worker nodes joined.
- You have access to both management and hosted cluster contexts.
Procedure
Verify OVN-Kubernetes pod status on the management cluster:
$ export KUBECONFIG=/path/to/management-cluster.kubeconfig
$ oc get pods -n openshift-ovn-kubernetes -o wide
Check that the following pods are running:
-
ovnkube-control-plane-*pods are running on control plane nodes only. -
ovnkube-node-*pods are running on all nodes. -
ovs-node-*pods are running on all nodes.
-
Check OVN-Kubernetes configuration on the hosted cluster:
$ export KUBECONFIG=/path/to/hosted-cluster.kubeconfig
$ oc get pods -n openshift-ovn-kubernetes -o wide
Verify that OVN-Kubernetes pods are running on DPU ARM cores, not on host x86 CPUs.
Verify the network MTU configuration:
$ oc get network.operator.openshift.io cluster -o yaml | grep -A 5 defaultNetwork
Check the following MTU values:
- Standard networks: MTU 1400 for pods, 1500 for nodes.
- Jumbo frame networks: MTU 8940 for pods, 9000 for nodes.
Test basic pod-to-pod connectivity:
$ export KUBECONFIG=/path/to/hosted-cluster.kubeconfig
$ oc run test-pod-1 --image=nicolaka/netshoot --rm -it -- /bin/bash
From another terminal, run:
$ oc run test-pod-2 --image=nicolaka/netshoot --rm -it -- /bin/bash
Test connectivity between the pods by using cluster IP addresses.
Check VTEP network configuration:
$ export KUBECONFIG=/path/to/management-cluster.kubeconfig
$ oc debug node/<dpu-enabled-worker-node>
In the debug shell, run:
$ chroot /host
$ ip addr show | grep $VTEP_CIDR
Verify that VTEP interfaces are configured with the correct IP addresses from the
VTEP_CIDRrange.Test VTEP connectivity:
$ ping -c 4 <other-dpu-vtep-ip>
If the ping fails, check routing and firewall rules between DPU nodes.
Verify OVN database connectivity:
$ export KUBECONFIG=/path/to/hosted-cluster.kubeconfig
$ oc exec -n openshift-ovn-kubernetes <ovnkube-node-pod> -- ovn-nbctl show
The output should display the OVN logical network topology.
Check OVN-Kubernetes log errors:
$ oc logs -n openshift-ovn-kubernetes <ovnkube-node-pod> -c ovn-controller
Look for the following error types:
- Database connectivity issues
- Port binding failures
- Flow programming errors
Verify service mesh connectivity:
$ export KUBECONFIG=/path/to/hosted-cluster.kubeconfig
$ oc create service clusterip test-svc --tcp=80:80
$ oc run test-client --image=nicolaka/netshoot --rm -it -- nc -vz test-svc 80
A successful connection indicates that service traffic is flowing through the DPU data plane.
Check the SR-IOV network device plugin:
$ export KUBECONFIG=/path/to/management-cluster.kubeconfig
$ oc get sriovnetworknodepolicy -n openshift-sriov-network-operator
Verify that SR-IOV policies are correctly applied to DPU-enabled worker nodes.
Troubleshooting
OVN-Kubernetes pod failures
Check that the OVN Helm chart version is compatible with your OpenShift Container Platform version. Verify that the CNI configuration matches the DPU acceleration requirements. Ensure that OVN databases are accessible from the DPU worker nodes.
MTU mismatch issues
Verify that all network components use consistent MTU values. Check that the physical network infrastructure supports the configured MTU. Update MTU values if the network environment has changed.
VTEP connectivity problems
Verify that the VTEP CIDR does not conflict with existing network ranges. Check that routing is configured between DPU nodes. Ensure that firewalls allow VTEP traffic on the required ports.
Service connectivity failures
Verify that kube-proxy is correctly configured on DPU nodes. Check that iptables rules are correctly programmed. Ensure that DPU acceleration is correctly handling service traffic.
SR-IOV configuration issues
Verify that the SR-IOV Operator is compatible with the DPU firmware. Check that the VF count matches the configured value. Ensure that VFs are correctly allocated to the correct namespaces.
12.8.9. DPF diagnostic commands and log collection
You can run diagnostic commands and collect logs to investigate DPF component status, DPU provisioning failures, and hosted cluster issues when troubleshooting or opening support cases.
12.8.9.1. Quick status overview commands
The following commands provide a quick overview of DPF component status:
DPF resource status
$ oc get dpudeployment,dpuservicetemplate,dpuserviceconfiguration,bfb,dpu -n dpf-operator-system
DPF Operator pod status
$ oc get pods -n dpf-operator-system -l app.kubernetes.io/part-of=dpf-operator
DPU-enabled worker node status
$ oc get nodes -l feature.node.kubernetes.io/dpu-enabled="" \ -o custom-columns=NAME:.metadata.name,STATUS:.status.conditions[?(@.type=="Ready")].status,AGE:.metadata.creationTimestamp
Hosted cluster status (if using HCP Provisioner)
$ oc get hostedcluster -n clusters-$HOSTED_CLUSTER_NAME
+
$ oc get nodepool -n clusters-$HOSTED_CLUSTER_NAME
12.8.9.2. Detailed diagnostic commands
DPU provisioning status
$ oc describe dpu -n dpf-operator-system
+
$ oc describe bfb -n dpf-operator-system bf-bundle
DPF Operator configuration
$ oc get dpfoperatorconfig -n dpf-operator-system -o yaml
Service template and configuration status
$ oc describe dpuservicetemplate -n dpf-operator-system
+
$ oc describe dpuserviceconfiguration -n dpf-operator-system
DPU service status
$ oc get dpuservice -n dpf-operator-system -o wide
+
$ oc describe dpuservice -n dpf-operator-system
Node Feature Discovery status
$ oc get nodefeaturerule -n openshift-nfd
+
$ oc describe node <worker-node> | grep -A 20 "Labels:"
12.8.9.3. Log collection commands
DPF Operator logs
$ oc logs -n dpf-operator-system -l app.kubernetes.io/name=dpf-operator --tail=200 > dpf-operator.log
HCP Provisioner logs (if using hosted clusters)
$ oc logs -n dpf-operator-system -l app.kubernetes.io/name=dpfhcp-provisioner-operator --tail=200 > dpfhcp-provisioner.log
Worker node kubelet logs
$ oc debug node/<dpu-worker-node>
+ In the debug shell, run:
+
$ chroot /host
+
$ journalctl -u kubelet --since "1 hour ago" > kubelet.log
OVN-Kubernetes logs
$ oc logs -n openshift-ovn-kubernetes -l app=ovnkube-node --tail=100 > ovn-kubernetes.log
SR-IOV Network Operator logs
$ oc logs -n openshift-sriov-network-operator -l app=sriov-network-operator --tail=100 > sriov-operator.log
Node Feature Discovery logs
$ oc logs -n openshift-nfd -l app=nfd-worker --tail=100 > nfd.log
12.8.9.4. System information collection
Hardware information
$ oc debug node/<dpu-worker-node>
+ In the debug shell, run:
+
$ lspci | grep -i mellanox
+
$ lshw -class network
+
$ dmidecode -t system
DPU firmware information
$ mlxfwmanager --query
+
$ mst status
Network interface information
$ ip addr show
+
$ ip route show
+
$ ethtool -i <interface>
12.8.9.5. Performance monitoring commands
DPU service metrics
$ oc exec -n dpf-operator-system <dts-service-pod> -- \ curl -s localhost:9189/metrics | grep -E "(current_link_speed|p[01]_eth_)"
Container resource usage
$ oc adm top pods -n dpf-operator-system --containers
+
$ oc adm top nodes -l feature.node.kubernetes.io/dpu-enabled=""
12.8.9.6. Support information package
When opening a support case, collect the following information:
Environment information
- OpenShift Container Platform cluster version and build
- DPF Operator version and configuration
- Hardware specifications (server model, DPU model, firmware versions)
- Network topology and configuration
Configuration files
-
DPF Operator configuration (
dpfoperatorconfig) - Service templates and configurations
- Network policies and configurations
- Environment variables used during installation
Log files
- DPF Operator logs (past 24 hours)
- Worker node system logs (past 4 hours)
- Kubernetes event logs related to DPF resources
- Application logs for affected services
12.8.9.7. Common log analysis patterns
Look for the following patterns in logs when troubleshooting:
DPU provisioning issues:
-
Error downloading BFB image -
Failed to detect DPU hardware -
Provisioning timeout exceeded
Networking issues:
-
OVN database connection failed -
Failed to program flows -
Interface binding failed
Service deployment issues:
-
Image pull failed -
Insufficient resources -
ConfigMap not found
Authentication issues:
-
Certificate signing request denied -
Unauthorized access to API server -
Token validation failed