Building applications
Configuring Red Hat OpenShift Service on AWS for your applications
Abstract
Chapter 1. Building applications overview
You can organize workloads into isolated projects and streamline your application lifecycle by using the web console or command-line interface (CLI) to create, manage, and deploy applications in Red Hat OpenShift Service on AWS.
1.1. Working on a project
Manage the complete lifecycle of isolated projects, from initial provisioning to user access control, to securely organize applications across your cluster.
After you create the project, you can grant or revoke access to a project and manage cluster roles for the users. You can also edit the project configuration resource while creating a project template that is used for automatic provisioning of new projects.
As a user with dedicated administrator permissions, you can choose to prevent an authenticated user group from self-provisioning new projects.
1.2. Working on an application
Manage your complete application lifecycle by creating, maintaining, and deploying software by using the web console, CLI, or Operators to optimize cluster resources and minimize downtime.
- Creating an application
To create applications, you must have created a project or have access to a project with the appropriate roles and permissions. You can create an application by using either installed Operators, or the OpenShift CLI (
oc). You can source the applications to be added to the project from Git, JAR files, devfiles, or the developer catalog.You can also use components that include source or binary code, images, and templates to create an application by using the OpenShift CLI (
oc). With the Red Hat OpenShift Service on AWS web console, you can create an application from an Operator installed by a cluster administrator.- Maintaining an application
After you create the application, you can use the web console to monitor your project or application metrics. You can also edit or delete the application using the web console.
When the application is running, not all application resources are used. As a cluster administrator, you can choose to idle these scalable resources to reduce resource consumption.
- Deploying an application
You can deploy your application using
DeploymentorDeploymentConfigobjects and manage them from the web console. You can create deployment strategies that help reduce downtime during a change or an upgrade to the application.You can also use Helm, a software package manager that simplifies deployment of applications and services to Red Hat OpenShift Service on AWS clusters.
1.3. Additional resources
- Working with projects
- Customizing the available cluster roles using the web console
- Configuring project creation
- Disabling project self-provisioning
- Creating applications from installed Operators
- Creating applications by using the CLI
- Understanding deployments
- Managing deployment processes
- Using deployment strategies
- Idling applications
- Understanding Helm
Chapter 2. Projects
2.1. Working with projects
A project allows a community of users to organize and manage their content in isolation from other communities.
Projects starting with openshift- and kube- are default projects. These projects host cluster components that run as pods and other infrastructure components. As such, Red Hat OpenShift Service on AWS does not allow you to create projects starting with openshift- or kube- using the oc new-project command. Cluster administrators can create these projects using the oc adm new-project command.
Do not run workloads in or share access to default projects. Default projects are reserved for running core cluster components.
The following default projects are considered highly privileged: default, kube-public, kube-system, openshift, openshift-infra, openshift-node, and other system-created projects that have the openshift.io/run-level label set to 0 or 1. Functionality that relies on admission plugins, such as pod security admission, security context constraints, cluster resource quotas, and image reference resolution, does not work in highly privileged projects.
You can complete the following tasks on either the Red Hat OpenShift Service on AWS web console or the OpenShift CLI (oc):
- Create a project in your cluster.
- View a project.
- Check the status of a project.
- Delete a project.
When you delete a project, the server updates the project status to Terminating from Active. The server then clears all content from a project that is in the Terminating state before finally removing the project. While a project is in Terminating status, you cannot add new content to the project.
2.1.1. Creating a project by using the web console
You can use the Red Hat OpenShift Service on AWS web console to create a project in your cluster.
Projects starting with openshift- and kube- are considered critical by Red Hat OpenShift Service on AWS. As such, Red Hat OpenShift Service on AWS does not allow you to create projects starting with openshift- using the web console.
Prerequisites
- You have the appropriate roles and permissions to create projects, applications, and other workloads in Red Hat OpenShift Service on AWS.
Procedure
If you are using the Administrator perspective:
- Navigate to Home → Projects.
Click Create Project:
-
In the Create Project dialog box, enter a unique name, such as
myproject, in the Name field. - Optional: Add the Display name and Description details for the project.
Click Create.
The dashboard for your project is displayed.
-
In the Create Project dialog box, enter a unique name, such as
- Optional: Select the Details tab to view the project details.
-
Optional: If you have adequate permissions for a project, you can use the Project Access tab to provide or revoke
admin,edit, andviewprivileges for the project.
If you are using the Developer perspective:
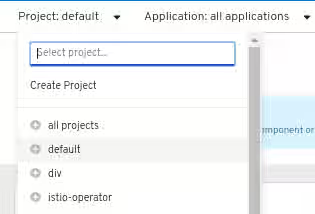
Click the Project menu and select Create Project:
Figure 2.1. Create project
-
In the Create Project dialog box, enter a unique name, such as
myproject, in the Name field. - Optional: Add the Display name and Description details for the project.
- Click Create.
-
In the Create Project dialog box, enter a unique name, such as
- Optional: Use the left navigation panel to navigate to the Project view and see the dashboard for your project.
- Optional: In the project dashboard, select the Details tab to view the project details.
- Optional: If you have adequate permissions for a project, you can use the Project Access tab of the project dashboard to provide or revoke admin, edit, and view privileges for the project.
Additional resources
2.1.2. Creating a project by using the CLI
If your cluster administrator has provided you with the required permissions, you can create a new project.
Projects starting with openshift- and kube- are considered critical by Red Hat OpenShift Service on AWS. Red Hat OpenShift Service on AWS does not allow you to create projects that start with openshift- or kube- by using the oc new-project command. Cluster administrators can create these projects by using the oc adm new-project command.
Procedure
To create a project, enter the following command:
$ oc new-project <project_name> \ --description="<description>" --display-name="<display_name>"The following example uses actual values:
$ oc new-project hello-openshift \ --description="This is an example project" \ --display-name="Hello OpenShift"NoteThe number of projects that you can create After your limit is reached, you might have to delete an existing project to create a new one.
2.1.3. Viewing a project by using the web console
You can view the projects that you have access to by using the Red Hat OpenShift Service on AWS web console.
Starting with Red Hat OpenShift Service on AWS 4.19, the perspectives in the web console have unified. The Developer perspective is no longer enabled by default.
All users can interact with all Red Hat OpenShift Service on AWS web console features. However, if you are not the cluster owner, you might need to request permission to access certain features from the cluster owner.
You can still enable the Developer perspective. On the Getting Started pane in the web console, you can take a tour of the console, find information on setting up your cluster, view a quick start for enabling the Developer perspective, and follow links to explore new features and capabilities.
See also, "Enabling the Developer perspective in the web console".
Procedure
If you are logged in as an administrator, complete the following steps:
- Navigate to Home → Projects in the navigation menu.
- Select a project to view. The Overview tab includes a dashboard for your project.
- Select the Details tab to view the project details.
- Select the YAML tab to view and update the YAML configuration for the project resource.
- Select the Workloads tab to see workloads in the project.
- Select the RoleBindings tab to view and create role bindings for your project.
If you are logged in as a developer, complete the following steps:
- Navigate to the Project page in the navigation menu.
- Select All Projects from the Project drop-down menu at the top of the screen to list all of the projects in your cluster.
- Select a project to view.
- Select the Details tab to view the project details.
- If you have adequate permissions for a project, select the Project access tab to view and update the privileges for the project.
2.1.4. Viewing a project using the CLI
When viewing projects, you are restricted to seeing only the projects you have access to view based on the authorization policy.
Procedure
To view a list of projects, enter the following command:
$ oc get projects
To change from the current project to a different project for CLI operations, enter the following command. The specified project is then used in all subsequent operations that manipulate project-scoped content.
$ oc project <project_name>
2.1.5. Providing access permissions to your project using the Developer perspective
You can use the Project view in the Developer perspective to grant or revoke access permissions to your project. You can add users to your project and provide them with Admin, Edit, or View access.
Prerequisites
- You have created a project.
Procedure
- In the Developer perspective, navigate to the Project page.
- Select your project from the Project menu.
- Select the Project Access tab.
Click Add access to add a new row of permissions to the default ones.
Figure 2.2. Project permissions
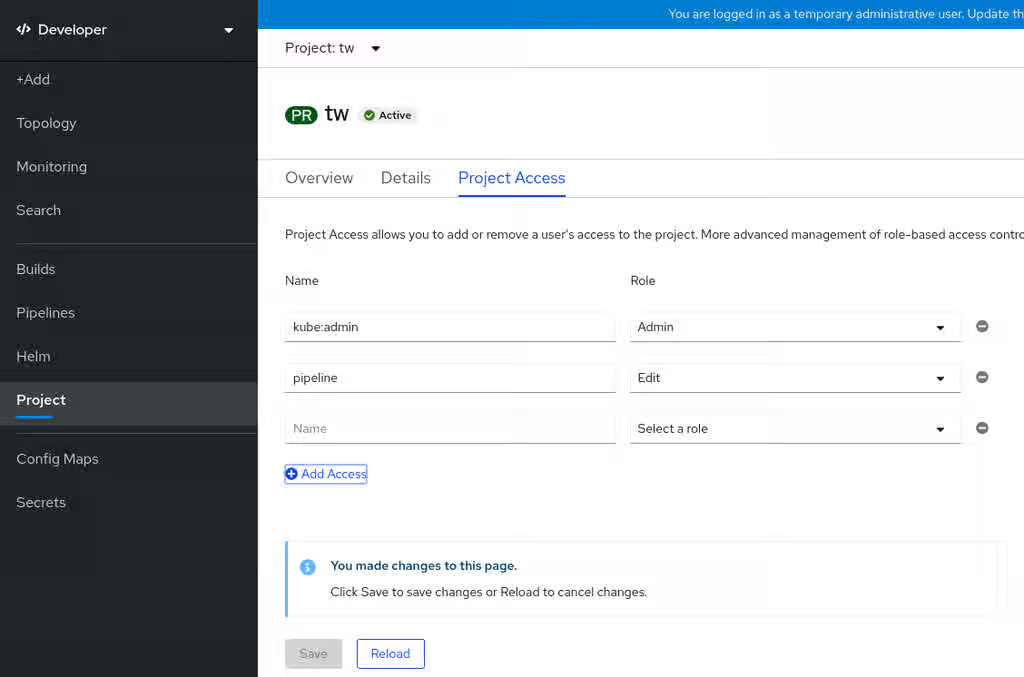
- Enter the user name, click the Select a role drop-down list, and select an appropriate role.
- Click Save to add the new permissions.
Optional: You can complete any of the following additional tasks:
- The Select a role drop-down list, to modify the access permissions of an existing user.
The Remove Access icon, to completely remove the access permissions of an existing user to the project.
NoteAdvanced role-based access control is managed in the Roles and Roles Binding views in the Administrator perspective.
2.1.6. Customizing the available cluster roles using the web console
In the Developer perspective of the web console, the Project → Project access page enables a project administrator to grant roles to users in a project. By default, the available cluster roles that can be granted to users in a project are admin, edit, and view.
As a cluster administrator, you can define which cluster roles are available in the Project access page for all projects cluster-wide. You can specify the available roles by customizing the spec.customization.projectAccess.availableClusterRoles object in the Console configuration resource.
Prerequisites
-
You have access to the cluster as a user with the
cluster-adminrole.
Procedure
- In the Administrator perspective, navigate to Administration → Cluster settings.
- Click the Configuration tab.
-
From the Configuration resource list, select Console
operator.openshift.io. - Navigate to the YAML tab to view and edit the YAML code.
In the YAML code under
spec, customize the list of available cluster roles for project access. The following example specifies the defaultadmin,edit, andviewroles:apiVersion: operator.openshift.io/v1 kind: Console metadata: name: cluster # ... spec: customization: projectAccess: availableClusterRoles: - admin - edit - view-
Click Save to save the changes to the
Consoleconfiguration resource.
Verification
- In the Developer perspective, navigate to the Project page.
- Select a project from the Project menu.
- Select the Project access tab.
-
Click the menu in the Role column and verify that the available roles match the configuration that you applied to the
Consoleresource configuration.
2.1.7. Adding to a project
You can add items to your project by using the +Add page.
Prerequisites
- You have created a project.
Procedure
- Navigate to the +Add page.
- Select your project from the Project menu.
Click an item on the +Add page and then follow the workflow.
NoteYou can also use the search feature in the +Add page to find additional items to add to your project. Click + under Add at the top of the page and type the name of a component in the search field.
2.1.8. Checking project status by using the web console
You can review the status of your project by using the web console.
Prerequisites
- You have created a project.
Procedure
- Navigate to Home → Projects.
- Select a project from the list.
- Review the project status in the Overview page.
2.1.9. Checking project status by using the CLI
You can review the status of your project by using the OpenShift CLI (oc).
Prerequisites
-
You have installed the OpenShift CLI (
oc). - You have created a project.
Procedure
Switch to your project:
$ oc project <project_name>
-
Replace
<project_name>with the name of your project.
-
Replace
Obtain a high-level overview of the project:
$ oc status
2.1.10. Deleting a project by using the web console
You can delete a project by using the web console.
Prerequisites
- You have created a project.
- You have the required permissions to delete the project.
Procedure
If you are using the Administrator perspective, complete the following steps:
- Navigate to Home → Projects.
- Select a project from the list.
Click the Actions drop-down menu for the project and select Delete Project.
NoteThe Delete Project option is not available if you do not have the required permissions to delete the project.
- In the Delete Project? pane, confirm the deletion by entering the name of your project.
- Click Delete.
If you are using the Developer perspective, complete the following steps:
- Navigate to the Project page.
- Select the project that you want to delete from the Project menu.
Click the Actions drop-down menu for the project and select Delete Project.
NoteIf you do not have the required permissions to delete the project, the Delete Project option is not available.
- In the Delete Project? pane, confirm the deletion by entering the name of your project.
- Click Delete.
2.1.11. Deleting a project by using the CLI
You can delete a project by using the OpenShift CLI (oc).
Prerequisites
-
You have installed the OpenShift CLI (
oc). - You have created a project.
- You have the required permissions to delete the project.
Procedure
Delete your project by entering the following command:
$ oc delete project <project_name>
-
Replace
<project_name>with the name of the project that you want to delete.
-
Replace
2.1.12. Additional resources
2.2. Configuring project creation
As a cluster administrator, you can allow and configure how developers and service accounts can create, or self-provision, their own projects.
In Red Hat OpenShift Service on AWS, projects are used to group and isolate related objects. When you request to create a new project by using the web console or oc new-project command, an endpoint in Red Hat OpenShift Service on AWS provisions the project according to a template. You can customize this template to meet your needs.
2.2.1. About project creation
When you request a new project, the Red Hat OpenShift Service on AWS API server automatically provisions the new project based on the project template. The project template is identified by the projectRequestTemplate parameter in the project configuration resource of the cluster.
If the parameter is not defined, the API server creates a default template that creates a project with the requested name. The API server then assigns the requesting user to the admin role for that project.
When a project request is submitted, the API substitutes the following parameters into the template:
Table 2.1. Default project template parameters
| Parameter | Description |
|---|---|
|
| The name of the project. Required. |
|
| The display name of the project. Might be empty. |
|
| The description of the project. Might be empty. |
|
| The user name of the administrating user. |
|
| The user name of the requesting user. |
Access to the API is granted to developers with the self-provisioner role and the self-provisioners cluster role binding. This role is available to all authenticated developers by default.
2.2.2. Modifying the template for new projects
To modify the default project template to customize the resources and settings applied when users create new projects, you can create a custom project template.
As a cluster administrator, you can modify the default project template so that new projects are created using your custom requirements.
To create your own custom project template:
Prerequisites
-
You have access to a Red Hat OpenShift Service on AWS cluster using an account with
dedicated-adminpermissions.
Procedure
-
Log in as a user with
cluster-adminprivileges. Generate the default project template:
$ oc adm create-bootstrap-project-template -o yaml > template.yaml
-
Use a text editor to modify the generated
template.yamlfile by adding objects or modifying existing objects. The project template must be created in the
openshift-confignamespace. Load your modified template:$ oc create -f template.yaml -n openshift-config
Edit the project configuration resource using the web console or CLI.
Using the web console, complete the following tasks:
- Navigate to the Administration → Cluster Settings page.
- Click Configuration to view all configuration resources.
- Find the entry for Project and click Edit YAML.
Using the CLI, complete the following tasks:
Edit the
project.config.openshift.io/clusterresource:$ oc edit project.config.openshift.io/cluster
Update the
specsection to include theprojectRequestTemplateandnameparameters. Ensure you set the name of your uploaded project template. The default name isproject-request.Project configuration resource with custom project template
apiVersion: config.openshift.io/v1 kind: Project metadata: # ... spec: projectRequestTemplate: name: <template_name> # ...- After you save your changes, create a new project to verify that your changes were successfully applied.
2.2.3. Disabling project self-provisioning
You can prevent an authenticated user group from self-provisioning new projects.
Procedure
-
Log in as a user with
cluster-adminprivileges. View the
self-provisionerscluster role binding usage by running the following command:$ oc describe clusterrolebinding.rbac self-provisioners
Example output
Name:		self-provisioners
Labels:		<none>
Annotations:	rbac.authorization.kubernetes.io/autoupdate=true
Role:
  Kind:	ClusterRole
  Name:	self-provisioner
Subjects:
  Kind	Name				Namespace
  ----	----				---------
  Group	system:authenticated:oauth
Review the subjects in the
self-provisionerssection.Remove the
self-provisionercluster role from the groupsystem:authenticated:oauth.If the
self-provisionerscluster role binding binds only theself-provisionerrole to thesystem:authenticated:oauthgroup, run the following command:$ oc patch clusterrolebinding.rbac self-provisioners -p '{"subjects": null}'If the
self-provisionerscluster role binding binds theself-provisionerrole to more users, groups, or service accounts than thesystem:authenticated:oauthgroup, run the following command:$ oc adm policy \ remove-cluster-role-from-group self-provisioner \ system:authenticated:oauth
Edit the
self-provisionerscluster role binding to prevent automatic updates to the role. Automatic updates reset the cluster roles to the default state.To update the role binding by using the CLI, complete the following steps:
To edit the
self-provisionerscluster role binding, enter the following command:$ oc edit clusterrolebinding.rbac self-provisioners
In the displayed role binding, set the
rbac.authorization.kubernetes.io/autoupdateparameter value tofalse, as shown in the following example:apiVersion: authorization.openshift.io/v1 kind: ClusterRoleBinding metadata: annotations: rbac.authorization.kubernetes.io/autoupdate: "false" # ...
To update the role binding, run the following single command:
$ oc patch clusterrolebinding.rbac self-provisioners -p '{ "metadata": { "annotations": { "rbac.authorization.kubernetes.io/autoupdate": "false" } } }'
Log in as an authenticated user and verify that the user can no longer self-provision a project:
$ oc new-project test
Example output
Error from server (Forbidden): You may not request a new project via this API.
Consider customizing this project request message to provide more helpful instructions specific to your organization.
2.2.4. Customizing the project request message
A developer or a service account that is unable to self-provision projects can make a project creation request by using the web console or CLI.
The following error message is returned by default:
You may not request a new project via this API.
Cluster administrators can customize this message. Consider updating the message to provide further instructions on how to request a new project specific to your organization. The following examples show a customized message:
-
To request a project, contact your system administrator at
projectname@example.com. -
To request a new project, fill out the project request form located at
https://internal.example.com/openshift-project-request.
Procedure
Edit the project configuration resource using the web console or CLI.
By using the web console, complete the following steps:
- Navigate to the Administration → Cluster Settings page.
- Click Configuration to view all configuration resources.
- Find the entry for Project and click Edit YAML.
By using the CLI, complete the following steps:
-
Log in as a user with
cluster-adminprivileges. Edit the
project.config.openshift.io/clusterresource:$ oc edit project.config.openshift.io/cluster
-
Log in as a user with
Update the
specsection to include theprojectRequestMessageparameter and set the value to your custom message:Project configuration resource with custom project request message
apiVersion: config.openshift.io/v1
kind: Project
metadata:
# ...
spec:
  projectRequestMessage: <message_string>
# ...
The following example uses actual values:
apiVersion: config.openshift.io/v1
kind: Project
metadata:
# ...
spec:
  projectRequestMessage: To request a project, contact your system administrator at projectname@example.com.
# ...
- After saving your changes, attempt to create a new project by using a developer or service account that cannot self-provision projects. By doing this task, you can verify that your changes were successfully applied.
Chapter 3. Creating applications
3.1. Creating applications by using the Developer perspective
Create and deploy applications on Red Hat OpenShift Service on AWS by using the Developer perspective in the web console.
The Developer perspective in the web console provides you the following options from the +Add view to create applications and associated services and deploy them on Red Hat OpenShift Service on AWS:
Starting with Red Hat OpenShift Service on AWS 4.19, the perspectives in the web console have unified. The Developer perspective is no longer enabled by default.
All users can interact with all Red Hat OpenShift Service on AWS web console features. However, if you are not the cluster owner, you might need to request permission to access certain features from the cluster owner.
You can still enable the Developer perspective. On the Getting Started pane in the web console, you can take a tour of the console, find information on setting up your cluster, view a quick start for enabling the Developer perspective, and follow links to explore new features and capabilities.
See also, "Enabling the Developer perspective in the web console".
Getting started resources: Use these resources to help you get started with Developer Console. You can choose to hide the header using the Options menu
 .
.
- Creating applications using samples: Use existing code samples to get started with creating applications on the Red Hat OpenShift Service on AWS.
- Build with guided documentation: Follow the guided documentation to build applications and familiarize yourself with key concepts and terminologies.
- Explore new developer features: Explore the new features and resources within the Developer perspective.
Developer catalog: Explore the Developer Catalog to select the required applications, services, or Source-to-Image (S2I) builders, and then add it to your project.
- All Services: Browse the catalog to discover services across Red Hat OpenShift Service on AWS.
- Database: Select the required database service and add it to your application.
- Operator Backed: Select and deploy the required Operator-managed service.
- Helm chart: Select the required Helm chart to simplify deployment of applications and services.
- Devfile: Select a devfile from the Devfile registry to declaratively define a development environment.
Event Source: Select an event source to register interest in a class of events from a particular system.
NoteThe Managed services option is also available if the RHOAS Operator is installed.
- Git repository: Import an existing codebase, Devfile, or Dockerfile from your Git repository using the From Git, From Devfile, or From Dockerfile options respectively, to build and deploy an application on Red Hat OpenShift Service on AWS.
- Container images: Use existing images from an image stream or registry to deploy it on to the Red Hat OpenShift Service on AWS.
- Pipelines: Use Tekton pipeline to create CI/CD pipelines for your software delivery process on the Red Hat OpenShift Service on AWS.
Serverless: Explore the Serverless options to create, build, and deploy stateless and serverless applications on the Red Hat OpenShift Service on AWS.
- Channel: Create a Knative channel to create an event forwarding and persistence layer with in-memory and reliable implementations.
- Samples: Explore the available sample applications to create, build, and deploy an application quickly.
- Quick Starts: Explore the quick start options to create, import, and run applications with step-by-step instructions and tasks.
From Local Machine: Explore the From Local Machine tile to import or upload files on your local machine for building and deploying applications easily.
- Import YAML: Upload a YAML file to create and define resources for building and deploying applications.
- Upload JAR file: Upload a JAR file to build and deploy Java applications.
- Share my Project: Use this option to add or remove users to a project and provide accessibility options to them.
- Helm Chart repositories: Use this option to add Helm Chart repositories in a namespace.
- Re-ordering of resources: Use these resources to re-order pinned resources added to your navigation pane. The drag-and-drop icon is displayed on the left side of the pinned resource when you hover over it in the navigation pane. The dragged resource can be dropped only in the section where it is located.
Note that the Pipelines option is displayed only when the OpenShift Pipelines Operator is installed.
3.1.1. Prerequisites
To create applications by using the Developer perspective, ensure that the following requirements are met:
- You have logged in to the web console.
3.1.2. Creating sample applications
You can use the sample applications in the +Add flow of the Developer perspective to create, build, and deploy applications quickly.
Prerequisites
- You have logged in to the Red Hat OpenShift Service on AWS web console and are in the Developer perspective.
Procedure
- In the +Add view, click the Samples tile to see the Samples page.
- On the Samples page, select one of the available sample applications to see the Create Sample Application form.
In the Create Sample Application Form:
- In the Name field, the deployment name is displayed by default. You can modify this name as required.
- In the Builder Image Version, a builder image is selected by default. You can modify this image version by using the Builder Image Version drop-down list.
- A sample Git repository URL is added by default.
- Click Create to create the sample application. The build status of the sample application is displayed on the Topology view. After the sample application is created, you can see the deployment added to the application.
3.1.3. Creating applications by using Quick Starts
The Quick Starts page shows you how to create, import, and run applications on Red Hat OpenShift Service on AWS, with step-by-step instructions and tasks.
Prerequisites
- You have logged in to the Red Hat OpenShift Service on AWS web console and are in the Developer perspective.
Procedure
- In the +Add view, click the Getting Started resources → Build with guided documentation → View all quick starts link to view the Quick Starts page.
- In the Quick Starts page, click the tile for the quick start that you want to use.
- Click Start to begin the quick start.
- Perform the steps that are displayed.
3.1.4. Importing a codebase from Git to create an application
You can use the Developer perspective to create, build, and deploy an application on Red Hat OpenShift Service on AWS using an existing codebase in GitHub.
The following procedure walks you through the From Git option in the Developer perspective to create an application.
Procedure
- In the +Add view, click From Git in the Git Repository tile to see the Import from git form.
-
In the Git section, enter the Git repository URL for the codebase you want to use to create an application. For example, enter the URL of this sample Node.js application
https://github.com/sclorg/nodejs-ex. The URL is then validated. Optional: You can click Show Advanced Git Options to add details such as:
- Git Reference to point to code in a specific branch, tag, or commit to be used to build the application.
- Context Dir to specify the subdirectory for the application source code you want to use to build the application.
- Source Secret to create a Secret Name with credentials for pulling your source code from a private repository.
Optional: You can import a
Devfile, aDockerfile,Builder Image, or aServerless Functionthrough your Git repository to further customize your deployment.-
If your Git repository contains a
Devfile, aDockerfile, aBuilder Image, or afunc.yaml, it is automatically detected and populated on the respective path fields. -
If a
Devfile, aDockerfile, or aBuilder Imageare detected in the same repository, theDevfileis selected by default. -
If
func.yamlis detected in the Git repository, the Import Strategy changes toServerless Function. - Alternatively, you can create a serverless function by clicking Create Serverless function in the +Add view using the Git repository URL.
- To edit the file import type and select a different strategy, click Edit import strategy option.
-
If multiple
Devfiles, aDockerfiles, or aBuilder Imagesare detected, to import a specific instance, specify the respective paths relative to the context directory.
-
If your Git repository contains a
After the Git URL is validated, the recommended builder image is selected and marked with a star. If the builder image is not auto-detected, select a builder image. For the
Content from github.com is not included.https://github.com/sclorg/nodejs-exGit URL, by default the Node.js builder image is selected.- Optional: Use the Builder Image Version drop-down to specify a version.
- Optional: Use the Edit import strategy to select a different strategy.
- Optional: For the Node.js builder image, use the Run command field to override the command to run the application.
In the General section:
-
In the Application field, enter a unique name for the application grouping, for example,
myapp. Ensure that the application name is unique in a namespace. The Name field to identify the resources created for this application is automatically populated based on the Git repository URL if there are no existing applications. If there are existing applications, you can choose to deploy the component within an existing application, create a new application, or keep the component unassigned.
NoteThe resource name must be unique in a namespace. Modify the resource name if you get an error.
-
In the Application field, enter a unique name for the application grouping, for example,
In the Resources section, select:
- Deployment, to create an application in plain Kubernetes style.
- Deployment Config, to create an Red Hat OpenShift Service on AWS style application.
Serverless Deployment, to create a Knative service.
NoteTo set the default resource preference for importing an application, go to User Preferences → Applications → Resource type field. The Serverless Deployment option is displayed in the Import from Git form only if the OpenShift Serverless Operator is installed in your cluster. The Resources section is not available while creating a serverless function. For further details, refer to the OpenShift Serverless documentation.
In the Pipelines section, select Add Pipeline, and then click Show Pipeline Visualization to see the pipeline for the application. A default pipeline is selected, but you can choose the pipeline you want from the list of available pipelines for the application.
NoteThe Add pipeline checkbox is checked and Configure PAC is selected by default if the following criterias are fulfilled:
- Pipeline operator is installed
-
pipelines-as-codeis enabled -
.tektondirectory is detected in the Git repository
Add a webhook to your repository. If Configure PAC is checked and the GitHub App is set up, you can see the Use GitHub App and Setup a webhook options. If GitHub App is not set up, you can only see the Setup a webhook option:
- Go to Settings → Webhooks and click Add webhook.
- Set the Payload URL to the Pipelines as Code controller public URL.
- Select the content type as application/json.
-
Add a webhook secret and note it in an alternate location. With
opensslinstalled on your local machine, generate a random secret. - Click Let me select individual events and select these events: Commit comments, Issue comments, Pull request, and Pushes.
- Click Add webhook.
Optional: In the Advanced Options section, the Target port and the Create a route to the application is selected by default so that you can access your application using a publicly available URL.
If your application does not expose its data on the default public port, 80, clear the check box, and set the target port number you want to expose.
Optional: You can use the following advanced options to further customize your application:
- Routing
By clicking the Routing link, you can perform the following actions:
- Customize the hostname for the route.
- Specify the path the router watches.
- Select the target port for the traffic from the drop-down list.
Secure your route by selecting the Secure Route check box. Select the required TLS termination type and set a policy for insecure traffic from the respective drop-down lists.
NoteFor serverless applications, the Knative service manages all the routing options above. However, you can customize the target port for traffic, if required. If the target port is not specified, the default port of
8080is used.
- Domain mapping
If you are creating a Serverless Deployment, you can add a custom domain mapping to the Knative service during creation.
In the Advanced options section, click Show advanced Routing options.
- If the domain mapping CR that you want to map to the service already exists, you can select it from the Domain mapping drop-down menu.
-
If you want to create a new domain mapping CR, type the domain name into the box, and select the Create option. For example, if you type in
example.com, the Create option is Create "example.com".
- Health Checks
Click the Health Checks link to add Readiness, Liveness, and Startup probes to your application. All the probes have prepopulated default data; you can add the probes with the default data or customize it as required.
To customize the health probes:
- Click Add Readiness Probe, if required, modify the parameters to check if the container is ready to handle requests, and select the check mark to add the probe.
- Click Add Liveness Probe, if required, modify the parameters to check if a container is still running, and select the check mark to add the probe.
Click Add Startup Probe, if required, modify the parameters to check if the application within the container has started, and select the check mark to add the probe.
For each of the probes, you can specify the request type - HTTP GET, Container Command, or TCP Socket, from the drop-down list. The form changes as per the selected request type. You can then modify the default values for the other parameters, such as the success and failure thresholds for the probe, number of seconds before performing the first probe after the container starts, frequency of the probe, and the timeout value.
- Build Configuration and Deployment
Click the Build Configuration and Deployment links to see the respective configuration options. Some options are selected by default; you can customize them further by adding the necessary triggers and environment variables.
For serverless applications, the Deployment option is not displayed as the Knative configuration resource maintains the desired state for your deployment instead of a
DeploymentConfigresource.
- Scaling
Click the Scaling link to define the number of pods or instances of the application you want to deploy initially.
If you are creating a serverless deployment, you can also configure the following settings:
-
Min Pods determines the lower limit for the number of pods that must be running at any given time for a Knative service. This is also known as the
minScalesetting. -
Max Pods determines the upper limit for the number of pods that can be running at any given time for a Knative service. This is also known as the
maxScalesetting. - Concurrency target determines the number of concurrent requests desired for each instance of the application at a given time.
- Concurrency limit determines the limit for the number of concurrent requests allowed for each instance of the application at a given time.
- Concurrency utilization determines the percentage of the concurrent requests limit that must be met before Knative scales up additional pods to handle additional traffic.
-
Autoscale window defines the time window over which metrics are averaged to provide input for scaling decisions when the autoscaler is not in panic mode. A service is scaled-to-zero if no requests are received during this window. The default duration for the autoscale window is
60s. This is also known as the stable window.
-
Min Pods determines the lower limit for the number of pods that must be running at any given time for a Knative service. This is also known as the
- Resource Limit
- Click the Resource Limit link to set the amount of CPU and Memory resources a container is guaranteed or allowed to use when running.
- Labels
- Click the Labels link to add custom labels to your application.
- Click Create to create the application and a success notification is displayed. You can see the build status of the application in the Topology view.
3.1.5. Creating applications by deploying container image
You can use an external image registry or an image stream tag from an internal registry to deploy an application on your cluster.
Prerequisites
- You have logged in to the Red Hat OpenShift Service on AWS web console and are in the Developer perspective.
Procedure
- In the +Add view, click Container images to view the Deploy Images page.
In the Image section:
- Select Image name from external registry to deploy an image from a public or a private registry, or select Image stream tag from internal registry to deploy an image from an internal registry.
- Select an icon for your image in the Runtime icon tab.
In the General section:
- In the Application name field, enter a unique name for the application grouping.
- In the Name field, enter a unique name to identify the resources created for this component.
In the Resource type section, select the resource type to generate:
-
Select Deployment to enable declarative updates for
PodandReplicaSetobjects. -
Select DeploymentConfig to define the template for a
Podobject, and manage deploying new images and configuration sources. - Select Serverless Deployment to enable scaling to zero when idle.
-
Select Deployment to enable declarative updates for
- Click Create. You can view the build status of the application in the Topology view.
3.1.6. Deploying a Java application by uploading a JAR file
You can use the web console Developer perspective to upload a JAR file by using the following options:
- Navigate to the +Add view of the Developer perspective, and click Upload JAR file in the From Local Machine tile. Browse and select your JAR file, or drag a JAR file to deploy your application.
- Navigate to the Topology view and use the Upload JAR file option, or drag a JAR file to deploy your application.
- Use the in-context menu in the Topology view, and then use the Upload JAR file option to upload your JAR file to deploy your application.
Prerequisites
- The Cluster Samples Operator must be installed by a cluster administrator.
- You have access to the Red Hat OpenShift Service on AWS web console and are in the Developer perspective.
Procedure
- In the Topology view, right-click anywhere to view the Add to Project menu.
- Hover over the Add to Project menu to see the menu options, and then select the Upload JAR file option to see the Upload JAR file form. Alternatively, you can drag the JAR file into the Topology view.
- In the JAR file field, browse for the required JAR file on your local machine and upload it. Alternatively, you can drag the JAR file on to the field. A toast alert is displayed at the top right if an incompatible file type is dragged into the Topology view. A field error is displayed if an incompatible file type is dropped on the field in the upload form.
- The runtime icon and builder image are selected by default. If a builder image is not auto-detected, select a builder image. If required, you can change the version using the Builder Image Version drop-down list.
- Optional: In the Application Name field, enter a unique name for your application to use for resource labelling.
- In the Name field, enter a unique component name for the associated resources.
- Optional: Use the Resource type drop-down list to change the resource type.
- In the Advanced options menu, click Create a Route to the Application to configure a public URL for your deployed application.
- Click Create to deploy the application. A toast notification is shown to notify you that the JAR file is being uploaded. The toast notification also includes a link to view the build logs.
If you attempt to close the browser tab while the build is running, a web alert is displayed.
After the JAR file is uploaded and the application is deployed, you can view the application in the Topology view.
3.1.7. Using the Devfile registry to access devfiles
You can use the devfiles in the +Add flow of the Developer perspective to create an application. The +Add flow provides a complete integration with the Content from registry.devfile.io is not included.devfile community registry. A devfile is a portable YAML file that describes your development environment without needing to configure it from scratch. Using the Devfile registry, you can use a preconfigured devfile to create an application.
Procedure
- Navigate to Developer Perspective → +Add → Developer Catalog → All Services. A list of all the available services in the Developer Catalog is displayed.
- Under Type, click Devfiles to browse for devfiles that support a particular language or framework. Alternatively, you can use the keyword filter to search for a particular devfile using their name, tag, or description.
- Click the devfile you want to use to create an application. The devfile tile displays the details of the devfile, including the name, description, provider, and the documentation of the devfile.
- Click Create to create an application and view the application in the Topology view.
3.1.8. Using the Developer Catalog to add services or components to your application
You use the Developer Catalog to deploy applications and services based on Operator backed services such as Databases, Builder Images, and Helm Charts. The Developer Catalog contains a collection of application components, services, event sources, or source-to-image builders that you can add to your project. Cluster administrators can customize the content made available in the catalog.
Procedure
- In the Developer perspective, navigate to the +Add view and from the Developer Catalog tile, click All Services to view all the available services in the Developer Catalog.
- Under All Services, select the kind of service or the component you need to add to your project. For this example, select Databases to list all the database services and then click MariaDB to see the details for the service.
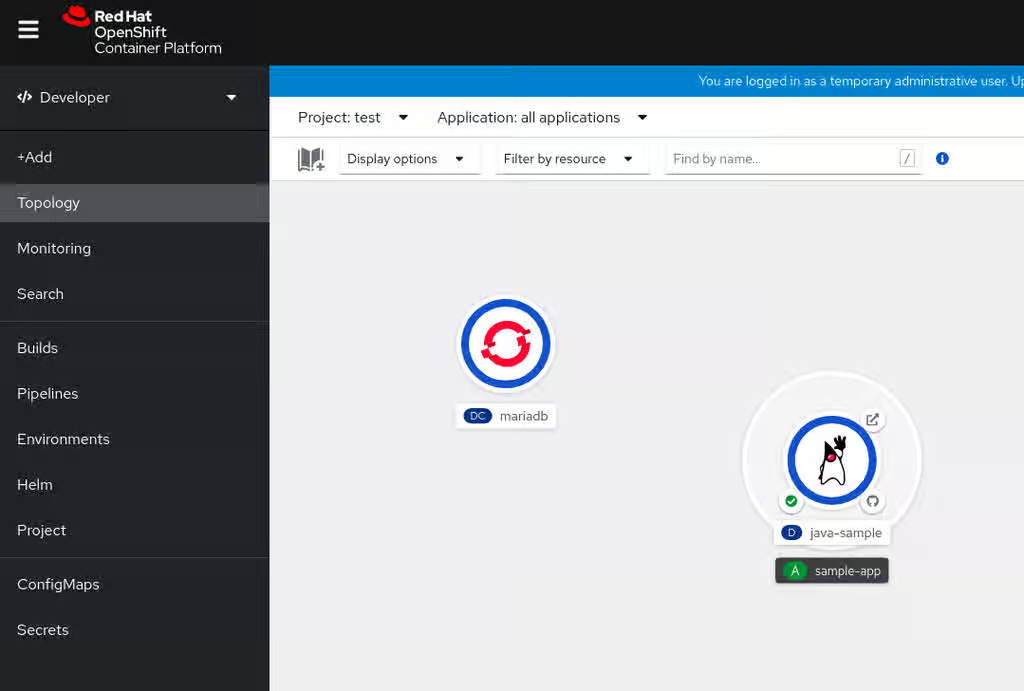
Click Instantiate Template to see an automatically populated template with details for the MariaDB service, and then click Create to create and view the MariaDB service in the Topology view.
Figure 3.1. MariaDB in Topology
3.1.9. Additional resources
- Enabling the Developer perspective in the web console
- Accessing the web console
- Default cluster roles
- Monitoring stack for Red Hat OpenShift
- This page is not included, but the link has been rewritten to point to the nearest parent document.Installing the OpenShift Pipelines Operator
- This page is not included, but the link has been rewritten to point to the nearest parent document.Installing the OpenShift Serverless Operator
- This page is not included, but the link has been rewritten to point to the nearest parent document.Installing the OpenShift Serverless Operator
- This page is not included, but the link has been rewritten to point to the nearest parent document.Creating a KnativeServing resource
- Installing the OpenShift Virtualization Operator
- This page is not included, but the link has been rewritten to point to the nearest parent document.Knative routing settings for OpenShift Serverless
- This page is not included, but the link has been rewritten to point to the nearest parent document.Configuring a custom domain for a Knative service
- This page is not included, but the link has been rewritten to point to the nearest parent document.Knative autoscaling settings for OpenShift Serverless
- Working with projects
- Creating Helm Chart repositories
3.2. Creating applications from installed Operators
You can deploy applications on your Red Hat OpenShift Service on AWS cluster from Operators that a cluster administrator installed. Use the Installed Operators page in the web console to create an application from an Operator custom resource (CR) API.
3.2.1. Creating an etcd cluster using an Operator
You can create an etcd cluster using the etcd Operator in the Red Hat OpenShift Service on AWS web console. The Operator creates the pods, services, and other cluster resources for you.
Prerequisites
- Access to a Red Hat OpenShift Service on AWS cluster.
- The etcd Operator already installed cluster-wide by an administrator.
Procedure
-
Create a new project in the Red Hat OpenShift Service on AWS web console for this procedure. This example uses a project called
my-etcd. Navigate to the Ecosystem → Installed Operators page.
The Operators installed on the cluster by the dedicated-admin and available for use are shown here as a list of cluster service versions (CSVs). Each CSV launches and manages the software provided by the Operator.
TipYou can get this list from the CLI by running the following command:
$ oc get csv
On the Installed Operators page, click the etcd Operator to view more details and available actions.
As shown under Provided APIs, this Operator makes available three new resource types, including one for an etcd Cluster, the
EtcdClusterresource.These objects work similarly to the built-in native Kubernetes ones, such as
DeploymentorReplicaSet, but contain logic specific to managing etcd.Create a new etcd cluster:
- In the etcd Cluster API box, click Create instance.
-
Optional: Modify the minimal starting template of an
EtcdClusterobject, such as the size of the cluster. - Click Create to finalize. This triggers the Operator to start up the pods, services, and other components of the new etcd cluster.
- Click the example etcd cluster.
Click the Resources tab.
Your project contains several resources that the Operator created and configured.
- Verify that a Kubernetes service exists that allows you to access the database from other pods in your project.
Optional: To grant another user permission to create Operator-managed applications in the project, add the
editrole by running the following command:$ oc policy add-role-to-user edit <user> -n <target_project>
Users with the
editrole in a project can create, manage, and delete Operator-managed application instances, such as an etcd cluster.
Results
You have an etcd cluster that reacts to failures and rebalances data as pods become unhealthy or migrate between nodes in the cluster. dedicated-admins or developers with proper access can use the database with their applications.
3.3. Creating applications by using the CLI
You can create applications on your Red Hat OpenShift Service on AWS cluster from a Git repository, a container image, or a template using the oc new-app command. Customize names, labels, environment variables, target projects, and other deployment options with command flags.
3.3.1. Creating an application from source code
You can create an application on your Red Hat OpenShift Service on AWS cluster from a local or remote Git repository using the oc new-app command. Use command flags to target a specific branch or subdirectory, authenticate to a private repository, or control the build strategy and builder image.
Prerequisites
-
You have installed the OpenShift CLI (
oc) and logged in to your cluster. - You have access to a Git repository containing your application source code.
Procedure
Create an application from a Git repository in a local directory by running the following command:
$ oc new-app /<path_to_source_code>
NoteIf you use a local Git repository, the repository must have a remote named
originthat points to a URL that is accessible by the Red Hat OpenShift Service on AWS cluster. If there is no recognized remote, running thenew-appcommand creates a binary build.Create an application from a public remote Git repository by running the following command:
$ oc new-app https://github.com/sclorg/cakephp-ex
Create an application from a private remote Git repository by running the following command:
$ oc new-app https://github.com/<your_user>/<your_private_repo> --source-secret=yoursecret
NoteIf you use a private remote Git repository, use the
--source-secretflag to specify a source clone secret for access to the repository.Use a subdirectory of your source repository by running the following command:
$ oc new-app https://github.com/sclorg/s2i-ruby-container.git \ --context-dir=2.0/test/puma-test-appSpecify a Git branch by running the following command:
$ oc new-app https://github.com/openshift/ruby-hello-world.git#beta4
Override the automatically detected build strategy by running the following command:
$ oc new-app /home/user/code/myapp --strategy=docker
NoteThe
occommand requires that files containing build sources are available in a remote Git repository. For all source builds, you must usegit remote -v.Specify the builder image and source repository:
Specify the builder image and source repository for a remote repository by running the following command:
$ oc new-app myproject/my-ruby~https://github.com/openshift/ruby-hello-world.git
Specify the builder image and source repository for a local repository by running the following command:
$ oc new-app openshift/ruby-20-centos7:latest~/home/user/code/my-ruby-app
3.3.2. Build strategy and language detection for source applications
You can determine which build strategy and language builder the oc new-app command selects by reviewing files in the root or context directory of your Git repository. Use these detection rules to override the build strategy or specify a builder image when automatic detection does not apply.
3.3.2.1. Build strategy detection
Red Hat OpenShift Service on AWS automatically determines which build strategy to use by detecting certain files:
If a
Jenkinsfileexists in the root or specified context directory of the source repository when creating a new application, Red Hat OpenShift Service on AWS generates a pipeline build strategy.NoteThe
pipelinebuild strategy is deprecated; consider using Red Hat OpenShift Pipelines instead.-
If a
Dockerfileexists in the root or specified context directory of the source repository when creating a new application, Red Hat OpenShift Service on AWS generates a docker build strategy. -
If neither a
Jenkinsfilenor aDockerfileis detected, Red Hat OpenShift Service on AWS generates a source build strategy.
3.3.2.2. Language detection
If you use the source build strategy, new-app detects the language builder from certain files in the root or context directory of the repository.
Table 3.1. Languages detected by new-app
| Language | Files |
|---|---|
|
|
|
|
|
|
|
|
|
|
|
|
|
|
|
|
|
|
|
|
|
|
|
|
After a language is detected, the new-app command searches the Red Hat OpenShift Service on AWS server for image stream tags with a matching supports annotation or image streams that match the language name. If a match is not found, the new-app command searches the Docker Hub registry for an image that matches the detected language based on name.
When you specify an image and repository with the ~ separator, build strategy detection and language detection are not carried out.
Language detection requires the Git client to be locally installed so that your repository can be cloned and inspected. If Git is not available, you can avoid the language detection step by specifying the builder image to use with your repository with the <image>~<repository> syntax.
The -i <image> <repository> invocation requires that new-app attempt to clone repository to determine what type of artifact it is, so the command fails if Git is not available.
The -i <image> --code <repository> invocation requires that new-app clone repository to learn whether image is a builder for the source or a separate deployment, such as a database image.
3.3.3. Creating an application from an image
You can use the oc new-app command to create an application from a container image in Docker Hub, a private registry, or an image stream on your cluster. Use this procedure when you know the container image name or image stream you want to deploy.
Use the command that matches where your container image is stored.
If you specify an image from your local Docker repository, you must ensure that the same image is available to the Red Hat OpenShift Service on AWS cluster nodes.
Prerequisites
-
You have installed the OpenShift CLI (
oc) and logged in to your cluster. - You know the container image name or image stream you want to deploy.
Procedure
Create an application from the Docker Hub MySQL image by running the following command:
$ oc new-app mysql
Create an application from an image in a private registry by specifying the full image path in the following command:
$ oc new-app myregistry:5000/example/myimage
Create an application from an existing image stream and optional image stream tag by running the following command:
$ oc new-app my-stream:v1
Additional resources
3.3.4. Creating an application from a template
You can use the oc new-app command to create an application from a template stored in your project or from a template file on your local system. Use this procedure when you have a template JSON or YAML file, or a template in the template library of your current project.
Prerequisites
-
You have installed the OpenShift CLI (
oc) and logged in to your cluster. - You have a template JSON or YAML file, or a template stored in the template library of your current project.
Procedure
Upload an application template to the template library of your current project by running the following command:
$ oc create -f examples/sample-app/application-template-stibuild.json
Create a new application from a stored template by running the following command:
$ oc new-app ruby-helloworld-sample
Create a new application from a template file on your local file system without storing it in Red Hat OpenShift Service on AWS by running the following command:
$ oc new-app -f examples/sample-app/application-template-stibuild.json
Set template parameter values when creating an application by running the following command:
$ oc new-app ruby-helloworld-sample \ -p ADMIN_USERNAME=admin -p ADMIN_PASSWORD=mypasswordStore template parameters in a file by creating a file such as
helloworld.paramswith the following content:ADMIN_USERNAME=admin ADMIN_PASSWORD=mypassword
You can store your parameters in a file, then use that file with
--param-filewhen instantiating a template. If you want to read the parameters from standard input, use--param-file=-.Create a new application from a template by using a parameter file by running the following command:
$ oc new-app ruby-helloworld-sample --param-file=helloworld.params
NoteTo read parameters from standard input, use
--param-file=-.
3.3.5. Customization options for application creation
You can customize how the oc new-app command creates applications by setting names, labels, environment variables, target projects, and other options. Use these flags to control the objects the command generates before you deploy.
Table 3.2. new-app output objects
| Object | Description |
|---|---|
|
|
A |
|
|
For the |
|
|
A |
|
|
The |
| Other | Other objects can be generated when creating applications from templates, according to the template. |
3.3.5.1. Specifying environment variables
When generating applications from a template, source, or an image, you can use the -e|--env argument to pass environment variables to the application container at run time.
$ oc new-app openshift/postgresql-92-centos7 \
    -e POSTGRESQL_USER=user \
    -e POSTGRESQL_DATABASE=db \
    -e POSTGRESQL_PASSWORD=password
The variables can also be read from file using the --env-file argument. The following is an example file called postgresql.env:
POSTGRESQL_USER=user
POSTGRESQL_DATABASE=db
POSTGRESQL_PASSWORD=password
Read the variables from the file:
$ oc new-app openshift/postgresql-92-centos7 --env-file=postgresql.env
Additionally, environment variables can be given on standard input by using the --env-file=- argument:
$ cat postgresql.env | oc new-app openshift/postgresql-92-centos7 --env-file=-
Any BuildConfig objects created as part of new-app processing are not updated with environment variables passed with the -e|--env or --env-file argument.
3.3.5.2. Specifying build environment variables
When generating applications from a template, source, or an image, you can use the --build-env argument to pass environment variables to the build container at run time:
$ oc new-app openshift/ruby-23-centos7 \
    --build-env HTTP_PROXY=http://myproxy.net:1337/ \
    --build-env GEM_HOME=~/.gem
The variables can also be read from a file using the --build-env-file argument. The following is an example file called ruby.env:
HTTP_PROXY=http://myproxy.net:1337/
GEM_HOME=~/.gem
Read the variables from the file:
$ oc new-app openshift/ruby-23-centos7 --build-env-file=ruby.env
Additionally, environment variables can be given on standard input by using --build-env-file=-:
$ cat ruby.env | oc new-app openshift/ruby-23-centos7 --build-env-file=-
3.3.5.3. Specifying labels
When generating applications from source, images, or templates, you can use the -l|--label argument to add labels to the created objects. Labels make it easy to collectively select, configure, and delete objects associated with the application.
$ oc new-app https://github.com/openshift/ruby-hello-world -l name=hello-world
3.3.5.4. Viewing the output without creation
You can preview objects without creating them by using -o or --output with a yaml or json value. Redirect the output to a file, edit the file, then create the objects with oc create.
Writing new-app output to a file
$ oc new-app https://github.com/openshift/ruby-hello-world \
-o yaml > myapp.yamlCreating objects from an edited file
$ oc create -f myapp.yaml
3.3.5.5. Creating objects with different names
Objects created by new-app are normally named after the source repository, or the image used to generate them. You can set the name of the objects produced by adding a --name flag to the command:
$ oc new-app https://github.com/openshift/ruby-hello-world --name=myapp
3.3.5.6. Creating objects in a different project
Normally, new-app creates objects in the current project. However, you can create objects in a different project by using the -n|--namespace argument:
$ oc new-app https://github.com/openshift/ruby-hello-world -n myproject
3.3.5.7. Creating multiple objects
You can create multiple applications by specifying multiple parameters to new-app. Labels specified in the command line apply to all objects created by the single command. Environment variables apply to all components created from source or images.
To create an application from a source repository and a Docker Hub image:
$ oc new-app https://github.com/openshift/ruby-hello-world mysql
If a source code repository and a builder image are specified as separate arguments, new-app uses the builder image as the builder for the source code repository. If this is not the intent, specify the required builder image for the source using the ~ separator.
3.3.5.8. Grouping images and source in a single pod
You can deploy multiple images together in a single pod. To specify which images to group together, use the + separator. The --group command-line argument can also be used to specify the images that should be grouped together. To group the image built from a source repository with other images, specify the builder image for the source in the group:
$ oc new-app ruby+mysql
To deploy an image built from source and an external image together:
$ oc new-app \
    ruby~https://github.com/openshift/ruby-hello-world \
    mysql \
--group=ruby+mysql3.3.5.9. Searching for images, templates, and other inputs
To search for images, templates, and other inputs for the oc new-app command, add the --search and --list flags. For example, to find all of the images or templates that include PHP:
$ oc new-app --search php
3.3.5.10. Setting the import mode
To set the import mode when using oc new-app, add the --import-mode flag. This flag can be appended with Legacy or PreserveOriginal, which provides users the option to create image streams using a single sub-manifest, or all manifests, respectively.
$ oc new-app --image=registry.redhat.io/ubi8/httpd-24:latest --import-mode=Legacy --name=test
$ oc new-app --image=registry.redhat.io/ubi8/httpd-24:latest --import-mode=PreserveOriginal --name=test
Chapter 4. Viewing application composition by using the Topology view
The Topology view in the Developer perspective of the web console provides a visual representation of all the applications within a project, their build status, and the components and services associated with them.
4.1. Prerequisites
To view your applications in the Topology view and interact with them, ensure that:
- You have logged in to the web console.
- You are in the Developer perspective.
4.2. Viewing the topology of your application
You can navigate to the Topology view using the left navigation panel in the Developer perspective. After you deploy an application, you are directed automatically to the Graph view where you can see the status of the application pods, quickly access the application on a public URL, access the source code to modify it, and see the status of your last build. You can zoom in and out to see more details for a particular application.
The Topology view provides you the option to monitor your applications using the List view. Use the List view icon (
 ) to see a list of all your applications and use the Graph view icon (
 ) to switch back to the graph view.
You can customize the views as required using the following:
- Use the Find by name field to find the required components. Search results may appear outside of the visible area; click Fit to Screen from the lower-left toolbar to resize the Topology view to show all components.
Use the Display Options drop-down list to configure the Topology view of the various application groupings. The options are available depending on the types of components deployed in the project:
Expand group
- Virtual Machines: Toggle to show or hide the virtual machines.
- Application Groupings: Clear to condense the application groups into cards with an overview of an application group and alerts associated with it.
- Helm Releases: Clear to condense the components deployed as Helm Release into cards with an overview of a given release.
- Knative Services: Clear to condense the Knative Service components into cards with an overview of a given component.
- Operator Groupings: Clear to condense the components deployed with an Operator into cards with an overview of the given group.
Show elements based on Pod Count or Labels
- Pod Count: Select to show the number of pods of a component in the component icon.
- Labels: Toggle to show or hide the component labels.
The Topology view also provides you the Export application option to download your application in the ZIP file format. You can then import the downloaded application to another project or cluster. For more details, see Exporting an application to another project or cluster in the Additional resources section.
4.3. Interacting with applications and components
In the Topology view in the Developer perspective of the web console, the Graph view provides the following options to interact with applications and components:
-
Click Open URL (
 ) to see your application exposed by the route on a public URL.
Click Edit Source code to access your source code and modify it.
NoteThis feature is available only when you create applications using the From Git, From Catalog, and the From Dockerfile options.
-
Hover your cursor over the lower left icon on the pod to see the name of the latest build and its status. The status of the application build is indicated as New (
 ), Pending (
 ), Running (
 ), Completed (
 ), Failed (
 ), and Canceled (
 ).
).
The status or phase of the pod is indicated by different colors and tooltips as:
-
Running (
 ): The pod is bound to a node and all of the containers are created. At least one container is still running or is in the process of starting or restarting.
-
Not Ready (
 ): The pods which are running multiple containers, not all containers are ready.
-
Warning(
 ): Containers in pods are being terminated, however termination did not succeed. Some containers may be other states.
-
Failed(
 ): All containers in the pod terminated but least one container has terminated in failure. That is, the container either exited with non-zero status or was terminated by the system.
-
Pending(
 ): The pod is accepted by the Kubernetes cluster, but one or more of the containers has not been set up and made ready to run. This includes time a pod spends waiting to be scheduled as well as the time spent downloading container images over the network.
-
Succeeded(
 ): All containers in the pod terminated successfully and will not be restarted.
-
Terminating(
 ): When a pod is being deleted, it is shown as Terminating by some kubectl commands. Terminating status is not one of the pod phases. A pod is granted a graceful termination period, which defaults to 30 seconds.
-
Unknown(
 ): The state of the pod could not be obtained. This phase typically occurs due to an error in communicating with the node where the pod should be running.
-
Running (
After you create an application and an image is deployed, the status is shown as Pending. After the application is built, it is displayed as Running.
Figure 4.1. Application topology
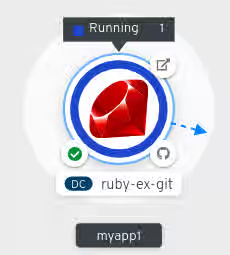
The application resource name is appended with indicators for the different types of resource objects as follows:
-
CJ:
CronJob -
D:
Deployment -
DC:
DeploymentConfig -
DS:
DaemonSet -
J:
Job -
P:
Pod -
SS:
StatefulSet  (Knative): A serverless application
Note
(Knative): A serverless application
NoteServerless applications take some time to load and display on the Graph view. When you deploy a serverless application, it first creates a service resource and then a revision. After that, it is deployed and displayed on the Graph view. If it is the only workload, you might be redirected to the Add page. After the revision is deployed, the serverless application is displayed on the Graph view.
-
CJ:
4.4. Scaling application pods and checking builds and routes
The Topology view provides the details of the deployed components in the Overview panel. You can use the Overview and Details tabs to scale the application pods, check build status, services, and routes as follows:
Click on the component node to see the Overview panel to the right. Use the Details tab to:
- Scale your pods using the up and down arrows to increase or decrease the number of instances of the application manually. For serverless applications, the pods are automatically scaled down to zero when idle and scaled up depending on the channel traffic.
- Check the Labels, Annotations, and Status of the application.
Click the Resources tab to:
- See the list of all the pods, view their status, access logs, and click on the pod to see the pod details.
- See the builds, their status, access logs, and start a new build if needed.
- See the services and routes used by the component.
For serverless applications, the Resources tab provides information on the revision, routes, and the configurations used for that component.
4.5. Adding components to an existing project
You can add components to a project.
Procedure
- Navigate to the +Add view.
-
Click Add to Project (
 ) next to left navigation pane or press Ctrl+Space
Search for the component and click the Start/Create/Install button or click Enter to add the component to the project and see it in the topology Graph view.
Figure 4.2. Adding component via quick search
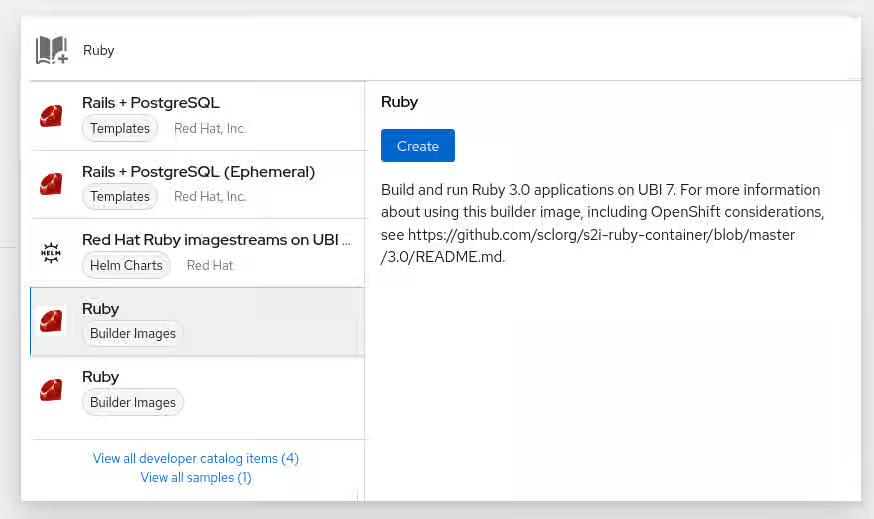
Alternatively, you can also use the available options in the context menu, such as Import from Git, Container Image, Database, From Catalog, Operator Backed, Helm Charts, Samples, or Upload JAR file, by right-clicking in the topology Graph view to add a component to your project.
Figure 4.3. Context menu to add services
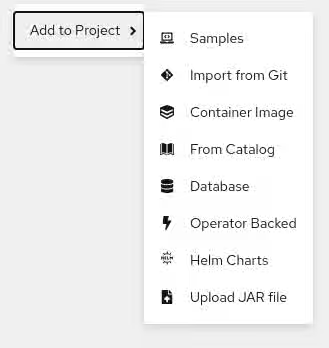
4.6. Grouping multiple components within an application
You can use the +Add view to add multiple components or services to your project and use the topology Graph view to group applications and resources within an application group.
Prerequisites
- You have created and deployed minimum two or more components on Red Hat OpenShift Service on AWS using the Developer perspective.
Procedure
To add a service to the existing application group, press Shift+ drag it to the existing application group. Dragging a component and adding it to an application group adds the required labels to the component.
Figure 4.4. Application grouping
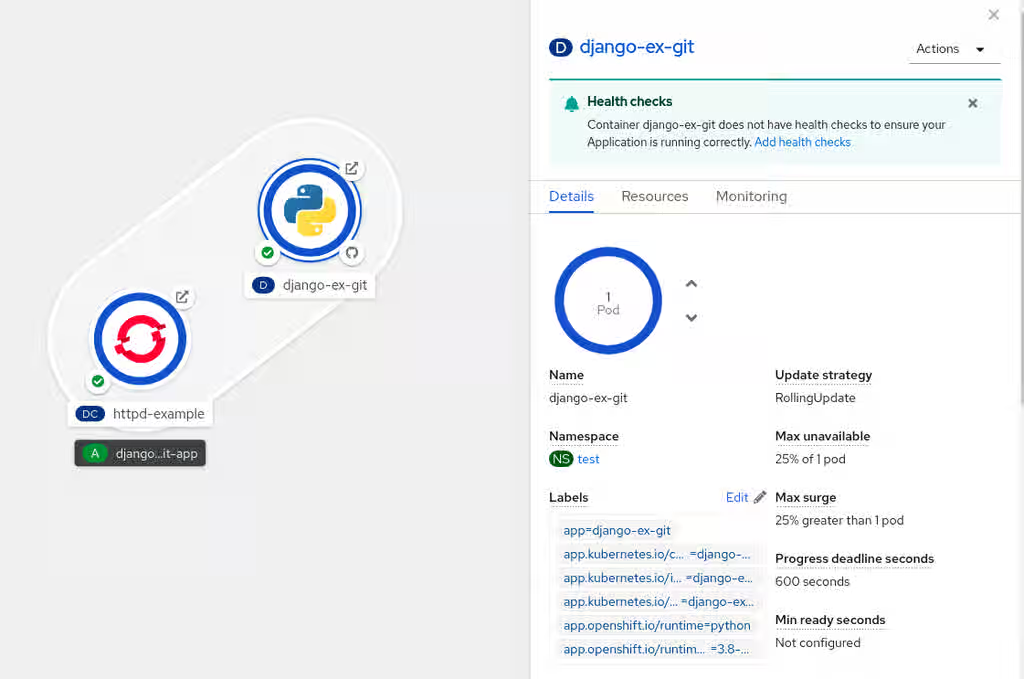
Alternatively, you can also add the component to an application as follows:
- Click the service pod to see the Overview panel to the right.
- Click the Actions drop-down menu and select Edit Application Grouping.
- In the Edit Application Grouping dialog box, click the Application drop-down list, and select an appropriate application group.
- Click Save to add the service to the application group.
You can remove a component from an application group by selecting the component and using Shift+ drag to drag it out of the application group.
4.7. Adding services to your application
To add a service to your application use the +Add actions using the context menu in the topology Graph view.
In addition to the context menu, you can add services by using the sidebar or hovering and dragging the dangling arrow from the application group.
Procedure
Right-click an application group in the topology Graph view to display the context menu.
Figure 4.5. Add resource context menu
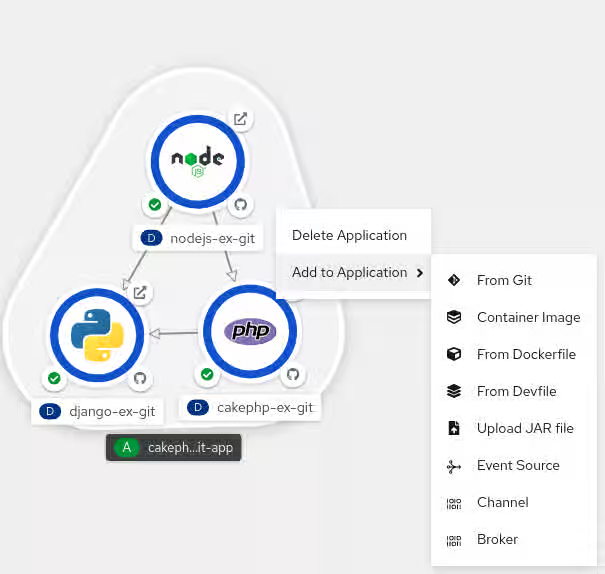
- Use Add to Application to select a method for adding a service to the application group, such as From Git, Container Image, From Dockerfile, From Devfile, Upload JAR file, Event Source, Channel, or Broker.
- Complete the form for the method you choose and click Create. For example, to add a service based on the source code in your Git repository, choose the From Git method, fill in the Import from Git form, and click Create.
4.8. Removing services from your application
In the topology Graph view remove a service from your application using the context menu.
Procedure
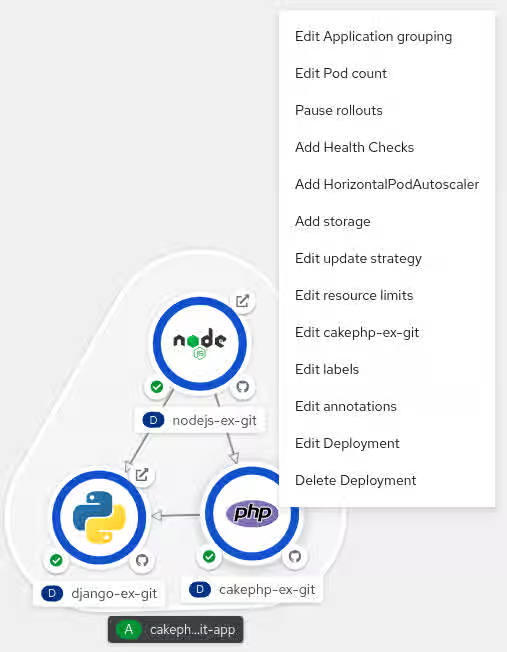
- Right-click on a service in an application group in the topology Graph view to display the context menu.
Select Delete Deployment to delete the service.
Figure 4.6. Deleting deployment option
4.9. Labels and annotations used for the Topology view
The Topology view uses the following labels and annotations:
- Icon displayed in the node
-
Icons in the node are defined by looking for matching icons using the
app.openshift.io/runtimelabel, followed by theapp.kubernetes.io/namelabel. This matching is done using a predefined set of icons. - Link to the source code editor or the source
-
The
app.openshift.io/vcs-uriannotation is used to create links to the source code editor. - Node Connector
-
The
app.openshift.io/connects-toannotation is used to connect the nodes. - App grouping
-
The
app.kubernetes.io/part-of=<appname>label is used to group the applications, services, and components.
For detailed information on the labels and annotations Red Hat OpenShift Service on AWS applications must use, see Content from github.com is not included.Guidelines for labels and annotations for OpenShift applications.
4.10. Additional resources
- See Importing a codebase from Git to create an application for more information on creating an application from Git.
Chapter 5. Working with Helm charts
5.1. Understanding Helm
Helm is a software package manager that simplifies deployment of applications and services to Red Hat OpenShift Service on AWS clusters.
Helm uses a packaging format called charts. A Helm chart is a collection of files that describes the Red Hat OpenShift Service on AWS resources.
Creating a chart in a cluster creates a running instance of the chart known as a release.
Each time a chart is created, or a release is upgraded or rolled back, an incremental revision is created.
5.1.1. Key features
Helm provides the ability to:
- Search through a large collection of charts stored in the chart repository.
- Modify existing charts.
- Create your own charts with Red Hat OpenShift Service on AWS or Kubernetes resources.
- Package and share your applications as charts.
5.1.2. Red Hat Certification of Helm charts for OpenShift
You can choose to verify and certify your Helm charts by Red Hat for all the components you will be deploying on the Red Hat Red Hat OpenShift Service on AWS. Charts go through an automated Red Hat OpenShift certification workflow that guarantees security compliance as well as best integration and experience with the platform. Certification assures the integrity of the chart and ensures that the Helm chart works seamlessly on Red Hat OpenShift clusters.
5.1.3. Additional resources
- For more information on how to certify your Helm charts as a Red Hat partner, see Content from redhat-connect.gitbook.io is not included.Red Hat Certification of Helm charts for OpenShift.
- For more information on OpenShift and Container certification guides for Red Hat partners, see This content is not included.Partner Guide for OpenShift and Container Certification.
-
For a list of the charts, see Content from charts.openshift.io is not included.the Red Hat
Helm indexfile.
5.2. Installing Helm
Install the Helm CLI to manage software packages on your Red Hat OpenShift Service on AWS cluster from a local workstation.
You can also find the URL to the latest binaries from the Red Hat OpenShift Service on AWS web console by clicking the ? icon in the upper-right corner and selecting Command Line Tools.
5.2.1. On Linux
Download the Helm binary:
Linux (x86_64, amd64)
# curl -L https://mirror.openshift.com/pub/openshift-v4/clients/helm/latest/helm-linux-amd64 -o /usr/local/bin/helm
Linux on IBM Z® and IBM® LinuxONE (s390x)
# curl -L https://mirror.openshift.com/pub/openshift-v4/clients/helm/latest/helm-linux-s390x -o /usr/local/bin/helm
Linux on IBM Power® (ppc64le)
# curl -L https://mirror.openshift.com/pub/openshift-v4/clients/helm/latest/helm-linux-ppc64le -o /usr/local/bin/helm
Linux on ARM (arm64)
# curl -L https://mirror.openshift.com/pub/openshift-v4/clients/helm/latest/helm-linux-arm64 -o /usr/local/bin/helm
Make the binary file executable:
# chmod +x /usr/local/bin/helm
Check the installed version:
$ helm version
Example output
version.BuildInfo{Version:"v3.0", GitCommit:"b31719aab7963acf4887a1c1e6d5e53378e34d93", GitTreeState:"clean", GoVersion:"go1.13.4"}
5.2.2. On Windows
-
Download the Helm binary: Content from mirror.openshift.com is not included.
.exefile. -
Click Search and type
envorenvironment. - Select Edit environment variables for your account.
- Select Path from the Variable section and click Edit.
- Click New and type the path to the directory with the exe file into the field or click Browse and select the directory, and click OK.
5.2.3. On macOS
Download the Helm binary:
For macOS on Intel (x86_64):
# curl -L https://mirror.openshift.com/pub/openshift-v4/clients/helm/latest/helm-darwin-amd64 -o /usr/local/bin/helm
For macOS on ARM (Apple Silicon):
# curl -L https://mirror.openshift.com/pub/openshift-v4/clients/helm/latest/helm-darwin-arm64 -o /usr/local/bin/helm
Make the binary file executable:
# chmod +x /usr/local/bin/helm
Check the installed version:
$ helm version
Example output
version.BuildInfo{Version:"v3.0", GitCommit:"b31719aab7963acf4887a1c1e6d5e53378e34d93", GitTreeState:"clean", GoVersion:"go1.13.4"}
5.3. Configuring custom Helm chart repositories
The Developer Catalog, in the Developer perspective of the web console, displays the Helm charts available in the cluster. By default, it lists the Helm charts from the Red Hat OpenShift Helm chart repository. For a list of the charts, see Content from charts.openshift.io is not included.the Red Hat Helm index file.
As a cluster administrator, you can add multiple cluster-scoped and namespace-scoped Helm chart repositories, separate from the default cluster-scoped Helm repository, and display the Helm charts from these repositories in the Developer Catalog.
As a regular user or project member with the appropriate role-based access control (RBAC) permissions, you can add multiple namespace-scoped Helm chart repositories, apart from the default cluster-scoped Helm repository, and display the Helm charts from these repositories in the Developer Catalog.
In the Developer perspective of the web console, you can use the Helm page to:
- Create Helm Releases and Repositories using the Create button.
- Create, update, or delete a cluster-scoped or namespace-scoped Helm chart repository.
- View the list of the existing Helm chart repositories in the Repositories tab, which can also be easily distinguished as either cluster scoped or namespace scoped.
5.3.1. Creating Helm releases using the Developer perspective
You can use either the Developer perspective in the web console or the CLI to select and create a release from the Helm charts listed in the Developer Catalog. You can create Helm releases by installing Helm charts and see them in the Developer perspective of the web console.
Prerequisites
- You have logged in to the web console and have switched to the Developer perspective.
Procedure
To create Helm releases from the Helm charts provided in the Developer Catalog:
- In the Developer perspective, navigate to the +Add view and select a project. Then click Helm Chart option to see all the Helm Charts in the Developer Catalog.
- Select a chart and read the description, README, and other details about the chart.
Click Create.
Figure 5.1. Helm charts in developer catalog
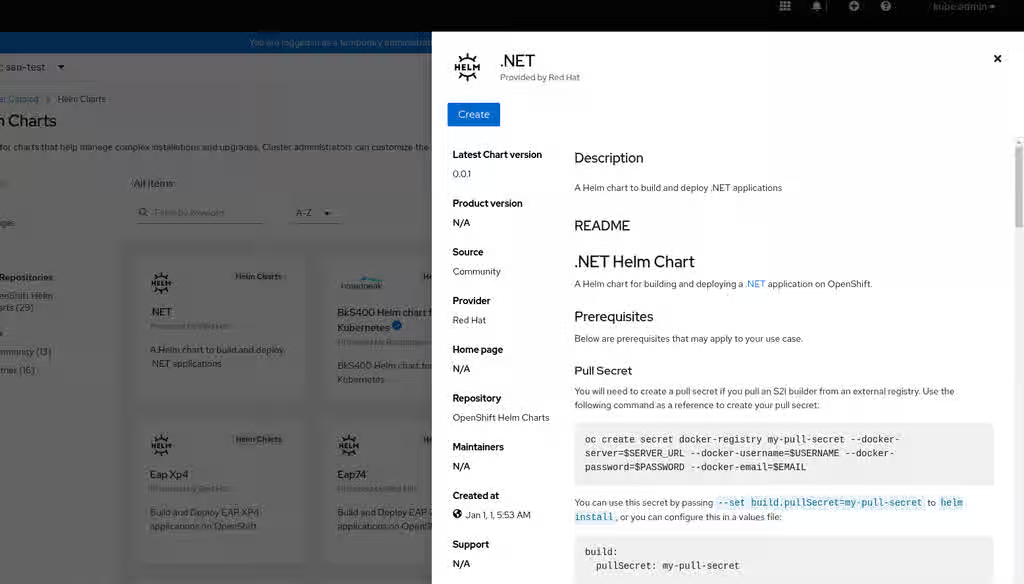
In the Create Helm Release page:
- Enter a unique name for the release in the Release Name field.
- Select the required chart version from the Chart Version drop-down list.
Configure your Helm chart by using the Form View or the YAML View.
NoteWhere available, you can switch between the YAML View and Form View. The data is persisted when switching between the views.
Click Create to create a Helm release. The web console displays the new release in the Topology view.
If a Helm chart has release notes, the web console displays them.
If a Helm chart creates workloads, the web console displays them on the Topology or Helm release details page. The workloads are
DaemonSet,CronJob,Pod,Deployment, andDeploymentConfig.- View the newly created Helm release in the Helm Releases page.
You can upgrade, rollback, or delete a Helm release by using the Actions button on the side panel or by right-clicking a Helm release.
5.3.2. Using Helm in the web terminal
You can use Helm by Accessing the web terminal in the Developer perspective of the web console.
5.3.3. Creating a custom Helm chart on Red Hat OpenShift Service on AWS
Procedure
Create a new project:
$ oc new-project nodejs-ex-k
Download an example Node.js chart that contains Red Hat OpenShift Service on AWS objects:
$ git clone https://github.com/redhat-developer/redhat-helm-charts
Go to the directory with the sample chart:
$ cd redhat-helm-charts/alpha/nodejs-ex-k/
Edit the
Chart.yamlfile and add a description of your chart:apiVersion: v2 1 name: nodejs-ex-k 2 description: A Helm chart for OpenShift 3 icon: https://static.redhat.com/libs/redhat/brand-assets/latest/corp/logo.svg 4 version: 0.2.1 5
Verify that the chart is formatted properly:
$ helm lint
Example output
[INFO] Chart.yaml: icon is recommended

1 chart(s) linted, 0 chart(s) failed
Navigate to the previous directory level:
$ cd ..
Install the chart:
$ helm install nodejs-chart nodejs-ex-k
Verify that the chart has installed successfully:
$ helm list
Example output
NAME NAMESPACE REVISION UPDATED STATUS CHART APP VERSION
nodejs-chart nodejs-ex-k 1 2019-12-05 15:06:51.379134163 -0500 EST deployed nodejs-0.1.0  1.16.0
5.3.4. Filtering Helm Charts by their certification level
You can filter Helm charts based on their certification level in the Developer Catalog.
Procedure
- In the Developer perspective, navigate to the +Add view and select a project.
- From the Developer Catalog tile, select the Helm Chart option to see all the Helm charts in the Developer Catalog.
Use the filters to the left of the list of Helm charts to filter the required charts:
- Use the Chart Repositories filter to filter charts provided by Red Hat Certification Charts or OpenShift Helm Charts.
-
Use the Source filter to filter charts sourced from Partners, Community, or Red Hat. Certified charts are indicated with the (
 ) icon.
The Source filter will not be visible when there is only one provider type.
You can now select the required chart and install it.
5.4. Working with Helm releases
You can use the web console to create, update, roll back, or delete a Helm release.
5.4.1. Installing a Helm release from a URL
A Helm release is a deployed instance of a Helm chart within your Red Hat OpenShift Service on AWS cluster. You can install charts from the developer catalog or by using a direct chart URL. Using a direct URL avoids the need for a configured Helm repository. However, this method circumvents the validation provided by the developer catalog. Use the direct URL method only when a chart is not available from the developer catalog or configured repositories.
Installing a Helm chart from a direct URL bypasses the validation checks provided by the developer catalog. Install charts only from URLs you trust, because unverified charts can introduce security risks to your cluster. When possible, use charts from the developer catalog or a configured Helm repository instead.
Prerequisites
- You’ve logged in to the Red Hat OpenShift Service on AWS web console.
- You have the necessary project permissions to install a Helm chart.
- You have a URL for a Helm chart.
Procedure
- In the Red Hat OpenShift Service on AWS web console, select Ecosystem > Helm from the navigation menu. The Helm view opens.
- In the Project drop-down menu, select the project where you want to install the Helm release; for example, default.
- From the Helm Releases tab, click Create.
- Select Helm chart URL. The Install Helm chart from URL view opens.
In the Chart URL field, enter the URL for the Helm chart you want to install.
NoteFor Helm charts stored in an OCI-compliant registry, the URL must use the
oci://protocol; for example,oci://quay.io/organization/repository/chart-name.- In the Release name field, enter a name for the Helm release you want to install.
- In the Chart version field, enter the chart version number if it is not detected automatically.
Click Next. The Configure Helm release view opens.
- Review the configuration. Make sure that Chart URL, Release name, and Chart version are correct.
For the Configure via option, select either Form view or YAML view.
- Choose Form view (the default) for a guided configuration of standard parameters.
Choose YAML view if you need to modify advanced settings that are not available in the form view.
NoteThe Form view might not display every field from your Helm chart. For full control over all configuration parameters, select YAML view.
- Click Install. The Helm Releases tab opens and, if the release installation is successful, its status is Deployed.
Verification
- The new Helm release is listed in the table on the Helm Releases tab.
- The Status column for the Helm release displays Deployed.
5.4.2. Upgrading a Helm release
You can upgrade a Helm release to use a new chart version or update your release configuration.
Procedure
- In the Topology view, select the Helm release to see the side panel.
- Click Actions > Upgrade Helm Release.
On the Upgrade Helm Release page, if you can edit the Chart Version field, select the chart version you want to upgrade to, edit the values as needed, then click Upgrade to create a revision of the Helm release. The Helm Releases page shows both revisions.
NoteIf you installed the Helm chart using a direct URL, you can’t change Chart Version. Instead, edit the values in Form view or YAML view.
5.4.3. Rolling back a Helm release
If a release fails, you can rollback the Helm release to a previous version.
Procedure
To rollback a release using the Helm view:
- In the Developer perspective, navigate to the Helm view to see the Helm Releases in the namespace.
-
Click the Options menu
adjoining the listed release, and select Rollback.
- In the Rollback Helm Release page, select the Revision you want to rollback to and click Rollback.
- In the Helm Releases page, click on the chart to see the details and resources for that release.
Go to the Revision History tab to see all the revisions for the chart.
Figure 5.2. Helm revision history
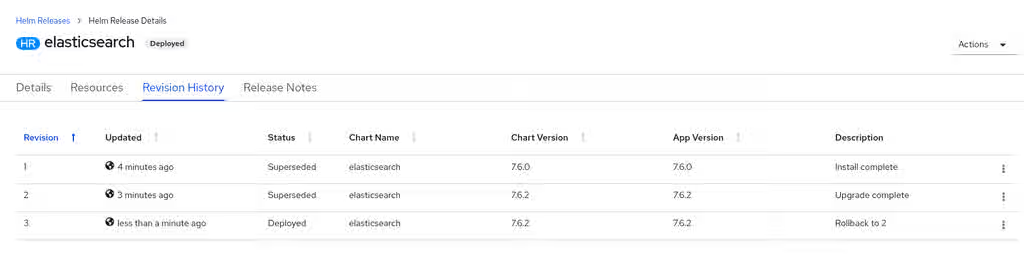
-
If required, you can further use the Options menu
adjoining a particular revision and select the revision to rollback to.
5.4.4. Deleting a Helm release
Procedure
- In the Topology view, right-click the Helm release and select Delete Helm Release.
- In the confirmation prompt, enter the name of the chart and click Delete.
5.4.5. Additional resources
Chapter 6. Deployments
6.1. Custom domains for applications
You can configure a custom domain for your applications. Custom domains are specific wildcard domains that can be used with Red Hat OpenShift Service on AWS applications.
Starting with Red Hat OpenShift Service on AWS 4.14, the Custom Domain Operator is deprecated. To manage Ingress in Red Hat OpenShift Service on AWS 4.14, use the Ingress Operator. The functionality is unchanged for Red Hat OpenShift Service on AWS 4.13 and earlier versions.
6.1.1. Configuring custom domains for applications
The top-level domains (TLDs) are owned by the customer that is operating the Red Hat OpenShift Service on AWS cluster. The Custom Domains Operator sets up a new ingress controller with a custom certificate as a second day operation. The public DNS record for this ingress controller can then be used by an external DNS to create a wildcard CNAME record for use with a custom domain.
Custom API domains are not supported because Red Hat controls the API domain. However, customers can change their application domains. For private custom domains with a private IngressController, set .spec.scope to Internal in the CustomDomain CR.
Prerequisites
-
A user account with
dedicated-adminprivileges -
A unique domain or wildcard domain, such as
*.apps.<company_name>.io -
A custom certificate or wildcard custom certificate, such as
CN=*.apps.<company_name>.io -
Access to a cluster with the latest version of the
ocCLI installed
Do not use the reserved names default or apps*, such as apps or apps2, in the metadata/name: section of the CustomDomain CR.
Procedure
Create a new TLS secret from a private key and a public certificate, where
fullchain.pemandprivkey.pemare your public or private wildcard certificates.Example
$ oc create secret tls <name>-tls --cert=fullchain.pem --key=privkey.pem -n <my_project>
Create a new
CustomDomaincustom resource (CR):Example
<company_name>-custom-domain.yamlapiVersion: managed.openshift.io/v1alpha1 kind: CustomDomain metadata: name: <company_name> spec: domain: apps.<company_name>.io scope: External loadBalancerType: Classic certificate: name: <name>-tls namespace: <my_project> routeSelector: matchLabels: route: acme namespaceSelector: matchLabels: type: shardedwhere:
spec.domain- Specifies the custom domain.
spec.loadBalancerType-
Specifies the type of load balancer for your custom domain. This type can be the default
classicorNLBif you use a network load balancer. spec.certificate.name- Specifies the secret created in the previous step.
spec.routeSelector- Optional. Filters the set of routes serviced by the CustomDomain ingress. If no value is provided, the default is no filtering.
spec.namespaceSelector- Optional. Filters the set of namespaces serviced by the CustomDomain ingress. If no value is provided, the default is no filtering.
Apply the CR:
Example
$ oc apply -f <company_name>-custom-domain.yaml
Get the status of your newly created CR:
$ oc get customdomains
Example output
NAME               ENDPOINT                                                    DOMAIN                       STATUS
<company_name>     xxrywp.<company_name>.cluster-01.opln.s1.openshiftapps.com  *.apps.<company_name>.io     Ready
Using the endpoint value, add a new wildcard CNAME record set to your managed DNS provider, such as Route53, Azure DNS, or Google DNS.
Example
*.apps.<company_name>.io -> xxrywp.<company_name>.cluster-01.opln.s1.openshiftapps.com
Create a new application and expose it:
Example
$ oc new-app --docker-image=docker.io/openshift/hello-openshift -n my-project
$ oc create route <route_name> --service=hello-openshift hello-openshift-tls --hostname hello-openshift-tls-my-project.apps.<company_name>.io -n my-project
$ oc get route -n my-project
$ curl https://hello-openshift-tls-my-project.apps.<company_name>.io
Hello OpenShift!
6.1.2. Renewing a certificate for custom domains
You can renew certificates with the Custom Domains Operator (CDO) by using the oc CLI tool.
Prerequisites
-
You have the latest version
ocCLI tool installed.
Procedure
Create new secret
$ oc create secret tls <secret-new> --cert=fullchain.pem --key=privkey.pem -n <my_project>
Patch CustomDomain CR
$ oc patch customdomain <company_name> --type='merge' -p '{"spec":{"certificate":{"name":"<secret-new>"}}}'Delete old secret
$ oc delete secret <secret-old> -n <my_project>
Troubleshooting
6.2. Understanding deployments
You can use Deployment and DeploymentConfig objects in Red Hat OpenShift Service on AWS to describe the desired state of an application and to manage pods through replica sets or replication controllers. Use Deployment objects unless you need a feature that only DeploymentConfig objects provide.
The Deployment and DeploymentConfig API objects provide two similar but different methods for fine-grained management over common user applications. They are composed of the following separate API objects:
-
A
DeploymentorDeploymentConfigobject, either of which describes the desired state of a particular component of the application as a pod template. -
Deploymentobjects involve one or more replica sets, which contain a point-in-time record of the state of a deployment as a pod template. Similarly,DeploymentConfigobjects involve one or more replication controllers, which preceded replica sets. - One or more pods, which represent an instance of a particular version of an application.
As of Red Hat OpenShift Service on AWS 4.14, DeploymentConfig objects are deprecated. DeploymentConfig objects are still supported, but are not recommended for new installations. Only security-related and critical issues will be fixed.
Instead, use Deployment objects or another alternative to provide declarative updates for pods.
6.2.1. Building blocks of a deployment
Deployments and deployment configs are enabled by the use of native Kubernetes API objects ReplicaSet and ReplicationController, respectively, as their building blocks.
Users do not have to manipulate replica sets, replication controllers, or pods owned by Deployment or DeploymentConfig objects. The deployment systems ensure changes are propagated appropriately.
If the existing deployment strategies are not suited for your use case and you must run manual steps during the lifecycle of your deployment, then you should consider creating a custom deployment strategy.
The following sections provide further details on these objects.
6.2.1.1. Replica sets
To keep a specified number of identical pods running in Red Hat OpenShift Service on AWS, you can use a Kubernetes ReplicaSet object. Deployments create and manage replica sets for you, so use a replica set directly only when you need custom update orchestration or no updates at all.
Only use replica sets if you require custom update orchestration or do not require updates at all. Otherwise, use deployments. Replica sets can be used independently, but are used by deployments to orchestrate pod creation, deletion, and updates. Deployments manage their replica sets automatically, provide declarative updates to pods, and do not have to manually manage the replica sets that they create.
The following is an example ReplicaSet definition:
apiVersion: apps/v1
kind: ReplicaSet
metadata:
  name: frontend-1
  labels:
    tier: frontend
spec:
  replicas: 3
  selector:
    matchLabels:
      tier: frontend
    matchExpressions:
      - {key: tier, operator: In, values: [frontend]}
  template:
    metadata:
      labels:
        tier: frontend
    spec:
      containers:
      - image: openshift/hello-openshift
        name: helloworld
        ports:
        - containerPort: 8080
          protocol: TCP
restartPolicy: Always-
spec.selectoris a label query over a set of resources. The result ofmatchLabelsandmatchExpressionsare logically conjoined. -
spec.selector.matchLabelsis an equality-based selector that specifies resources with labels that match the selector. -
spec.selector.matchExpressionsis a set-based selector that filters keys. This parameter selects all resources with key equal totierand value equal tofrontend.
6.2.1.2. Replication controllers
To keep a specified number of identical pods running in Red Hat OpenShift Service on AWS, you can use a replication controller. Create one through a DeploymentConfig object rather than directly, and use a replica set instead when you need set-based selectors or custom update orchestration.
Similar to a replica set, a replication controller ensures that a specified number of replicas of a pod are running at all times. If pods exit or are deleted, the replication controller instantiates more up to the defined number. Likewise, if there are more running than desired, it deletes as many as necessary to match the defined amount. The difference between a replica set and a replication controller is that a replica set supports set-based selector requirements whereas a replication controller only supports equality-based selector requirements.
A replication controller configuration consists of:
- The number of replicas desired, which can be adjusted at run time.
-
A
Poddefinition to use when creating a replicated pod. - A selector for identifying managed pods.
A selector is a set of labels assigned to the pods that are managed by the replication controller. These labels are included in the Pod definition that the replication controller instantiates. The replication controller uses the selector to determine how many instances of the pod are already running in order to adjust as needed.
The replication controller does not perform auto-scaling based on load or traffic, as it does not track either. Rather, this requires its replica count to be adjusted by an external auto-scaler.
Use a DeploymentConfig to create a replication controller instead of creating replication controllers directly.
If you require custom orchestration or do not require updates, use replica sets instead of replication controllers.
The following is an example definition of a replication controller:
apiVersion: v1
kind: ReplicationController
metadata:
  name: frontend-1
spec:
  replicas: 1
  selector:
    name: frontend
  template:
    metadata:
      labels:
        name: frontend
    spec:
      containers:
      - image: openshift/hello-openshift
        name: helloworld
        ports:
        - containerPort: 8080
          protocol: TCP
restartPolicy: Always-
spec.replicasspecifies the number of copies of the pod to run. -
spec.selectorspecifies the label selector of the pod to run. -
spec.templatespecifies the template for the pod the controller creates. -
spec.template.metadata.labelsspecifies the labels that the pod should include from the label selector. -
spec.template.metadata.labels.namespecifies the name of the labels. The maximum name length after expanding any parameters is 63 characters.
6.2.2. Deployments
To run and update application pods in Red Hat OpenShift Service on AWS, you can use a Kubernetes Deployment object. A deployment describes the desired state of an application component as a pod template and creates replica sets that manage pod lifecycles.
For example, the following deployment definition creates a replica set to bring up one hello-openshift pod:
Deployment definition
apiVersion: apps/v1
kind: Deployment
metadata:
  name: hello-openshift
spec:
  replicas: 1
  selector:
    matchLabels:
      app: hello-openshift
  template:
    metadata:
      labels:
        app: hello-openshift
    spec:
      containers:
      - name: hello-openshift
        image: openshift/hello-openshift:latest
        ports:
- containerPort: 806.2.3. DeploymentConfig objects
As of Red Hat OpenShift Service on AWS 4.14, DeploymentConfig objects are deprecated. DeploymentConfig objects are still supported, but are not recommended for new installations. Only security-related and critical issues will be fixed.
Instead, use Deployment objects or another alternative to provide declarative updates for pods.
You can use DeploymentConfig objects in Red Hat OpenShift Service on AWS to roll out image updates, run lifecycle hooks, trigger automated deployments, and scale or roll back applications. A DeploymentConfig object builds on replication controllers to manage the application deployment lifecycle.
Building on replication controllers, Red Hat OpenShift Service on AWS adds expanded support for the software development and deployment lifecycle with the concept of DeploymentConfig objects. In the simplest case, a DeploymentConfig object creates a new replication controller and lets it start up pods.
However, Red Hat OpenShift Service on AWS deployments from DeploymentConfig objects also provide the ability to transition from an existing deployment of an image to a new one and also define hooks to be run before or after creating the replication controller.
The DeploymentConfig deployment system provides the following capabilities:
-
A
DeploymentConfigobject, which is a template for running applications. - Triggers that drive automated deployments in response to events.
- User-customizable deployment strategies to transition from the previous version to the new version. A strategy runs inside a pod commonly referred as the deployment process.
- A set of hooks (lifecycle hooks) for executing custom behavior in different points during the lifecycle of a deployment.
- Versioning of your application to support rollbacks either manually or automatically in case of deployment failure.
- Manual replication scaling and autoscaling.
When you create a DeploymentConfig object, a replication controller is created representing the DeploymentConfig object’s pod template. If the deployment changes, a new replication controller is created with the latest pod template, and a deployment process runs to scale down the old replication controller and scale up the new one.
Instances of your application are automatically added and removed from both service load balancers and routers as they are created. As long as your application supports graceful shutdown when it receives the TERM signal, you can ensure that running user connections are given a chance to complete normally.
The Red Hat OpenShift Service on AWS DeploymentConfig object defines the following details:
-
The elements of a
ReplicationControllerdefinition. - Triggers for creating a new deployment automatically.
- The strategy for transitioning between deployments.
- Lifecycle hooks.
Each time a deployment is triggered, whether manually or automatically, a deployer pod manages the deployment (including scaling down the old replication controller, scaling up the new one, and running hooks). The deployment pod remains for an indefinite amount of time after it completes the deployment to retain its logs of the deployment. When a deployment is superseded by another, the previous replication controller is retained to enable easy rollback if needed.
Example DeploymentConfig definition
apiVersion: apps.openshift.io/v1
kind: DeploymentConfig
metadata:
  name: frontend
spec:
  replicas: 5
  selector:
    name: frontend
  template: { ... }
  triggers:
  - type: ConfigChange
  - imageChangeParams:
      automatic: true
      containerNames:
      - helloworld
      from:
        kind: ImageStreamTag
        name: hello-openshift:latest
    type: ImageChange
  strategy:
type: Rolling-
spec.triggers.type.ConfigChangeis a configuration change trigger that creates a new replication controller whenever changes are detected in the pod template of the deployment configuration. -
spec.triggers.type.ImageChangeis an image change trigger that causes a new deployment to be created each time a new version of the backing image is available in the named image stream. -
spec.strategy.type.Rollingis the default strategy that makes a downtime-free transition between deployments.
6.2.4. Comparing Deployment and DeploymentConfig objects
You can use both Kubernetes Deployment objects and Red Hat OpenShift Service on AWS DeploymentConfig objects to manage application rollouts. Before deciding which to use, understand the differences between the two objects in design and supported features.
Use Deployment objects unless you need a capability that only DeploymentConfig objects provide.
The following sections go into more detail on the differences between the two object types to further help you decide which type to use.
As of Red Hat OpenShift Service on AWS 4.14, DeploymentConfig objects are deprecated. DeploymentConfig objects are still supported, but are not recommended for new installations. Only security-related and critical issues will be fixed.
Instead, use Deployment objects or another alternative to provide declarative updates for pods.
6.2.4.1. Design
One important difference between Deployment and DeploymentConfig objects is the properties of the Content from en.wikipedia.org is not included.CAP theorem that each design has chosen for the rollout process. DeploymentConfig objects prefer consistency, whereas Deployments objects take availability over consistency.
For DeploymentConfig objects, if a node running a deployer pod goes down, it will not get replaced. The process waits until the node comes back online or is manually deleted. Manually deleting the node also deletes the corresponding pod. This means that you can not delete the pod to unstick the rollout, as the kubelet is responsible for deleting the associated pod.
However, deployment rollouts are driven from a controller manager. The controller manager runs in high availability mode on masters and uses leader election algorithms to value availability over consistency. During a failure it is possible for other masters to act on the same deployment at the same time, but this issue will be reconciled shortly after the failure occurs.
6.2.4.2. Deployment-specific features
You can use Deployment objects in Red Hat OpenShift Service on AWS to roll out multiple sets of rollouts, scale ongoing rollouts during updates, or pause mid-rollout. These capabilities differ from DeploymentConfig objects and can make application updates faster and more flexible.
6.2.4.2.1. Rollover
The deployment process for Deployment objects is driven by a controller loop, in contrast to DeploymentConfig objects that use deployer pods for every new rollout. This means that the Deployment object can have as many active replica sets as possible, and eventually the deployment controller will scale down all old replica sets and scale up the newest one.
DeploymentConfig objects can have at most one deployer pod running, otherwise multiple deployers might conflict when trying to scale up what they think should be the newest replication controller. Because of this, only two replication controllers can be active at any point in time. Ultimately, this results in faster rapid rollouts for Deployment objects.
6.2.4.2.2. Proportional scaling
Because the deployment controller is the sole source of truth for the sizes of new and old replica sets owned by a Deployment object, it can scale ongoing rollouts. Additional replicas are distributed proportionally based on the size of each replica set.
DeploymentConfig objects cannot be scaled when a rollout is ongoing because the controller will have issues with the deployer process about the size of the new replication controller.
6.2.4.2.3. Pausing mid-rollout
Deployments can be paused at any point in time, meaning you can also pause ongoing rollouts. However, you currently cannot pause deployer pods; if you try to pause a deployment in the middle of a rollout, the deployer process is not affected and continues until it finishes.
6.2.4.3. DeploymentConfig object-specific features
When using DeploymentConfig objects in Red Hat OpenShift Service on AWS, you can set Lifecycle hooks and configure custom deployment strategies. DeploymentConfig objects also provide automatic replica set rollbacks upon failure and automatic roll out of updates.
These capabilities are specific to DeploymentConfig objects and are not available on Kubernetes Deployment objects.
6.2.4.3.1. Automatic rollbacks
Currently, deployments do not support automatically rolling back to the last successfully deployed replica set in case of a failure.
6.2.4.3.2. Triggers
Deployments have an implicit config change trigger in that every change in the pod template of a deployment automatically triggers a new rollout. If you do not want new rollouts on pod template changes, pause the deployment:
$ oc rollout pause deployments/<name>
6.2.4.3.3. Lifecycle hooks
Deployments do not yet support any lifecycle hooks.
6.2.4.3.4. Custom strategies
Deployments do not support user-specified custom deployment strategies.
6.3. Managing deployment processes
6.3.1. Managing DeploymentConfig objects
As of Red Hat OpenShift Service on AWS 4.14, DeploymentConfig objects are deprecated. DeploymentConfig objects are still supported, but are not recommended for new installations. Only security-related and critical issues will be fixed.
Instead, use Deployment objects or another alternative to provide declarative updates for pods.
You can manage DeploymentConfig objects from the Red Hat OpenShift Service on AWS web console’s Workloads page or by using the oc CLI, depending on your preference.
The following procedures show CLI usage unless otherwise stated.
6.3.1.1. Starting a deployment
To begin a new rollout of your application in Red Hat OpenShift Service on AWS, you can start a deployment from an existing DeploymentConfig object. Use the oc rollout latest command to create a new replication controller and run the deployment process.
Procedure
To start a new deployment process from an existing
DeploymentConfigobject, run the following command:$ oc rollout latest dc/<name>
NoteIf a deployment process is already in progress, the command displays a message and a new replication controller will not be deployed.
6.3.1.2. Viewing a deployment
To review the rollout history of your application in Red Hat OpenShift Service on AWS, you can view a deployment. Use the oc rollout history and oc describe commands to inspect revisions of a DeploymentConfig object.
Procedure
To show details about all recently created replication controllers for the provided
DeploymentConfigobject, including any currently running deployment process, run the following command:$ oc rollout history dc/<name>
To view details specific to a revision, add the
--revisionflag:$ oc rollout history dc/<name> --revision=1
For more detailed information about a
DeploymentConfigobject and its latest revision, use theoc describecommand:$ oc describe dc <name>
6.3.1.3. Retrying a deployment
To restart a failed rollout of a DeploymentConfig object in Red Hat OpenShift Service on AWS, you can retry the deployment. Use the oc rollout retry command to restart the same revision without creating a new deployment revision.
Procedure
To restart a failed deployment process:
$ oc rollout retry dc/<name>
If the latest revision of it was deployed successfully, the command displays a message and the deployment process is not retried.
NoteRetrying a deployment restarts the deployment process and does not create a new deployment revision. The restarted replication controller has the same configuration it had when it failed.
6.3.1.4. Rolling back a deployment
To revert an application to a previous revision, you can perform a roll back by using the REST API, the CLI, or the web console.
Procedure
To rollback to the last successful deployed revision of your configuration:
$ oc rollout undo dc/<name>
The
DeploymentConfigobject’s template is reverted to match the deployment revision specified in the undo command, and a new replication controller is started. If no revision is specified with--to-revision, then the last successfully deployed revision is used.Image change triggers on the
DeploymentConfigobject are disabled as part of the rollback to prevent accidentally starting a new deployment process soon after the rollback is complete.To re-enable the image change triggers:
$ oc set triggers dc/<name> --auto
Deployment configs also support automatically rolling back to the last successful revision of the configuration in case the latest deployment process fails. In that case, the latest template that failed to deploy stays intact by the system and it is up to users to fix their configurations.
6.3.1.5. Executing commands inside a container
To change how a container starts in a DeploymentConfig object in Red Hat OpenShift Service on AWS, you can set a command and optional args in the pod template. These values override the image ENTRYPOINT and differ from lifecycle hooks, which run once per deployment at a specified time.
Procedure
Add the
commandparameters to thespecfield of theDeploymentConfigobject. You can also add anargsfield, which modifies thecommand(or theENTRYPOINTifcommanddoes not exist).kind: DeploymentConfig apiVersion: apps.openshift.io/v1 metadata: name: example-dc # ... spec: template: # ... spec: containers: - name: <container_name> image: 'image' command: - '<command>' args: - '<argument_1>' - '<argument_2>' - '<argument_3>'For example, to execute the
javacommand with the-jarand/opt/app-root/springboots2idemo.jararguments:kind: DeploymentConfig apiVersion: apps.openshift.io/v1 metadata: name: example-dc # ... spec: template: # ... spec: containers: - name: example-spring-boot image: 'image' command: - java args: - '-jar' - /opt/app-root/springboots2idemo.jar # ...
6.3.1.6. Viewing deployment logs
To troubleshoot a rollout in Red Hat OpenShift Service on AWS, you can view deployment logs for a DeploymentConfig object. Use the oc logs command to stream logs from the latest revision or from an older failed deployment process.
Procedure
To stream the logs of the latest revision for a given
DeploymentConfigobject:$ oc logs -f dc/<name>
If the latest revision is running or failed, the command returns the logs of the process that is responsible for deploying your pods. If it is successful, it returns the logs from a pod of your application.
You can also view logs from older failed deployment processes, if and only if these processes (old replication controllers and their deployer pods) exist and have not been pruned or deleted manually:
$ oc logs --version=1 dc/<name>
6.3.1.7. Deployment triggers
A deployment trigger on a DeploymentConfig object in Red Hat OpenShift Service on AWS starts a new deployment process when cluster events occur. Use config change or image change triggers to roll out automatically, or leave triggers empty if you want to start deployments manually.
If no triggers are defined on a DeploymentConfig object, a config change trigger is added by default. If triggers are defined as an empty field, deployments must be started manually.
6.3.1.7.1. Config change deployment triggers
The config change trigger results in a new replication controller whenever configuration changes are detected in the pod template of the DeploymentConfig object.
If a config change trigger is defined on a DeploymentConfig object, the first replication controller is automatically created soon after the DeploymentConfig object itself is created and it is not paused.
Config change deployment trigger
kind: DeploymentConfig
apiVersion: apps.openshift.io/v1
metadata:
  name: example-dc
# ...
spec:
# ...
  triggers:
- type: "ConfigChange"6.3.1.7.2. Image change deployment triggers
The image change trigger results in a new replication controller whenever the content of an image stream tag changes (when a new version of the image is pushed).
Image change deployment trigger
kind: DeploymentConfig
apiVersion: apps.openshift.io/v1
metadata:
  name: example-dc
# ...
spec:
# ...
  triggers:
    - type: "ImageChange"
      imageChangeParams:
        automatic: true
        from:
          kind: "ImageStreamTag"
          name: "origin-ruby-sample:latest"
          namespace: "myproject"
        containerNames:
          - "helloworld"
If the spec.triggers.imageChangeParams.automatic field is set to true, the trigger is enabled. If false, the trigger is disabled.
With the above example, when the latest tag value of the origin-ruby-sample image stream changes and the new image value differs from the current image specified in the DeploymentConfig object’s helloworld container, a new replication controller is created using the new image for the helloworld container.
If an image change trigger is defined on a DeploymentConfig object (with a config change trigger and automatic=false, or with automatic=true) and the image stream tag pointed by the image change trigger does not exist yet, the initial deployment process will automatically start as soon as an image is imported or pushed by a build to the image stream tag.
6.3.1.7.3. Setting deployment triggers
To automatically start a new rollout when an image changes in Red Hat OpenShift Service on AWS, you can set deployment triggers on a DeploymentConfig object. Use the oc set triggers command to configure an image change trigger for a container.
Procedure
You can set deployment triggers for a
DeploymentConfigobject using theoc set triggerscommand. For example, to set a image change trigger, use the following command:$ oc set triggers dc/<dc_name> \ --from-image=<project>/<image>:<tag> -c <container_name>
6.3.1.8. Setting deployment resources
To limit CPU, memory, and ephemeral storage used by a deployment in Red Hat OpenShift Service on AWS, you can set resource limits on the deployment strategy. Define limits in the resources section so deployer pods do not consume unbounded node capacity.
A deployment is completed by a pod that consumes resources (memory, CPU, and ephemeral storage) on a node. By default, pods consume unbounded node resources. However, if a project specifies default container limits, then pods consume resources up to those limits.
The minimum memory limit for a deployment is 12 MB. If a container fails to start due to a Cannot allocate memory pod event, the memory limit is too low. Either increase or remove the memory limit. Removing the limit allows pods to consume unbounded node resources.
You can also limit resource use by specifying resource limits as part of the deployment strategy. Deployment resources can be used with the recreate, rolling, or custom deployment strategies.
Procedure
In the following example, each of
resources,cpu,memory, andephemeral-storageis optional:kind: Deployment apiVersion: apps/v1 metadata: name: hello-openshift # ... spec: # ... type: "Recreate" resources: limits: cpu: "100m" memory: "256Mi" ephemeral-storage: "1Gi"-
spec.resources.limits.cpuspecifies the CPU units:100mrepresents 0.1 CPU units (100 * 1e-3). -
spec.resources.limits.memoryspecifies the bytes for memory:256Mirepresents 268435456 bytes (256 * 2 ^ 20). spec.resources.limits.ephemeral-storagespecifies the bytes for ephemeral-storage:1Girepresents 1073741824 bytes (2 ^ 30).However, if a quota has been defined for your project, one of the following two items is required:
A
resourcessection set with an explicitrequests:kind: Deployment apiVersion: apps/v1 metadata: name: hello-openshift # ... spec: # ... type: "Recreate" resources: requests: cpu: "100m" memory: "256Mi" ephemeral-storage: "1Gi"The
spec.resources.requestsobject contains the list of resources that correspond to the list of resources in the quota.-
A limit range defined in your project, where the defaults from the
LimitRangeobject apply to pods created during the deployment process.
To set deployment resources, choose one of the above options. Otherwise, deploy pod creation fails, citing a failure to satisfy quota.
-
6.3.1.9. Scaling manually
To control how many pod replicas run for a DeploymentConfig object in Red Hat OpenShift Service on AWS, you can scale manually. Use the oc scale command to set the desired number of replicas.
Pods can also be auto-scaled using the oc autoscale command.
Procedure
To manually scale a
DeploymentConfigobject, use theoc scalecommand. For example, the following command sets the replicas in thefrontendDeploymentConfigobject to3.$ oc scale dc frontend --replicas=3
The number of replicas eventually propagates to the desired and current state of the deployment configured by the
DeploymentConfigobjectfrontend.
6.3.1.10. Accessing private repositories from DeploymentConfig objects
To pull container images from a private repository into a DeploymentConfig object in Red Hat OpenShift Service on AWS, you can add a pull secret to the object. Create the secret in the web console, then set it as the pull secret in the DeploymentConfig object.
Procedure
- Create a new project.
- Navigate to Workloads → Secrets.
- Create a secret that contains credentials for accessing a private image repository.
- Navigate to Workloads → DeploymentConfigs.
-
Create a
DeploymentConfigobject. -
On the
DeploymentConfigobject editor page, set the Pull Secret and save your changes.
6.3.1.11. Running a pod with a different service account
To run pods under a non-default identity in Red Hat OpenShift Service on AWS, you can assign a different service account to a DeploymentConfig object. Edit the object and set the serviceAccount and serviceAccountName fields to the account you want to use.
Procedure
Edit the
DeploymentConfigobject:$ oc edit dc/<deployment_config>
Add the
serviceAccountandserviceAccountNameparameters to thespecfield, and specify the service account you want to use:apiVersion: apps.openshift.io/v1 kind: DeploymentConfig metadata: name: example-dc # ... spec: # ... securityContext: {} serviceAccount: <service_account> serviceAccountName: <service_account>
6.4. Using deployment strategies
To upgrade applications with little or no downtime in Red Hat OpenShift Service on AWS, you can use a deployment strategy. Choose strategies that use DeploymentConfig object features or router features depending on whether you need to affect all routes or only specific ones.
Because users generally access applications through a route handled by a router, deployment strategies can focus on DeploymentConfig object features or routing features. Strategies that focus on DeploymentConfig object features impact all routes that use the application. Strategies that use router features target individual routes.
Most deployment strategies are supported through the DeploymentConfig object, and some additional strategies are supported through router features.
6.4.1. Choosing a deployment strategy
Consider the following when choosing a deployment strategy:
- Long-running connections must be handled gracefully.
- Database conversions can be complex and must be done and rolled back along with the application.
- If the application is a hybrid of microservices and traditional components, downtime might be required to complete the transition.
- You must have the infrastructure to do this.
- If you have a non-isolated test environment, you can break both new and old versions.
A deployment strategy uses readiness checks to determine if a new pod is ready for use. If a readiness check fails, the DeploymentConfig object retries to run the pod until it times out. The default timeout is 10m, a value set in TimeoutSeconds in dc.spec.strategy.*params.
6.4.2. Rolling strategy
To update an application with little or no downtime in Red Hat OpenShift Service on AWS, you can use the rolling deployment strategy. New pods replace previous instances gradually after readiness checks succeed. This strategy is the default when none is specified on a DeploymentConfig object.
A rolling deployment typically waits for new pods to become ready via a readiness check before scaling down the old components. If a significant issue occurs, the rolling deployment can be aborted.
When to use a rolling deployment:
- When you want to take no downtime during an application update.
- When your application supports having old code and new code running at the same time.
A rolling deployment means you have both old and new versions of your code running at the same time. This typically requires that your application handle N-1 compatibility.
Example rolling strategy definition
kind: DeploymentConfig
apiVersion: apps.openshift.io/v1
metadata:
  name: example-dc
# ...
spec:
# ...
  strategy:
    type: Rolling
    rollingParams:
      updatePeriodSeconds: 1
      intervalSeconds: 1
      timeoutSeconds: 120
      maxSurge: "20%"
      maxUnavailable: "10%"
      pre: {}
post: {}-
spec.strategy.rollingParams.updatePeriodSecondsis the time to wait between individual pod updates. If unspecified, this value defaults to1. -
spec.strategy.rollingParams.intervalSecondsis the time to wait between polling the deployment status after update. If unspecified, this value defaults to1. -
spec.strategy.rollingParams.timeoutSecondsis the time to wait for a scaling event before giving up. Optional; the default is600. Here, giving up means automatically rolling back to the previous complete deployment. -
spec.strategy.rollingParams.maxSurgeis optional and defaults to25%if not specified. See the information below the following procedure. -
spec.strategy.rollingParams.maxUnavailableis optional and defaults to25%if not specified. See the information below the following procedure. -
spec.strategy.rollingParams.preandspec.strategy.rollingParams.postare lifecycle hooks.
The rolling strategy:
-
Executes any
prelifecycle hook. - Scales up the new replication controller based on the surge count.
- Scales down the old replication controller based on the max unavailable count.
- Repeats this scaling until the new replication controller has reached the desired replica count and the old replication controller has been scaled to zero.
-
Executes any
postlifecycle hook.
When scaling down, the rolling strategy waits for pods to become ready so it can decide whether further scaling would affect availability. If scaled up pods never become ready, the deployment process will eventually time out and result in a deployment failure.
The maxUnavailable parameter is the maximum number of pods that can be unavailable during the update. The maxSurge parameter is the maximum number of pods that can be scheduled above the original number of pods. Both parameters can be set to either a percentage (e.g., 10%) or an absolute value (e.g., 2). The default value for both is 25%.
These parameters allow the deployment to be tuned for availability and speed. For example:
-
maxUnavailable*=0andmaxSurge*=20%ensures full capacity is maintained during the update and rapid scale up. -
maxUnavailable*=10%andmaxSurge*=0performs an update using no extra capacity (an in-place update). -
maxUnavailable*=10%andmaxSurge*=10%scales up and down quickly with some potential for capacity loss.
Generally, if you want fast rollouts, use maxSurge. If you have to take into account resource quota and can accept partial unavailability, use maxUnavailable.
The default setting for maxUnavailable is 1 for all the machine config pools in Red Hat OpenShift Service on AWS. It is recommended to not change this value and update one control plane node at a time. Do not change this value to 3 for the control plane pool.
6.4.2.1. Canary deployments
To validate a new application version before replacing all pods in Red Hat OpenShift Service on AWS, you can use a canary deployment. All rolling deployments are canary deployments: the new instance is tested with readiness checks and automatically rolled back if it never becomes ready.
The readiness check is part of the application code and can be as sophisticated as necessary to ensure the new instance is ready to be used. If you must implement more complex checks of the application (such as sending real user workloads to the new instance), consider implementing a custom deployment or using a blue-green deployment strategy.
6.4.2.2. Creating a rolling deployment
To update an application with minimal downtime in Red Hat OpenShift Service on AWS, you can create a rolling deployment. Use the CLI to deploy an application, expose it, and trigger a new rollout so pods are gradually replaced.
Procedure
Create an application based on the example deployment images found in Content from quay.io is not included.Quay.io:
$ oc new-app quay.io/openshifttest/deployment-example:latest
NoteThis image does not expose any ports. If you want to expose your applications over an external LoadBalancer service or enable access to the application over the public internet, create a service by using the
oc expose dc/deployment-example --port=<port>command after completing this procedure.If you have the router installed, make the application available via a route or use the service IP directly.
$ oc expose svc/deployment-example
-
Browse to the application at
deployment-example.<project>.<router_domain>to verify you see thev1image. Scale the
DeploymentConfigobject up to three replicas:$ oc scale dc/deployment-example --replicas=3
Trigger a new deployment automatically by tagging a new version of the example as the
latesttag:$ oc tag deployment-example:v2 deployment-example:latest
-
In your browser, refresh the page until you see the
v2image. When using the CLI, the following command shows how many pods are on version 1 and how many are on version 2. In the web console, the pods are progressively added to v2 and removed from v1:
$ oc describe dc deployment-example
During the deployment process, the new replication controller is incrementally scaled up. After the new pods are marked as
ready(by passing their readiness check), the deployment process continues. If the pods do not become ready, the process aborts, and the deployment rolls back to its previous version.
6.4.2.3. Editing a deployment by using the Developer perspective
To change the strategy, images, environment variables, or advanced options for a deployment in Red Hat OpenShift Service on AWS, you can edit the deployment in the Developer perspective.
Open the application in the Topology view and use Edit Deployment to update settings such as rollouts and replicas.
Prerequisites
- You are in the Developer perspective of the web console.
- You have created an application.
Procedure
- Navigate to the Topology view.
- Click your application to see the Details panel.
- In the Actions drop-down menu, select Edit Deployment to view the Edit Deployment page.
You can edit the following Advanced options for your deployment:
Optional: You can pause rollouts by clicking Pause rollouts, and then selecting the Pause rollouts for this deployment checkbox.
By pausing rollouts, you can make changes to your application without triggering a rollout. You can resume rollouts at any time.
- Optional: Click Scaling to change the number of instances of your image by modifying the number of Replicas.
- Click Save.
6.4.2.4. Starting a rolling deployment using the Developer perspective
To upgrade an application with minimal downtime in Red Hat OpenShift Service on AWS, you can start a rolling deployment in the Developer perspective. From the Topology view, select Start Rollout to spin up the new version and then terminate the old pods.
Prerequisites
- You are in the Developer perspective of the web console.
- You have created an application.
Procedure
- In the Topology view, click the application node to see the Overview tab in the side panel. Note that the Update Strategy is set to the default Rolling strategy.
In the Actions drop-down menu, select Start Rollout to start a rolling update. The rolling deployment spins up the new version of the application and then terminates the old one.
Figure 6.1. Rolling update
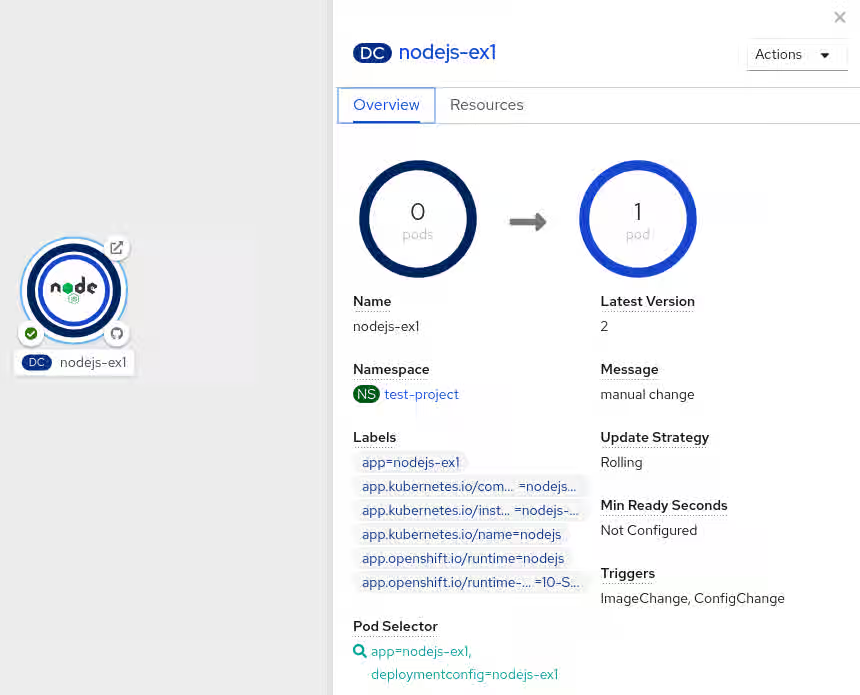
6.4.3. Recreate strategy
To replace all previous pods before starting the new version in Red Hat OpenShift Service on AWS, you can use the recreate deployment strategy. Scale the old deployment to zero, then scale up the new one, optionally running pre, mid, and post lifecycle hooks.
Example recreate strategy definition
kind: Deployment
apiVersion: apps/v1
metadata:
  name: hello-openshift
# ...
spec:
# ...
  strategy:
    type: Recreate
    recreateParams:
      pre: {}
      mid: {}
post: {}-
spec.strategy.recreateParamsare optional. -
spec.strategy.recreateParams.pre,spec.strategy.recreateParams.mid, andspec.strategy.recreateParams.postare lifecycle hooks.
The recreate strategy:
-
Executes any
prelifecycle hook. - Scales down the previous deployment to zero.
-
Executes any
midlifecycle hook. - Scales up the new deployment.
-
Executes any
postlifecycle hook.
During scale up, if the replica count of the deployment is greater than one, the first replica of the deployment will be validated for readiness before fully scaling up the deployment. If the validation of the first replica fails, the deployment will be considered a failure.
When to use a recreate deployment:
- When you must run migrations or other data transformations before your new code starts.
- When you do not support having new and old versions of your application code running at the same time.
- When you want to use a RWO volume, which is not supported being shared between multiple replicas.
A recreate deployment incurs downtime because, for a brief period, no instances of your application are running. However, your old code and new code do not run at the same time.
6.4.3.1. Editing a deployment by using the Developer perspective
To change the strategy, images, environment variables, or advanced options for a deployment in Red Hat OpenShift Service on AWS, you can edit the deployment in the Developer perspective.
Open the application in the Topology view and use Edit Deployment to update settings such as rollouts and replicas.
Prerequisites
- You are in the Developer perspective of the web console.
- You have created an application.
Procedure
- Navigate to the Topology view.
- Click your application to see the Details panel.
- In the Actions drop-down menu, select Edit Deployment to view the Edit Deployment page.
You can edit the following Advanced options for your deployment:
Optional: You can pause rollouts by clicking Pause rollouts, and then selecting the Pause rollouts for this deployment checkbox.
By pausing rollouts, you can make changes to your application without triggering a rollout. You can resume rollouts at any time.
- Optional: Click Scaling to change the number of instances of your image by modifying the number of Replicas.
- Click Save.
6.4.3.2. Starting a recreate deployment using the Developer perspective
To switch from a rolling update to a recreate rollout in Red Hat OpenShift Service on AWS, you can change the deployment strategy in the Developer perspective. Set the strategy type to Recreate in the YAML editor, then start a rollout from the Topology view.
Prerequisites
- Ensure that you are in the Developer perspective of the web console.
- Ensure that you have created an application using the Add view and see it deployed in the Topology view.
Procedure
- Click your application to see the Details panel.
- In the Actions drop-down menu, select Edit Deployment Config to see the deployment configuration details of the application.
-
In the YAML editor, change the
spec.strategy.typetoRecreateand click Save. - In the Topology view, select the node to see the Overview tab in the side panel. The Update Strategy is now set to Recreate.
Use the Actions drop-down menu to select Start Rollout to start an update using the recreate strategy. The recreate strategy first terminates pods for the older version of the application and then spins up pods for the new version.
Figure 6.2. Recreate update
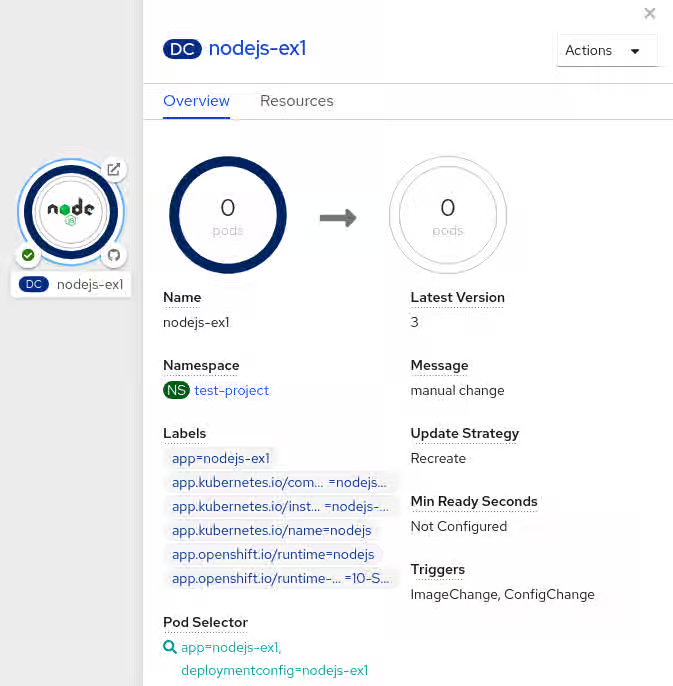
6.4.4. Custom strategy
To define your own rollout behavior in Red Hat OpenShift Service on AWS, you can use a custom deployment strategy. Provide a container image, command, and environment variables that control how the new deployment becomes active.
Example custom strategy definition
kind: DeploymentConfig
apiVersion: apps.openshift.io/v1
metadata:
  name: example-dc
# ...
spec:
# ...
  strategy:
    type: Custom
    customParams:
      image: organization/strategy
      command: [ "command", "arg1" ]
      environment:
        - name: ENV_1
          value: VALUE_1
In the above example, the organization/strategy container image provides the deployment behavior. The optional command array overrides any CMD directive specified in the image’s Dockerfile. The optional environment variables provided are added to the execution environment of the strategy process.
Additionally, Red Hat OpenShift Service on AWS provides the following environment variables to the deployment process:
| Environment variable | Description |
|---|---|
|
| The name of the new deployment, a replication controller. |
|
| The name space of the new deployment. |
The replica count of the new deployment will initially be zero. The responsibility of the strategy is to make the new deployment active using the logic that best serves the needs of the user.
Alternatively, use the customParams object to inject the custom deployment logic into the existing deployment strategies. Provide a custom shell script logic and call the openshift-deploy binary. Users do not have to supply their custom deployer container image; in this case, the default Red Hat OpenShift Service on AWS deployer image is used instead:
kind: DeploymentConfig
apiVersion: apps.openshift.io/v1
metadata:
  name: example-dc
# ...
spec:
# ...
  strategy:
    type: Rolling
    customParams:
      command:
      - /bin/sh
      - -c
      - |
        set -e
        openshift-deploy --until=50%
        echo Halfway there
        openshift-deploy
echo CompleteThis results in following deployment:
Started deployment #2
--> Scaling up custom-deployment-2 from 0 to 2, scaling down custom-deployment-1 from 2 to 0 (keep 2 pods available, don't exceed 3 pods)
    Scaling custom-deployment-2 up to 1
--> Reached 50% (currently 50%)
Halfway there
--> Scaling up custom-deployment-2 from 1 to 2, scaling down custom-deployment-1 from 2 to 0 (keep 2 pods available, don't exceed 3 pods)
    Scaling custom-deployment-1 down to 1
    Scaling custom-deployment-2 up to 2
    Scaling custom-deployment-1 down to 0
--> Success
CompleteIf the custom deployment strategy process requires access to the Red Hat OpenShift Service on AWS API or the Kubernetes API the container that executes the strategy can use the service account token available inside the container for authentication.
6.4.4.1. Editing a deployment by using the Developer perspective
To change the strategy, images, environment variables, or advanced options for a deployment in Red Hat OpenShift Service on AWS, you can edit the deployment in the Developer perspective.
Open the application in the Topology view and use Edit Deployment to update settings such as rollouts and replicas.
Prerequisites
- You are in the Developer perspective of the web console.
- You have created an application.
Procedure
- Navigate to the Topology view.
- Click your application to see the Details panel.
- In the Actions drop-down menu, select Edit Deployment to view the Edit Deployment page.
You can edit the following Advanced options for your deployment:
Optional: You can pause rollouts by clicking Pause rollouts, and then selecting the Pause rollouts for this deployment checkbox.
By pausing rollouts, you can make changes to your application without triggering a rollout. You can resume rollouts at any time.
- Optional: Click Scaling to change the number of instances of your image by modifying the number of Replicas.
- Click Save.
6.4.5. Lifecycle hooks
To run custom logic at specific points during a rollout in Red Hat OpenShift Service on AWS, you can use lifecycle hooks with the rolling or recreate strategy. Configure hooks such as pre with a failure policy to abort, retry, or ignore when a hook fails.
The rolling and recreate strategies support lifecycle hooks, or deployment hooks, which allow behavior to be injected into the deployment process at predefined points within the strategy as shown in the following example:
pre:
  failurePolicy: Abort
  execNewPod: {}
pre.execNewPod is a pod-based lifecycle hook.
Every hook has a failure policy, which defines the action the strategy should take when a hook failure is encountered:
|
| The deployment process will be considered a failure if the hook fails. |
|
| The hook execution should be retried until it succeeds. |
|
| Any hook failure should be ignored and the deployment should proceed. |
Hooks have a type-specific field that describes how to execute the hook. Currently, pod-based hooks are the only supported hook type, specified by the execNewPod field.
6.4.6. Pod-based lifecycle hook
Pod-based lifecycle hooks execute hook code in a new pod derived from the template in a DeploymentConfig object.
The following simplified example deployment uses the rolling strategy. Triggers and some other minor details are omitted for brevity:
kind: DeploymentConfig
apiVersion: apps.openshift.io/v1
metadata:
  name: frontend
spec:
  template:
    metadata:
      labels:
        name: frontend
    spec:
      containers:
        - name: helloworld
          image: openshift/origin-ruby-sample
  replicas: 5
  selector:
    name: frontendasciiditavale modules/creating-rolling-deployments-CLI.adoc

  strategy:
    type: Rolling
    rollingParams:
      pre:
        failurePolicy: Abort
        execNewPod:
          containerName: helloworld
          command: [ "/usr/bin/command", "arg1", "arg2" ]
          env:
            - name: CUSTOM_VAR1
              value: custom_value1
          volumes:
- data-
strategy.rollingParams.pre.execNewPod.containername.helloworldrefers tospec.template.spec.containers[0].name. -
strategy.rollingParams.pre.execNewPod.commandoverrides anyENTRYPOINTdefined by theopenshift/origin-ruby-sampleimage. -
strategy.rollingParams.pre.execNewPod.envis an optional set of environment variables for the hook container. -
strategy.rollingParams.pre.execNewPod.volumesis an optional set of volume references for the hook container.
In this example, the pre hook will be executed in a new pod using the openshift/origin-ruby-sample image from the helloworld container. The hook pod has the following properties:
-
The hook command is
/usr/bin/command arg1 arg2. -
The hook container has the
CUSTOM_VAR1=custom_value1environment variable. -
The hook failure policy is
Abort, meaning the deployment process fails if the hook fails. -
The hook pod inherits the
datavolume from theDeploymentConfigobject pod.
6.4.7. Setting lifecycle hooks
You can set lifecycle hooks, or deployment hooks, for a deployment using the CLI.
Procedure
Use the
oc set deployment-hookcommand to set the type of hook you want:--pre,--mid, or--post. For example, to set a pre-deployment hook:$ oc set deployment-hook dc/frontend \ --pre -c helloworld -e CUSTOM_VAR1=custom_value1 \ --volumes data --failure-policy=abort -- /usr/bin/command arg1 arg2
6.5. Using route-based deployment strategies
To roll out application changes to selected traffic in Red Hat OpenShift Service on AWS, you can use route-based deployment strategies with the router and Deployment objects.
These advanced strategies, including blue-green, A/B, and canary, affect specific routes rather than every route that resolves to the application.
The most common route-based strategy is to use a blue-green deployment. The new version (the green version) is brought up for testing and evaluation, while the users still use the stable version (the blue version). When ready, the users are switched to the green version. If a problem arises, you can switch back to the blue version.
Alternatively, you can use an A/B versions strategy in which both versions are active at the same time. With this strategy, some users can use version A, and other users can use version B. You can use this strategy to experiment with user interface changes or other features in order to get user feedback. You can also use it to verify proper operation in a production context where problems impact a limited number of users.
A canary deployment tests the new version but when a problem is detected it quickly falls back to the previous version. This can be done with both of the above strategies.
The route-based deployment strategies do not scale the number of pods in the services. To maintain desired performance characteristics the deployment configurations might have to be scaled.
6.5.1. Proxy shards and traffic splitting
To precisely control how traffic reaches application shards in Red Hat OpenShift Service on AWS, you can use relative scale and proxy shards. A proxy shard forwards or splits incoming requests to other services so you can implement percentage-based traffic, comparison testing, or related patterns.
In the simplest configuration, the proxy forwards requests unchanged. In more complex setups, you can duplicate the incoming requests and send to both a separate cluster as well as to a local instance of the application, and compare the result. Other patterns include keeping the caches of a DR installation warm, or sampling incoming traffic for analysis purposes.
Any TCP (or UDP) proxy could be run under the desired shard. Use the oc scale command to alter the relative number of instances serving requests under the proxy shard. For more complex traffic management, consider customizing the Red Hat OpenShift Service on AWS router with proportional balancing capabilities.
6.5.2. N-1 compatibility
To run old and new application code side by side during a rollout in Red Hat OpenShift Service on AWS, you need N-1 compatibility. Design your data and schemas so that values written by the new version can be read or safely ignored by the old version.
Applications that have new code and old code running at the same time must be careful to ensure that data written by the new code can be read and handled (or gracefully ignored) by the old version of the code. This is sometimes called schema evolution and is a complex problem.
This can take many forms: data stored on disk, in a database, in a temporary cache, or that is part of a user’s browser session. While most web applications can support rolling deployments, it is important to test and design your application to handle it.
For some applications, the period of time that old code and new code is running side by side is short, so bugs or some failed user transactions are acceptable. For others, the failure pattern may result in the entire application becoming non-functional.
One way to validate N-1 compatibility is to use an A/B deployment: run the old code and new code at the same time in a controlled way in a test environment, and verify that traffic that flows to the new deployment does not cause failures in the old deployment.
6.5.3. Graceful termination
To avoid dropping user connections when pods shut down in Red Hat OpenShift Service on AWS, you can rely on graceful termination. The platform sends a TERM signal so your application can stop accepting new traffic, close open connections, and exit before the grace period ends.
On shutdown, Red Hat OpenShift Service on AWS sends a TERM signal to the processes in the container. Application code, on receiving SIGTERM, stop accepting new connections. This ensures that load balancers route traffic to other active instances. The application code then waits until all open connections are closed, or gracefully terminate individual connections at the next opportunity, before exiting.
After the graceful termination period expires, a process that has not exited is sent the KILL signal, which immediately ends the process. The terminationGracePeriodSeconds attribute of a pod or pod template controls the graceful termination period (default 30 seconds) and can be customized per application as necessary.
6.5.4. Setting up a blue-green deployment
To switch users from a stable application version to a new one in Red Hat OpenShift Service on AWS, you can set up a blue-green deployment.
Run both versions at once, then point the production route at the new (green) service when you are ready, with the option to switch back to the blue version if needed.
Because many applications depend on persistent data, you must have an application that supports N-1 compatibility, which means it shares data and implements live migration between the database, store, or disk by creating two copies of the data layer.
Consider the data used in testing the new version. If it is the production data, a bug in the new version can break the production version.
Blue-green deployments use two Deployment objects. Both are running, and the one in production depends on the service the route specifies, with each Deployment object exposed to a different service.
Routes are intended for web (HTTP and HTTPS) traffic, so this technique is best suited for web applications.
You can create a new route to the new version and test it. When ready, change the service in the production route to point to the new service and the new (green) version is live.
If necessary, you can roll back to the older (blue) version by switching the service back to the previous version.
Procedure
Create two independent application components.
Create a copy of the example application running the
v1image under theexample-blueservice:$ oc new-app openshift/deployment-example:v1 --name=example-blue
Create a second copy that uses the
v2image under theexample-greenservice:$ oc new-app openshift/deployment-example:v2 --name=example-green
Create a route that points to the old service:
$ oc expose svc/example-blue --name=bluegreen-example
-
Browse to the application at
bluegreen-example-<project>.<router_domain>to verify you see thev1image. Edit the route and change the service name to
example-green:$ oc patch route/bluegreen-example -p '{"spec":{"to":{"name":"example-green"}}}'-
To verify that the route has changed, refresh the browser until you see the
v2image.
6.5.5. A/B deployments
To test a new application version with a limited share of production traffic in Red Hat OpenShift Service on AWS, you can use an A/B deployment. You send most requests to the stable version, route a fraction to the new version, and increase that fraction as testing progresses.
Because you control the portion of requests to each version, as testing progresses you can increase the fraction of requests to the new version and ultimately stop using the previous version. As you adjust the request load on each version, the number of pods in each service might have to be scaled as well to provide the expected performance.
In addition to upgrading software, you can use this feature to experiment with versions of the user interface. Since some users get the old version and some the new, you can evaluate the user’s reaction to the different versions to inform design decisions.
For this to be effective, both the old and new versions must be similar enough that both can run at the same time. This is common with bug fix releases and when new features do not interfere with the old. The versions require N-1 compatibility to properly work together.
Red Hat OpenShift Service on AWS supports N-1 compatibility through the web console as well as the CLI.
6.5.6. Load balancing for A/B testing
To split production traffic between application versions for A/B testing in Red Hat OpenShift Service on AWS, you can configure a route with weighted services. Use the oc set route-backends command or edit the route to assign weights so the router sends a proportional share of requests to each version.
You set up a route with multiple services. Each service handles a version of the application.
Each service is assigned a weight and the portion of requests to each service is the service_weight divided by the sum_of_weights. The weight for each service is distributed to the service’s endpoints so that the sum of the endpoint weights is the service weight.
The route can have up to four services. The weight for the service can be between 0 and 256. When the weight is 0, the service does not participate in load balancing but continues to serve existing persistent connections. When the service weight is not 0, each endpoint has a minimum weight of 1. Because of this, a service with a lot of endpoints can end up with higher weight than intended. In this case, reduce the number of pods to get the expected load balance weight.
Procedure
Create the two applications and give them different names. Each creates a
Deploymentobject. The applications are versions of the same program; one is usually the current production version and the other the proposed new version.Create the first application. The following example creates an application called
ab-example-a:$ oc new-app openshift/deployment-example --name=ab-example-a
Create the second application:
$ oc new-app openshift/deployment-example:v2 --name=ab-example-b
Both applications are deployed and services are created.
Make the application available externally via a route. At this point, you can expose either. It can be convenient to expose the current production version first and later modify the route to add the new version.
$ oc expose svc/ab-example-a
Browse to the application at
ab-example-a.<project>.<router_domain>to verify that you see the expected version.When you deploy the route, the router balances the traffic according to the
weightsspecified for the services. At this point, there is a single service with defaultweight=1so all requests go to it. Adding the other service as analternateBackendsand adjusting theweightsbrings the A/B setup to life. This can be done by theoc set route-backendscommand or by editing the route.NoteWhen using
alternateBackends, also use theroundrobinload balancing strategy to ensure requests are distributed as expected to the services based on weight.roundrobincan be set for a route by using a route annotation. See the Additional resources section for more information about route annotations.Setting the
oc set route-backendto0means the service does not participate in load balancing, but continues to serve existing persistent connections.NoteChanges to the route just change the portion of traffic to the various services. You might have to scale the deployment to adjust the number of pods to handle the anticipated loads.
To edit the route, run:
$ oc edit route <route_name>
Example output
apiVersion: route.openshift.io/v1
kind: Route
metadata:
  name: route-alternate-service
  annotations:
    haproxy.router.openshift.io/balance: roundrobin
# ...
spec:
  host: ab-example.my-project.my-domain
  to:
    kind: Service
    name: ab-example-a
    weight: 10
  alternateBackends:
  - kind: Service
    name: ab-example-b
    weight: 15
# ...
6.5.7. Managing weights of an existing route by using the web console
To split production traffic between application versions for A/B testing in Red Hat OpenShift Service on AWS, you can configure a route with weighted services. Use the oc set route-backends command or edit the route to assign weights so the router sends a proportional share of requests to each version.
Procedure
- Navigate to the Networking → Routes page.
-
Click the Options menu
next to the route you want to edit and select Edit Route.
-
Edit the YAML file. Update the
weightto be an integer between0and256that specifies the relative weight of the target against other target reference objects. The value0suppresses requests to this back end. The default is100. Runoc explain routes.spec.alternateBackendsfor more information about the options. - Click Save.
6.5.8. Managing weights of a new route by using the web console
To set traffic weights when you create a new route for A/B testing in Red Hat OpenShift Service on AWS, you can use the web console. Create the route, add an alternate service, and assign relative weights so the router distributes requests between application versions.
Procedure
- Navigate to the Networking → Routes page.
- Click Create Route.
- Enter the route Name.
- Select the Service.
- Click Add Alternate Service.
-
Enter a value for Weight and Alternate Service Weight. Enter a number between
0and255that depicts relative weight compared with other targets. The default is100. - Select the Target Port.
- Click Create.
6.5.9. Managing weights using the CLI
To manage service traffic weights for A/B testing in Red Hat OpenShift Service on AWS, you can use the oc set route-backends command. Set or adjust weights on a route so the router sends a proportional share of requests to each service.
Procedure
To manage the services and corresponding weights load balanced by the route, use the
oc set route-backendscommand:$ oc set route-backends ROUTENAME \ [--zero|--equal] [--adjust] SERVICE=WEIGHT[%] [...] [options]For example, the following sets
ab-example-aas the primary service withweight=198andab-example-bas the first alternate service with aweight=2:$ oc set route-backends ab-example ab-example-a=198 ab-example-b=2
This means 99% of traffic is sent to service
ab-example-aand 1% to serviceab-example-b.This command does not scale the deployment. You might be required to do so to have enough pods to handle the request load.
Run the command with no flags to verify the current configuration:
$ oc set route-backends ab-example
Example output
NAME                    KIND     TO           WEIGHT
routes/ab-example       Service  ab-example-a 198 (99%)
routes/ab-example       Service  ab-example-b 2   (1%)
To override the default values for the load balancing algorithm, adjust the annotation on the route by setting the algorithm to
roundrobin. For a route on Red Hat OpenShift Service on AWS, the default load balancing algorithm is set torandomorsourcevalues.To set the algorithm to
roundrobin, run the command:$ oc annotate routes/<route-name> haproxy.router.openshift.io/balance=roundrobin
For Transport Layer Security (TLS) passthrough routes, the default value is
source. For all other routes, the default israndom.To alter the weight of an individual service relative to itself or to the primary service, use the
--adjustflag. Specifying a percentage adjusts the service relative to either the primary or the first alternate (if you specify the primary). If there are other backends, their weights are kept proportional to the changed.The following example alters the weight of
ab-example-aandab-example-bservices:$ oc set route-backends ab-example --adjust ab-example-a=200 ab-example-b=10
Alternatively, alter the weight of a service by specifying a percentage:
$ oc set route-backends ab-example --adjust ab-example-b=5%
By specifying
+before the percentage declaration, you can adjust a weighting relative to the current setting. For example:$ oc set route-backends ab-example --adjust ab-example-b=+15%
The
--equalflag sets theweightof all services to100:$ oc set route-backends ab-example --equal
The
--zeroflag sets theweightof all services to0. All requests then return with a 503 error.NoteNot all routers support multiple or weighted backends.
6.5.10. Create multiple Deployment objects that use one service
To serve multiple application versions through a single service in Red Hat OpenShift Service on AWS, you can create multiple Deployment objects that share a common label selector.
Expose one service for those pods so you can scale or update each shard independently while users reach them through the same route.
Procedure
Create a new application, adding a label
ab-example=truethat will be common to all shards:$ oc new-app openshift/deployment-example --name=ab-example-a --as-deployment-config=true --labels=ab-example=true --env=SUBTITLE\=shardA
$ oc delete svc/ab-example-a
The application is deployed and a service is created. This is the first shard.
Make the application available via a route, or use the service IP directly:
$ oc expose deployment ab-example-a --name=ab-example --selector=ab-example\=true
$ oc expose service ab-example
-
Browse to the application at
ab-example-<project_name>.<router_domain>to verify you see thev1image. Create a second shard based on the same source image and label as the first shard, but with a different tagged version and unique environment variables:
$ oc new-app openshift/deployment-example:v2 \ --name=ab-example-b --labels=ab-example=true \ SUBTITLE="shard B" COLOR="red" --as-deployment-config=true$ oc delete svc/ab-example-b
At this point, both sets of pods are being served under the route. However, because both browsers (by leaving a connection open) and the router (by default, through a cookie) attempt to preserve your connection to a back-end server, you might not see both shards being returned to you.
To force your browser to one or the other shard:
Use the
oc scalecommand to reduce replicas ofab-example-ato0.$ oc scale dc/ab-example-a --replicas=0
Refresh your browser to show
v2andshard B(in red).Scale
ab-example-ato1replica andab-example-bto0:$ oc scale dc/ab-example-a --replicas=1; oc scale dc/ab-example-b --replicas=0
Refresh your browser to show
v1andshard A(in blue).
If you trigger a deployment on either shard, only the pods in that shard are affected. You can trigger a deployment by changing the
SUBTITLEenvironment variable in eitherDeploymentobject:$ oc edit dc/ab-example-a
or
$ oc edit dc/ab-example-b
6.5.11. Additional resources
Chapter 7. Quotas
7.1. Resource quotas per project
A resource quota, defined by a ResourceQuota object, limits aggregate resource consumption per project. It limits the quantity of objects that you can create in a project by type, and the total amount of compute resources and storage consumed by the resources in that project.
This guide describes how resource quotas work, how cluster administrators can set and manage resource quotas on a per project basis, and how developers and cluster administrators can view them.
7.1.1. Resources managed by quotas
Review the specific compute resources, storage resources, and object counts that you can manage with a project quota.
A pod is in a terminal state if status.phase in (Failed, Succeeded) is true.
Table 7.1. Compute resources managed by quota
| Resource Name | Description |
|---|---|
|
|
The sum of CPU requests across all pods in a non-terminal state cannot exceed this value. |
|
|
The sum of memory requests across all pods in a non-terminal state cannot exceed this value. |
|
|
The sum of CPU requests across all pods in a non-terminal state cannot exceed this value. |
|
|
The sum of memory requests across all pods in a non-terminal state cannot exceed this value. |
|
| The sum of CPU limits across all pods in a non-terminal state cannot exceed this value. |
|
| The sum of memory limits across all pods in a non-terminal state cannot exceed this value. |
Table 7.2. Storage resources managed by quota
| Resource Name | Description |
|---|---|
|
| The sum of storage requests across all persistent volume claims in any state cannot exceed this value. |
|
| The total number of persistent volume claims that can exist in the project. |
|
| The sum of storage requests across all persistent volume claims in any state that have a matching storage class, cannot exceed this value. |
|
| The total number of persistent volume claims with a matching storage class that can exist in the project. |
|
|
The sum of local ephemeral storage requests across all pods in a non-terminal state cannot exceed this value. |
|
|
The sum of ephemeral storage requests across all pods in a non-terminal state cannot exceed this value. |
|
| The sum of ephemeral storage limits across all pods in a non-terminal state cannot exceed this value. |
Table 7.3. Object counts managed by quota
| Resource Name | Description |
|---|---|
|
| The total number of pods in a non-terminal state that can exist in the project. |
|
| The total number of ReplicationControllers that can exist in the project. |
|
| The total number of resource quotas that can exist in the project. |
|
| The total number of services that can exist in the project. |
|
|
The total number of services of type |
|
|
The total number of services of type |
|
| The total number of secrets that can exist in the project. |
|
|
The total number of |
|
| The total number of persistent volume claims that can exist in the project. |
|
| The total number of imagestreams that can exist in the project. |
7.1.2. Quota scopes
Measure resource usage with a quota, and add scopes to restrict the allowed set of target resources to prevent validation errors.
Each quota can have an associated set of scopes. A quota only measures usage for a resource if it matches the intersection of enumerated scopes.
| Scope | Description |
|---|---|
|
|
Match pods that have best effort quality of service for either |
|
|
Match pods that do not have best effort quality of service for |
A BestEffort scope restricts a quota to limiting the following resources:
-
pods
A NotBestEffort scope restricts a quota to tracking the following resources:
-
pods -
memory -
requests.memory -
limits.memory -
cpu -
requests.cpu -
limits.cpu
7.1.3. Quota enforcement
Track project resource usage, such as compute and storage, and automatically deny modifications that exceed defined limits to prevent quota violations.
After a resource quota for a project is first created, the project restricts the ability to create any new resources that may violate a quota constraint until it has calculated updated usage statistics.
After a quota is created and usage statistics are updated, the project accepts the creation of new content. When you create or modify resources, your quota usage is incremented immediately upon the request to create or modify the resource.
When you delete a resource, your quota use is decremented during the next full recalculation of quota statistics for the project. A configurable amount of time determines how long it takes to reduce quota usage statistics to their current observed system value.
If project modifications exceed a quota usage limit, the server denies the action, and an appropriate error message is returned to the user explaining the quota constraint violated, and what their currently observed usage statistics are in the system.
7.1.4. Requests versus limits
To manage cluster capacity, use a project quota to restrict container compute resources. When you configure CPU and memory quotas, incoming containers can explicitly request or limit resources to ensure stable performance.
If the quota has a value specified for requests.cpu or requests.memory, then it requires that every incoming container make an explicit request for those resources. If the quota has a value specified for limits.cpu or limits.memory, then it requires that every incoming container specify an explicit limit for those resources.
7.1.5. Sample resource quota definitions
View sample YAML definitions for resource quotas, including specifications for object counts, compute resources, QoS scopes, and storage classes, to configure custom quota manifests for your project.
core-object-counts.yaml
apiVersion: v1
kind: ResourceQuota
metadata:
  name: core-object-counts
spec:
  hard:
    configmaps: "10"
    persistentvolumeclaims: "4"
    replicationcontrollers: "20"
    secrets: "10"
    services: "10"
services.loadbalancers: "2"where:
spec.hard.configmaps-
The total number of
ConfigMapobjects that can exist in the project. spec.hard.persistentvolumeclaims- The total number of persistent volume claims (PVCs) that can exist in the project.
spec.hard.replicationcontrollers- The total number of replication controllers that can exist in the project.
spec.hard.secrets- The total number of secrets that can exist in the project.
spec.hard.services- The total number of services that can exist in the project.
spec.hard.services.loadbalancers-
The total number of services of type
LoadBalancerthat can exist in the project.
openshift-object-counts.yaml
apiVersion: v1
kind: ResourceQuota
metadata:
  name: openshift-object-counts
spec:
  hard:
openshift.io/imagestreams: "10"where:
spec.hard.openshift.io/imagestreams- The total number of image streams that can exist in the project.
compute-resources.yaml
apiVersion: v1
kind: ResourceQuota
metadata:
  name: compute-resources
spec:
  hard:
    pods: "4"
    requests.cpu: "1"
    requests.memory: 1Gi
    limits.cpu: "2"
limits.memory: 2Giwhere:
spec.hard.pods- The total number of pods in a non-terminal state that can exist in the project.
spec.hard.requests.cpu- Across all pods in a non-terminal state, the sum of CPU requests cannot exceed 1 core.
spec.hard.requests.memory- Across all pods in a non-terminal state, the sum of memory requests cannot exceed 1Gi.
spec.hard.limits.cpu- Across all pods in a non-terminal state, the sum of CPU limits cannot exceed 2 cores.
spec.hard.limits.memory- Across all pods in a non-terminal state, the sum of memory limits cannot exceed 2Gi.
besteffort.yaml
apiVersion: v1
kind: ResourceQuota
metadata:
  name: besteffort
spec:
  hard:
    pods: "1"
  scopes:
- BestEffortwhere:
spec.hard.pods-
The total number of pods in a non-terminal state with
BestEffortquality of service that can exist in the project. spec.scopes-
Restricts the quota to only matching pods that have
BestEffortquality of service for either memory or CPU.
compute-resources-long-running.yaml
apiVersion: v1
kind: ResourceQuota
metadata:
  name: compute-resources-long-running
spec:
  hard:
    pods: "4"
    limits.cpu: "4"
    limits.memory: "2Gi"
  scopes:
- NotTerminatingwhere:
spec.hard.pods- The total number of pods in a non-terminal state.
spec.hard.limits.cpu- Across all pods in a non-terminal state, the sum of CPU limits cannot exceed this value.
spec.hard.limits.memory- Across all pods in a non-terminal state, the sum of memory limits cannot exceed this value.
spec.scopes-
Restricts the quota to only matching pods where
spec.activeDeadlineSecondsis set tonil. Build pods fall underNotTerminatingunless theRestartNeverpolicy is applied.
compute-resources-time-bound.yaml
apiVersion: v1
kind: ResourceQuota
metadata:
  name: compute-resources-time-bound
spec:
  hard:
    pods: "2"
    limits.cpu: "1"
    limits.memory: "1Gi"
  scopes:
- Terminatingwhere:
spec.hard.pods- The total number of pods in a terminating state.
spec.hard.limits.cpu- Across all pods in a terminating state, the sum of CPU limits cannot exceed this value.
spec.hard.limits.memory- Across all pods in a terminating state, the sum of memory limits cannot exceed this value.
spec.scopes-
Restricts the quota to only matching pods where
spec.activeDeadlineSeconds >=0. For example, this quota charges for build or deployer pods, but not long running pods like a web server or database.
storage-consumption.yaml
apiVersion: v1
kind: ResourceQuota
metadata:
  name: storage-consumption
spec:
  hard:
    persistentvolumeclaims: "10"
    requests.storage: "50Gi"
    gold.storageclass.storage.k8s.io/requests.storage: "10Gi"
    silver.storageclass.storage.k8s.io/requests.storage: "20Gi"
    silver.storageclass.storage.k8s.io/persistentvolumeclaims: "5"
    bronze.storageclass.storage.k8s.io/requests.storage: "0"
    bronze.storageclass.storage.k8s.io/persistentvolumeclaims: "0"
    requests.ephemeral-storage: 2Gi
limits.ephemeral-storage: 4Giwhere:
spec.hard.persistentvolumeclaims- The total number of persistent volume claims in a project.
spec.hard.requests.storage- Across all persistent volume claims in a project, the sum of storage requested cannot exceed this value.
spec.hard.gold.storageclass.storage.k8s.io/requests.storage- Across all persistent volume claims in a project, the sum of storage requested in the gold storage class cannot exceed this value.
spec.hard.silver.storageclass.storage.k8s.io/requests.storage- Across all persistent volume claims in a project, the sum of storage requested in the silver storage class cannot exceed this value.
spec.hard.silver.storageclass.storage.k8s.io/persistentvolumeclaims- Across all persistent volume claims in a project, the total number of claims in the silver storage class cannot exceed this value.
spec.hard.bronze.storageclass.storage.k8s.io/requests.storage-
Across all persistent volume claims in a project, the sum of storage requested in the bronze storage class cannot exceed this value. When this is set to
0, it means bronze storage class cannot request storage. spec.hard.bronze.storageclass.storage.k8s.io/persistentvolumeclaims-
Across all persistent volume claims in a project, the sum of storage requested in the bronze storage class cannot exceed this value. When this is set to
0, it means bronze storage class cannot create claims. spec.hard.requests.ephemeral-storage- Across all pods in a non-terminal state, the sum of ephemeral storage requests cannot exceed 2Gi.
spec.hard.limits.ephemeral-storage- Across all pods in a non-terminal state, the sum of ephemeral storage limits cannot exceed 4Gi.
7.1.6. Creating a quota
Create a defined quota in the project to limit resource consumption and object counts, preventing cluster resource exhaustion.
Procedure
- Define the quota in a file.
Use the file to create the quota and apply it to a project:
$ oc create -f <file> [-n <project_name>]
For example:
$ oc create -f core-object-counts.yaml -n demoproject
7.1.6.1. Creating object count quotas
Restrict resource consumption and standard object creation in a project by creating an object count quota for standard namespaced resource types.
You can create an object count quota for all standard namespaced resource types on Red Hat OpenShift Service on AWS, such as BuildConfig and DeploymentConfig objects.
When using a resource quota, an object is charged against the quota upon creation. These types of quotas are useful to protect against exhaustion of resources. The quota can only be created if there are enough spare resources within the project.
Procedure
To configure an object count quota for a resource, run the following command:
$ oc create quota <name> \ --hard=count/<resource>.<group>=<quota>,count/<resource>.<group>=<quota>where:
<resource>- Specifies the name of the resource
<group>-
Specifies the API group, if applicable. Use the
oc api-resourcescommand for a list of resources and their associated API groups.
For example:
$ oc create quota test \ --hard=count/deployments.apps=2,count/replicasets.apps=4,count/pods=3,count/secrets=4The following is an example output:
resourcequota "test" created
This example limits the listed resources to the hard limit in each project in the cluster.
Verify that the quota was created:
$ oc describe quota test
Example output
Name:                         test
Namespace:                    quota
Resource                      Used  Hard
--------                      ----  ----
count/deployments.apps        0     2
count/pods                    0     3
count/replicasets.apps        0     4
count/secrets                 0     4
7.1.6.2. Setting resource quota for extended resources
Configure extended resources, such as GPUs, in a resource quota file and apply it to a project to enforce strict capacity limits and prevent pods from exceeding available capacity.
Overcommitment of resources is not allowed for extended resources, so you must specify requests and limits for the same extended resource in a quota. Currently, only quota items with the prefix requests. is allowed for extended resources. The following is an example scenario of how to set resource quota for the GPU resource nvidia.com/gpu.
Procedure
Determine how many GPUs are available on a node in your cluster. For example:
# oc describe node ip-172-31-27-209.us-west-2.compute.internal | egrep 'Capacity|Allocatable|gpu'
Example output
                    openshift.com/gpu-accelerator=true
Capacity:
 nvidia.com/gpu:  2
Allocatable:
 nvidia.com/gpu:  2
  nvidia.com/gpu  0           0
In this example, 2 GPUs are available.
Create a
ResourceQuotaobject to set a quota in the namespacenvidia. In this example, the quota is1:Example output
apiVersion: v1 kind: ResourceQuota metadata: name: gpu-quota namespace: nvidia spec: hard: requests.nvidia.com/gpu: 1Create the quota:
# oc create -f gpu-quota.yaml
Example output
resourcequota/gpu-quota created
Verify that the namespace has the correct quota set:
# oc describe quota gpu-quota -n nvidia
Example output
Name:                    gpu-quota
Namespace:               nvidia
Resource                 Used  Hard
--------                 ----  ----
requests.nvidia.com/gpu  0     1
Define a pod that asks for a single GPU. The following example definition file is called
gpu-pod.yaml:apiVersion: v1 kind: Pod metadata: generateName: gpu-pod- namespace: nvidia spec: restartPolicy: OnFailure containers: - name: rhel7-gpu-pod image: rhel7 env: - name: NVIDIA_VISIBLE_DEVICES value: all - name: NVIDIA_DRIVER_CAPABILITIES value: "compute,utility" - name: NVIDIA_REQUIRE_CUDA value: "cuda>=5.0" command: ["sleep"] args: ["infinity"] resources: limits: nvidia.com/gpu: 1Create the pod:
# oc create -f gpu-pod.yaml
Verify that the pod is running:
# oc get pods
Example output
NAME              READY     STATUS      RESTARTS   AGE
gpu-pod-s46h7     1/1       Running     0          1m
Verify that the quota
Usedcounter is correct:# oc describe quota gpu-quota -n nvidia
Example output
Name:                    gpu-quota
Namespace:               nvidia
Resource                 Used  Hard
--------                 ----  ----
requests.nvidia.com/gpu  1     1
Attempt to create a second GPU pod in the
nvidianamespace. This is technically available on the node because it has 2 GPUs:# oc create -f gpu-pod.yaml
Example output
Error from server (Forbidden): error when creating "gpu-pod.yaml": pods "gpu-pod-f7z2w" is forbidden: exceeded quota: gpu-quota, requested: requests.nvidia.com/gpu=1, used: requests.nvidia.com/gpu=1, limited: requests.nvidia.com/gpu=1
This Forbidden error message is expected because you have a quota of 1 GPU and this pod tried to allocate a second GPU, which exceeds its quota.
7.1.7. Viewing a quota
View the usage statistics for the hard limits defined in a project quota to monitor resource consumption and plan cluster capacity.
You can view quota usage statistics on the project’s Quota page in the web console or by using the CLI.
Procedure
Get the list of quotas defined in the project. For example, for a project called
demoproject:$ oc get quota -n demoproject
Example output
NAME                           AGE    REQUEST                                                                                                      LIMIT
besteffort                     4s     pods: 1/2
compute-resources-time-bound   10m    pods: 0/2                                                                                                    limits.cpu: 0/1, limits.memory: 0/1Gi
core-object-counts             109s   configmaps: 2/10, persistentvolumeclaims: 1/4, replicationcontrollers: 1/20, secrets: 9/10, services: 2/10
Describe the quota you are interested in, for example the
core-object-countsquota:$ oc describe quota core-object-counts -n demoproject
Example output
Name:			core-object-counts
Namespace:		demoproject
Resource		Used	Hard
--------		----	----
configmaps		3	10
persistentvolumeclaims	0	4
replicationcontrollers	3	20
secrets			9	10
services		2	10
7.1.8. Configuring explicit resource quotas
Configure explicit resource quotas in a project request template to apply specific resource quotas in new projects.
Prerequisites
- Access to the cluster as a user with the cluster-admin role.
-
Install the OpenShift CLI (
oc).
Procedure
Add a resource quota definition to a project request template:
If a project request template does not exist in a cluster:
Create a bootstrap project template and output it to a file called
template.yaml:$ oc adm create-bootstrap-project-template -o yaml > template.yaml
Add a resource quota definition to
template.yaml. The following example defines a resource quota named 'storage-consumption'. The definition must be added before theparameters:section in the template:- apiVersion: v1 kind: ResourceQuota metadata: name: storage-consumption namespace: ${PROJECT_NAME} spec: hard: persistentvolumeclaims: "10" requests.storage: "50Gi" gold.storageclass.storage.k8s.io/requests.storage: "10Gi" silver.storageclass.storage.k8s.io/requests.storage: "20Gi" silver.storageclass.storage.k8s.io/persistentvolumeclaims: "5" bronze.storageclass.storage.k8s.io/requests.storage: "0" bronze.storageclass.storage.k8s.io/persistentvolumeclaims: "0"where:
spec.hard.persistentvolumeclaims- The total number of persistent volume claims in a project.
spec.hard.requests.storage- Across all persistent volume claims in a project, the sum of storage requested cannot exceed this value.
spec.hard.gold.storageclass.storage.k8s.io/requests.storage- Across all persistent volume claims in a project, the sum of storage requested in the gold storage class cannot exceed this value.
spec.hard.silver.storageclass.storage.k8s.io/requests.storage- Across all persistent volume claims in a project, the sum of storage requested in the silver storage class cannot exceed this value.
spec.hard.silver.storageclass.storage.k8s.io/persistentvolumeclaims- Across all persistent volume claims in a project, the total number of claims in the silver storage class cannot exceed this value.
spec.hard.bronze.storageclass.storage.k8s.io/requests.storage-
Across all persistent volume claims in a project, the sum of storage requested in the bronze storage class cannot exceed this value. When this value is set to
0, the bronze storage class cannot request storage. spec.hard.bronze.storageclass.storage.k8s.io/persistentvolumeclaims-
Across all persistent volume claims in a project, the sum of storage requested in the bronze storage class cannot exceed this value. When this value is set to
0, the bronze storage class cannot create claims.
Create a project request template from the modified
template.yamlfile in theopenshift-confignamespace:$ oc create -f template.yaml -n openshift-config
NoteTo include the configuration as a
kubectl.kubernetes.io/last-applied-configurationannotation, add the--save-configoption to theoc createcommand.By default, the template is called
project-request.
If a project request template already exists within a cluster:
NoteIf you declaratively or imperatively manage objects within your cluster by using configuration files, edit the existing project request template through those files instead.
List templates in the
openshift-confignamespace:$ oc get templates -n openshift-config
Edit an existing project request template:
$ oc edit template <project_request_template> -n openshift-config
-
Add a resource quota definition, such as the preceding
storage-consumptionexample, into the existing template. The definition must be added before theparameters:section in the template.
If you created a project request template, reference it in the cluster’s project configuration resource:
Access the project configuration resource for editing:
By using the web console:
- Navigate to the Administration → Cluster Settings page.
- Click Configuration to view all configuration resources.
- Find the entry for Project and click Edit YAML.
By using the CLI:
Edit the
project.config.openshift.io/clusterresource:$ oc edit project.config.openshift.io/cluster
Update the
specsection of the project configuration resource to include theprojectRequestTemplateandnameparameters. The following example references the default project request template nameproject-request:apiVersion: config.openshift.io/v1 kind: Project metadata: # ... spec: projectRequestTemplate: name: project-request
Verify that the resource quota is applied when projects are created:
Create a project:
$ oc new-project <project_name>
List the project’s resource quotas:
$ oc get resourcequotas
Describe the resource quota in detail:
$ oc describe resourcequotas <resource_quota_name>
7.2. Resource quotas across multiple projects
A multi-project quota, defined by a ClusterResourceQuota object, shares quotas across multiple projects. The system aggregates the resources used in each selected project and applies the aggregate limit across all selected projects.
This guide describes how cluster administrators can set and manage resource quotas across multiple projects.
Do not run workloads in or share access to default projects. Default projects are reserved for running core cluster components.
The following default projects are considered highly privileged: default, kube-public, kube-system, openshift, openshift-infra, openshift-node, and other system-created projects that have the openshift.io/run-level label set to 0 or 1. Functionality that relies on admission plugins, such as pod security admission, security context constraints, cluster resource quotas, and image reference resolution, does not work in highly privileged projects.
7.2.1. Selecting multiple projects during quota creation
To aggregate resource usage and enforce consistent limits across multiple namespaces, you can select target projects by using annotation or label selectors when creating a ClusterResourceQuota object.
Procedure
To select projects based on annotations, run the following command:
$ oc create clusterquota for-user \ --project-annotation-selector openshift.io/requester=<user_name> \ --hard pods=10 \ --hard secrets=20This creates the following
ClusterResourceQuotaobject:apiVersion: quota.openshift.io/v1 kind: ClusterResourceQuota metadata: name: for-user spec: quota: hard: pods: "10" secrets: "20" selector: annotations: openshift.io/requester: <user_name> labels: null status: namespaces: - namespace: ns-one status: hard: pods: "10" secrets: "20" used: pods: "1" secrets: "9" total: hard: pods: "10" secrets: "20" used: pods: "1" secrets: "9"where:
spec.quota-
The
ResourceQuotaSpecobject that will be enforced over the selected projects. spec.selector.annotations- A simple key-value selector for annotations.
spec.selector.labels- A label selector that can be used to select projects.
status.namespaces- A per-namespace map that describes current quota usage in each selected project.
status.totalThe aggregate usage across all selected projects.
This multi-project quota document controls all projects requested by
<user_name>using the default project request endpoint. You are limited to 10 pods and 20 secrets.
Similarly, to select projects based on labels, run this command:
$ oc create clusterresourcequota for-name \ --project-label-selector=name=frontend \ --hard=pods=10 --hard=secrets=20where:
clusterresourcequota-
Both
clusterresourcequotaandclusterquotaare aliases of the same command.for-nameis the name of theClusterResourceQuotaobject. --project-label-selector-
To select projects by label, provide a key-value pair by using the format
--project-label-selector=key=value.
This creates the following
ClusterResourceQuotaobject definition:apiVersion: quota.openshift.io/v1 kind: ClusterResourceQuota metadata: creationTimestamp: null name: for-name spec: quota: hard: pods: "10" secrets: "20" selector: annotations: null labels: matchLabels: name: frontend
7.2.2. Viewing applicable cluster resource quotas
View the multi-project quota documents applied to your project by using the AppliedClusterResourceQuota resource. Although, as an administrator, you cannot create or modify multi-project quotas, you can monitor your project’s resource limits.
Procedure
To view quotas applied to a project, run:
$ oc describe AppliedClusterResourceQuota
Example output
Name:   for-user
Namespace:  <none>
Created:  19 hours ago
Labels:   <none>
Annotations:  <none>
Label Selector: <null>
AnnotationSelector: map[openshift.io/requester:<user-name>]
Resource  Used  Hard
--------  ----  ----
pods        1     10
secrets     9     20
7.2.3. Selection granularity
When you create a multi-project quota, restrict the number of active projects to avoid degrading API server responsiveness.
When you configure a multi-project quota using a ClusterResourceQuota object, restrict the number of selected active projects to 100 or fewer. Because quota allocation claims require system locking, selecting more than 100 projects under a single multi-project quota can severely degrade API server responsiveness across those projects.
Chapter 8. Using config maps with applications
By using a config map, you can decouple configuration artifacts from image content to keep containerized applications portable.
The following sections define config maps, explain how to create and use them, and describe use cases for consuming ConfigMap objects in pods.
8.1. Understanding config maps
You can review the following sections to learn how to use config maps to make configuration values available to your pods separately from application code.
Many applications require configuration by using some combination of configuration files, command-line arguments, and environment variables. In Red Hat OpenShift Service on AWS, these configuration artifacts are decoupled from image content to keep containerized applications portable.
The ConfigMap object provides mechanisms to inject containers with configuration data while keeping containers agnostic of Red Hat OpenShift Service on AWS. A config map can be used to store fine-grained information like individual properties or coarse-grained information like entire configuration files or JSON blobs.
The ConfigMap object holds key-value pairs of configuration data that can be consumed in pods or used to store configuration data for system components such as controllers. For example:
ConfigMap Object Definition
kind: ConfigMap
apiVersion: v1
metadata:
  creationTimestamp: 2016-02-18T19:14:38Z
  name: example-config
  namespace: my-namespace
data:
  example.property.1: hello
  example.property.2: world
  example.property.file: |-
    property.1=value-1
    property.2=value-2
    property.3=value-3
binaryData:
bar: L3Jvb3QvMTAwwhere:
data- Specifies the configuration data.
binaryData.bar- Specifies a file that contains non-UTF8 data, for example, a binary Java keystore file. Enter the file data in Base 64.
You can use the binaryData field when you create a config map from a binary file, such as an image.
Configuration data can be consumed in pods in a variety of ways. A config map can be used to:
- Populate environment variable values in containers
- Set command-line arguments in a container
- Populate configuration files in a volume
Users and system components can store configuration data in a config map.
A config map is similar to a secret, but designed to more conveniently support working with strings that do not contain sensitive information.
8.1.1. Config map restrictions
A config map must be created before its contents can be consumed in pods.
Controllers can be written to tolerate missing configuration data. Consult individual components configured by using config maps on a case-by-case basis.
ConfigMap objects reside in a project.
They can only be referenced by pods in the same project.
The Kubelet only supports the use of a config map for pods it gets from the API server.
This includes any pods created by using the CLI, or indirectly from a replication controller. It does not include pods created by using the Red Hat OpenShift Service on AWS node’s --manifest-url flag, its --config flag, or its REST API because these are not common ways to create pods.
Additional resources
8.1.2. Populating environment variables in containers by using config maps
You can use config maps to populate individual environment variables in containers or to populate environment variables in containers from all keys that form valid environment variable names.
The following example ConfigMap custom resource (CR) contains two environment variables:
apiVersion: v1
kind: ConfigMap
metadata:
  name: special-config
  namespace: default
data:
  special.how: very
  special.type: charm
where:
metadata.name- Specifies the name of the config map.
metadata.namespace- Specifies the project in which the config map resides. Config maps can only be referenced by pods in the same project.
data- Specifies the environment variables to inject.
The following example ConfigMap (CR) contains one environment variable:
apiVersion: v1
kind: ConfigMap
metadata:
  name: env-config
  namespace: default
data:
  log_level: INFO
where:
metadata.name- Specifies the name of the config map.
metadata.namespace- Specifies the project in which the config map resides. Config maps can only be referenced by pods in the same project.
data- Specifies the environment variables to inject.
Procedure
You can consume the keys of this
ConfigMapin a pod usingconfigMapKeyRefsections.Sample
Podspecification configured to inject specific environment variablesapiVersion: v1 kind: Pod metadata: name: dapi-test-pod spec: securityContext: runAsNonRoot: true seccompProfile: type: RuntimeDefault containers: - name: test-container image: gcr.io/google_containers/busybox command: [ "/bin/sh", "-c", "env" ] env: - name: SPECIAL_LEVEL_KEY valueFrom: configMapKeyRef: name: special-config key: special.how - name: SPECIAL_TYPE_KEY valueFrom: configMapKeyRef: name: special-config key: special.type optional: true envFrom: - configMapRef: name: env-config securityContext: allowPrivilegeEscalation: false capabilities: drop: [ALL] restartPolicy: Neverwhere:
spec.containers.env- Specifies the environment variables to pull from a config map.
spec.containers.env.name- Specifies the name of a pod environment variable that you are injecting a key’s value into.
spec.containers.env.valueFrom.configMapKeyRef.name- Specifies the name of the config map to pull specific environment variables from.
spec.containers.env.valueFrom.configMapKeyRef.key- Specifies the environment variable to pull from the config map.
spec.containers.env.valueFrom.configMapKeyRef.optional- Specifies that the environment variable is optional. As optional, the pod will be started even if the specified config map and keys do not exist.
spec.containers.envFrom.configMapRef- Specifies the name of the config map to pull all environment variables from.
When this pod is run, the pod logs will include the following output:
SPECIAL_LEVEL_KEY=very
log_level=INFO
NoteSPECIAL_TYPE_KEY=charmis not listed in the example output becauseoptional: trueis set.
8.1.3. Setting command-line arguments for container commands with config maps
You can use config maps to set the value of the commands or arguments in a container by using the Kubernetes substitution syntax $(VAR_NAME).
As an example, consider the following config map:
apiVersion: v1
kind: ConfigMap
metadata:
  name: special-config
  namespace: default
data:
  special.how: very
  special.type: charm
Procedure
To inject values into a command in a container, you must consume the keys you want to use as environment variables. Then you can refer to them in a container’s command using the
$(VAR_NAME)syntax.Sample pod specification configured to inject specific environment variables
apiVersion: v1 kind: Pod metadata: name: dapi-test-pod spec: securityContext: runAsNonRoot: true seccompProfile: type: RuntimeDefault containers: - name: test-container image: gcr.io/google_containers/busybox command: [ "/bin/sh", "-c", "echo $(SPECIAL_LEVEL_KEY) $(SPECIAL_TYPE_KEY)" ] env: - name: SPECIAL_LEVEL_KEY valueFrom: configMapKeyRef: name: special-config key: special.how - name: SPECIAL_TYPE_KEY valueFrom: configMapKeyRef: name: special-config key: special.type securityContext: allowPrivilegeEscalation: false capabilities: drop: [ALL] restartPolicy: Neverwhere:
spec.containers.command- Specifies values to inject into a command in a container by using the keys you want to use as environment variables.
When this pod is run, the output from the echo command run in the test-container container is as follows:
very charm
8.1.4. Injecting content into a volume by using config maps
You can use config maps to inject content into a volume.
The following example ConfigMap custom resource (CR) contains two environment variables:
apiVersion: v1
kind: ConfigMap
metadata:
  name: special-config
  namespace: default
data:
  special.how: very
  special.type: charm
The following procedure describes options for injecting content into a volume by using config maps.
Procedure
The most basic way to inject content into a volume by using a config map is to populate the volume with files where the key is the file name and the content of the file is the value of the key:
apiVersion: v1 kind: Pod metadata: name: dapi-test-pod spec: securityContext: runAsNonRoot: true seccompProfile: type: RuntimeDefault containers: - name: test-container image: gcr.io/google_containers/busybox command: [ "/bin/sh", "-c", "cat", "/etc/config/special.how" ] volumeMounts: - name: config-volume mountPath: /etc/config securityContext: allowPrivilegeEscalation: false capabilities: drop: [ALL] volumes: - name: config-volume configMap: name: special-config restartPolicy: Neverwhere:
spec.volumes.configMap.nameSpecifies a file containing key.
When this pod is run, the output of the cat command will be:
very
You can also control the paths within the volume where config map keys are projected:
apiVersion: v1 kind: Pod metadata: name: dapi-test-pod spec: securityContext: runAsNonRoot: true seccompProfile: type: RuntimeDefault containers: - name: test-container image: gcr.io/google_containers/busybox command: [ "/bin/sh", "-c", "cat", "/etc/config/path/to/special-key" ] volumeMounts: - name: config-volume mountPath: /etc/config securityContext: allowPrivilegeEscalation: false capabilities: drop: [ALL] volumes: - name: config-volume configMap: name: special-config items: - key: special.how path: path/to/special-key restartPolicy: Neverwhere:
spec.volumes.configMap.items.path- Specifies the path to config map key.
When this pod is run, the output of the cat command is
very.
Chapter 9. Monitoring project and application metrics by using the Developer perspective
The Observe view in the Developer perspective enables you to monitor project and application metrics to track performance, troubleshoot issues, and respond to alerts. For example, CPU, memory, and bandwidth usage, and network related information.
9.1. Prerequisites
- You have created and deployed applications on Red Hat OpenShift Service on AWS.
- You have logged in to the web console.
- The Developer perspective is enabled and you have switched to it.
Starting with Red Hat OpenShift Service on AWS 4.19, the perspectives in the web console have unified. The Developer perspective is no longer enabled by default.
All users can interact with all Red Hat OpenShift Service on AWS web console features. However, if you are not the cluster owner, you might need to request permission to access certain features from the cluster owner.
You can still enable the Developer perspective. On the Getting Started pane in the web console, you can take a tour of the console, find information on setting up your cluster, view a quick start for enabling the Developer perspective, and follow links to explore new features and capabilities.
See also, "Enabling the Developer perspective in the web console".
9.2. Enabling the Developer perspective in the web console
Enable the Developer perspective in the web console to give your developers tools to manage applications, visualize topology, and monitor projects as they develop and build them.
Cluster administrators can enable the Developer perspective for developers to use.
You can enable the Developer perspective with the following steps:
Prerequisites
-
You have access to the web console as a user with
cluster-adminprivileges.
Procedure
- Navigate to the Cluster Settings page by clicking → .
- Select the Configuration tab.
-
Type
consolein the search field to locate the Console Operator resource and selectoperator.openshift.io. - On the Cluster Details page, click the Actions menu and select Customize.
- In the General tab, locate the Perspectives section. You can enable or disable the Developer perspective as needed. Changes are automatically applied.
Optional: You can enable the Developer perspective by using the CLI with the following command:
$ oc patch console.operator.openshift.io/cluster --type='merge' -p '{"spec":{"customization":{"perspectives":[{"id":"dev","visibility":{"state":"Enabled"}}]}}}'NoteThe change reflects in the web console after the console pod restarts successfully.
Verification
- Locate the perspective switcher in the web console.
- Verify that Developer is displayed as an available perspective option.
9.3. Monitoring capabilities from the Developer perspective
The Observe view in the Developer perspective shows monitoring tools filtered by your project access permissions to track performance, troubleshoot issues, and respond to alerts. You can monitor CPU, memory, bandwidth, and network metrics.
Starting with Red Hat OpenShift Service on AWS 4.19, the perspectives in the web console have unified. The Developer perspective is no longer enabled by default.
All users can interact with all Red Hat OpenShift Service on AWS web console features. However, if you are not the cluster owner, you might need to request permission to access certain features from the cluster owner.
You can still enable the Developer perspective. On the Getting Started pane in the web console, you can take a tour of the console, find information on setting up your cluster, view a quick start for enabling the Developer perspective, and follow links to explore new features and capabilities.
See also, "Enabling the Developer perspective in the web console".
The Observe view in the Developer perspective uses the same monitoring components as the Administrator perspective, but displays only the projects you have permissions for. You can monitor your applications without seeing cluster-wide metrics you cannot access.
A project represents a Kubernetes namespace with additional annotations. When you select a project in the Developer perspective, you view the topology and metrics for that namespace.
After selecting a project in the Observe view, the following tabs become available:
- Events: Cluster events filtered by the selected project
- Alerting rules: Configured alerting rules and their current state
- Alerts: Firing alerts for the selected project
- Dashboards: Pre-built visual dashboards showing resource consumption graphs including CPU usage, memory usage, bandwidth consumption, and network-related information
- Metrics: Prometheus query interface for analyzing specific metrics
- Silences: Create and manage alert silences to temporarily suppress alert notifications
The monitoring interface is the same as the Administrator perspective, with the key difference being project filtering based on your access permissions.
In the Administrator perspective, the monitoring tabs are immediately available with a project dropdown for filtering. In the Developer perspective, you must select a project before the tabs are displayed. This scoping enables your developers to observe their applications by using the same monitoring tools as cluster administrators, focused only on their assigned projects.
9.4. Viewing project dashboards
View pre-built dashboards showing CPU usage, memory usage, bandwidth consumption, and network information across your project (namespace) topology to help you monitor application performance.
Procedure
- In the Developer perspective navigation menu, select Observe.
- Select a project from the Project list. After you select a project, the monitoring tabs are displayed.
Click the Dashboards tab.
The Dashboards tab displays pre-built Kubernetes compute resources dashboards showing metrics such as CPU usage, memory usage, bandwidth consumption, and network-related information. The dashboard layout includes metric cards at the top showing current utilization percentages, and expandable graph sections below showing detailed resource usage trends over time.
9.5. Monitoring your application metrics
Inspect alerts, metric charts, and health check status for individual application workloads to troubleshoot performance issues and monitor health directly from the topology view.
Procedure
- In the Developer perspective, navigate to the Topology view.
- Click the workload node to open the side panel.
Select the Observe tab to view workload-specific metrics:
- Review active critical and warning alerts associated with the workload.
- View CPU, memory, and bandwidth usage charts.
Click View monitoring dashboard to open the full metrics dashboard for the workload.
NoteOnly critical and warning alerts in the Firing state are displayed in the Topology view. Alerts in the Silenced, Pending and Not Firing states are not displayed.
9.6. Image vulnerability metrics and severity levels
Review container image security scan results on the project dashboard to identify and prioritize vulnerabilities for remediation.
In the Developer perspective, the project dashboard shows the Image Vulnerabilities link in the Status section. Using this link, you can view the Image Vulnerabilities breakdown window, which displays metrics such as the total count of vulnerable container images and fixable container images, organized by severity. The icon color indicates severity:
- Red: High severity. Fix immediately.
- Orange: Medium severity. Can be fixed after high-severity vulnerabilities.
- Yellow: Low severity. Can be fixed after high and medium-severity vulnerabilities.
Based on the severity level, you can prioritize vulnerabilities and fix them in an organized manner.
9.7. Monitoring your application and image vulnerabilities metrics
Analyze application dependency vulnerabilities across your cluster to identify and remediate security issues in container images.
After you create applications in your project and deploy them, use the Developer perspective in the web console to see the metrics for your application dependency vulnerabilities across your cluster. The metrics help you to analyze the following image vulnerabilities in detail:
- Total count of vulnerable images in a selected project
- Severity-based counts of all vulnerable images in a selected project
- Drill down into severity to obtain the details, such as count of vulnerabilities, count of fixable vulnerabilities, and number of affected pods for each vulnerable image
Prerequisites
You have installed the Red Hat Quay Container Security Operator.
NoteThe Red Hat Quay Container Security Operator detects vulnerabilities by scanning the images that are in the Red Hat Quay registry.
Procedure
- In the Developer perspective, click Project to open the project dashboard.
For a detailed vulnerabilities overview, click the Vulnerabilities tab.
- To get more detail about an image, click its name.
- View the default graph with all types of vulnerabilities in the Details tab.
- Optional: Click the toggle button to view a specific type of vulnerability. For example, click App dependency to see vulnerabilities specific to application dependency.
- Optional: You can filter the list of vulnerabilities based on their Severity and Type or sort them by Severity, Package, Type, Source, Current Version, and Fixed in Version.
Click a Vulnerability to get its associated details:
- Base image vulnerabilities display information from a Red Hat Security Advisory (RHSA).
- App dependency vulnerabilities display information from the Snyk security application.
9.8. Additional resources
Chapter 10. Monitoring application health by using health checks
You can monitor application health on your Red Hat OpenShift Service on AWS cluster by configuring readiness, liveness, and startup probes for your application containers. You can also observe probe failure events so you can address issues before they affect users.
In software systems, components can become unhealthy due to transient issues such as temporary connectivity loss, configuration errors, or problems with external dependencies. Red Hat OpenShift Service on AWS applications have a number of options to detect and handle unhealthy containers.
10.1. Health checks
You can configure health checks by understanding the differences between readiness, liveness, and startup probes.
A health check periodically performs diagnostics on a running container using any combination of the readiness, liveness, and startup health checks.
You can include one or more probes in the specification for the pod that contains the container which you want to perform the health checks.
If you want to add or edit health checks in an existing pod, you must edit the pod DeploymentConfig object or use the web console. You cannot use the CLI to add or edit health checks for an existing pod.
- Readiness probe
A readiness probe determines if a container is ready to accept service requests. If the readiness probe fails for a container, the kubelet removes the pod from the list of available service endpoints.
After a failure, the probe continues to examine the pod. If the pod becomes available, the kubelet adds the pod to the list of available service endpoints.
- Liveness health check
A liveness probe determines if a container is still running. If the liveness probe fails due to a condition such as a deadlock, the kubelet kills the container. The pod then responds based on the pod restart policy.
For example, a liveness probe on a pod with a
restartPolicyofAlwaysorOnFailurekills and restarts the container.- Startup probe
A startup probe indicates whether the application within a container is started. All other probes are disabled until the startup succeeds. If the startup probe does not succeed within a specified time period, the kubelet kills the container, and the container is subject to the pod
restartPolicy.Some applications can require additional startup time on their first initialization. You can use a startup probe with a liveness or readiness probe to delay that probe long enough to handle lengthy start-up time using the
failureThresholdandperiodSecondsparameters.For example, you can add a startup probe to a liveness probe. Use a
failureThresholdof 30 failures and aperiodSecondsof 10 seconds. This combination (30 × 10s = 300s) gives a maximum startup window of 5 minutes. After the startup probe succeeds the first time, the liveness probe takes over.
You can configure liveness, readiness, and startup probes with any of the following types of tests:
HTTP
GET: When using an HTTPGETtest, the test determines the healthiness of the container by using a webhook. The test is successful if the HTTP response code is between200and399.You can use an HTTP
GETtest with applications that return HTTP status codes when completely initialized.-
Container Command: When using a container command test, the probe executes a command inside the container. The probe is successful if the test exits with a
0status. - Transmission Control Protocol (TCP) socket: When using a TCP socket test, the probe attempts to open a socket to the container. The container is considered healthy only if the probe can establish a connection. You can use a TCP socket test with applications that do not start listening until initialization is complete.
You can configure several fields to control the behavior of a probe:
-
initialDelaySeconds: The time, in seconds, after the container starts before the probe can be scheduled. The default is 0. -
periodSeconds: The delay, in seconds, between performing probes. The default is10. This value must be greater thantimeoutSeconds. -
timeoutSeconds: The number of seconds of inactivity after which the probe times out and the container is assumed to have failed. The default is1. This value must be lower thanperiodSeconds. -
successThreshold: The number of times that the probe must report success after a failure to reset the container status to successful. The value must be1for a liveness probe. The default is1. failureThreshold: The number of times that the probe is allowed to fail. The default is 3. When the threshold is reached:- for a liveness probe, the container is restarted
-
for a readiness probe, the pod is marked
Unready -
for a startup probe, the container is killed and is subject to the
restartPolicyof the pod
10.1.1. Example probes
The following are samples of different probes as they appear in an object specification.
Sample readiness probe with a container command readiness probe in a pod spec
apiVersion: v1
kind: Pod
metadata:
  labels:
    test: health-check
  name: my-application
# ...
spec:
  containers:
  - name: goproxy-app
    args:
    image: registry.k8s.io/goproxy:0.1
    readinessProbe:
      exec:
        command:
        - cat
        - /tmp/healthy
# ...where:
spec.containers.name- Specifies the container name.
spec.containers.image- Specifies the container image to deploy.
spec.containers.readinessProbe- Specifies a readiness probe.
spec.containers.readinessProbe.exec- Specifies a container command test.
spec.containers.readinessProbe.exec.command- Specifies the commands to execute on the container.
Sample container command startup probe and liveness probe with container command tests in a pod spec
apiVersion: v1
kind: Pod
metadata:
  labels:
    test: health-check
  name: my-application
# ...
spec:
  containers:
  - name: goproxy-app
    args:
    image: registry.k8s.io/goproxy:0.1
    livenessProbe:
      httpGet:
        scheme: HTTPS
        path: /healthz
        port: 8080
        httpHeaders:
        - name: X-Custom-Header
          value: Awesome
    startupProbe:
      httpGet:
        path: /healthz
        port: 8080
      failureThreshold: 30
      periodSeconds: 10
# ...where:
spec.containers.name- Specifies the container name.
spec.containers.image- Specifies the container image to deploy.
spec.containers.livenessProbe- Specifies a liveness probe.
spec.containers.livenessProbe.httpGet-
Specifies an HTTP
GETtest. spec.containers.livenessProbe.httpGet.scheme-
Specifies the internet scheme:
HTTPorHTTPS. The default value isHTTP. spec.containers.livenessProbe.httpGet.port- Specifies the port on which the container is listening.
spec.containers.startupProbe- Specifies a startup probe.
spec.containers.startupProbe.httpGet-
Specifies an HTTP
GETtest. spec.containers.startupProbe.httpGet.port- Specifies the port on which the container is listening.
spec.containers.startupProbe.failureThreshold- Specifies the number of times to try the probe after a failure.
spec.containers.startupProbe.periodSeconds- Specifies the number of seconds to perform the probe.
Sample liveness probe with a container command test that uses a timeout in a pod spec
apiVersion: v1
kind: Pod
metadata:
  labels:
    test: health-check
  name: my-application
# ...
spec:
  containers:
  - name: goproxy-app
    args:
    image: registry.k8s.io/goproxy:0.1
    livenessProbe:
      exec:
        command:
        - /bin/bash
        - '-c'
        - timeout 60 /opt/eap/bin/livenessProbe.sh
      periodSeconds: 10
      successThreshold: 1
      failureThreshold: 3
# ...where:
spec.containers.name- Specifies the container name.
spec.containers.image- Specifies the container image to deploy.
spec.containers.livenessProbe- Specifies the liveness probe.
spec.containers.livenessProbe.exec- Specifies the type of probe, here a container command probe.
spec.containers.livenessProbe.exec.command- Specifies the command line to execute inside the container.
spec.containers.livenessProbe.periodSeconds- Specifies how often in seconds to perform the probe.
spec.containers.livenessProbe.successThreshold- Specifies the number of consecutive successes needed to show success after a failure.
spec.containers.livenessProbe.failureThreshold- Specifies the number of times to try the probe after a failure.
Sample readiness probe and liveness probe with a TCP socket test in a deployment
kind: Deployment
apiVersion: apps/v1
metadata:
  labels:
    test: health-check
  name: my-application
spec:
# ...
  template:
    spec:
      containers:
        - resources: {}
          readinessProbe:
            tcpSocket:
              port: 8080
            timeoutSeconds: 1
            periodSeconds: 10
            successThreshold: 1
            failureThreshold: 3
          terminationMessagePath: /dev/termination-log
          name: ruby-ex
          livenessProbe:
            tcpSocket:
              port: 8080
            initialDelaySeconds: 15
            timeoutSeconds: 1
            periodSeconds: 10
            successThreshold: 1
            failureThreshold: 3
# ...where:
spec.template.spec.containers.readinessProbe- Specifies the readiness probe.
spec.template.spec.containers.livenessProbe- Specifies the liveness probe.
10.2. Configuring health checks using the CLI
To configure readiness, liveness, and startup probes, add one or more probes to the specification for the pod that contains the container on which you want to perform the health checks. Probes let the cluster detect unhealthy containers and respond before failures affect application availability.
If you want to add or edit health checks in an existing pod, you must edit the pod DeploymentConfig object or use the web console. You cannot use the CLI to add or edit health checks for an existing pod.
Procedure
Create a YAML file that defines a
Podobject with one or more probes:apiVersion: v1 kind: Pod metadata: labels: test: health-check name: my-application spec: containers: - name: my-container args: image: registry.k8s.io/goproxy:0.1 livenessProbe: tcpSocket: port: 8080 initialDelaySeconds: 15 periodSeconds: 20 timeoutSeconds: 10 readinessProbe: httpGet: host: my-host scheme: HTTPS path: /healthz port: 8080 startupProbe: exec: command: - cat - /tmp/healthy failureThreshold: 30 periodSeconds: 20 timeoutSeconds: 10NoteInclude only the probe types your application needs. The example shows liveness, readiness, and startup probes together for reference.
where:
spec.containers.name- Specifies the container name.
spec.containers.image- Specifies the container image to deploy.
spec.containers.livenessProbe- Specifies a liveness probe. This value is optional.
spec.containers.livenessProbe.tcpSocket- Specifies a test to perform, here a Transmission Control Protocol (TCP) socket test.
spec.containers.livenessProbe.tcpSocket.port- Specifies the port on which the container is listening.
spec.containers.livenessProbe.initialDelaySeconds- Specifies the time, in seconds, after the container starts before the probe can be scheduled.
spec.containers.livenessProbe.periodSeconds-
Specifies the number of seconds to perform the probe. The default is
10. This value must be greater thantimeoutSeconds. spec.containers.livenessProbe.timeoutSeconds-
Specifies the number of seconds of inactivity after which the probe is assumed to have failed. The default is
1. This value must be lower thanperiodSeconds. spec.containers.readinessProbe- Specifies a readiness probe. This value is optional.
spec.containers.readinessProbe.httpGet- Specifies the type of test to perform, here an HTTP test.
spec.containers.readinessProbe.httpGet.host-
Specifies a host IP address. When
hostis not defined, thePodIPis used. spec.containers.readinessProbe.httpGet.scheme-
Specifies
HTTPorHTTPS. Whenschemeis not defined, theHTTPscheme is used. spec.containers.readinessProbe.httpGet.port- Specifies the port on which the container is listening.
spec.containers.startupProbe- Specifies a startup probe. This value is optional.
spec.containers.startupProbe.exec- Specifies the type of test to perform, here a container execution probe.
spec.containers.startupProbe.exec.command- Specifies the commands to execute on the container.
spec.containers.startupProbe.failureThreshold- Specifies the number of times to try the probe after a failure.
spec.containers.startupProbe.periodSeconds-
Specifies the number of seconds to perform the probe. The default is
10. This value must be greater thantimeoutSeconds. spec.containers.startupProbe.timeoutSecondsSpecifies the number of seconds of inactivity after which the probe is assumed to have failed. The default is
1. This value must be lower thanperiodSeconds.NoteIf the
initialDelaySecondsvalue is lower than theperiodSecondsvalue, the first readiness probe occurs at some point between the two periods due to an issue with timers.The
timeoutSecondsvalue must be lower than theperiodSecondsvalue.
Apply the YAML file by running the following command:
$ oc create -f <file-name>.yaml
Verify the state of the health check pod by running the following command:
$ oc describe pod my-application
Example output
Events:
  Type    Reason     Age   From                                  Message
  ----    ------     ----  ----                                  -------
  Normal  Scheduled  9s    default-scheduler                     Successfully assigned openshift-logging/liveness-exec to ip-10-0-143-40.ec2.internal
  Normal  Pulling    2s    kubelet, ip-10-0-143-40.ec2.internal  pulling image "registry.k8s.io/liveness"
  Normal  Pulled     1s    kubelet, ip-10-0-143-40.ec2.internal  Successfully pulled image "registry.k8s.io/liveness"
  Normal  Created    1s    kubelet, ip-10-0-143-40.ec2.internal  Created container
  Normal  Started    1s    kubelet, ip-10-0-143-40.ec2.internal  Started container
The following example shows output when a liveness probe fails and the container is restarted:
....

Events:
  Type     Reason          Age                From                                               Message
  ----     ------          ----               ----                                               -------
  Normal   Scheduled       <unknown>                                                             Successfully assigned aaa/liveness-http to ci-ln-37hz77b-f76d1-wdpjv-worker-b-snzrj
  Normal   AddedInterface  47s                multus                                             Add eth0 [10.129.2.11/23]
  Normal   Pulled          46s                kubelet, ci-ln-37hz77b-f76d1-wdpjv-worker-b-snzrj  Successfully pulled image "registry.k8s.io/liveness" in 773.406244ms
  Normal   Pulled          28s                kubelet, ci-ln-37hz77b-f76d1-wdpjv-worker-b-snzrj  Successfully pulled image "registry.k8s.io/liveness" in 233.328564ms
  Normal   Created         10s (x3 over 46s)  kubelet, ci-ln-37hz77b-f76d1-wdpjv-worker-b-snzrj  Created container liveness
  Normal   Started         10s (x3 over 46s)  kubelet, ci-ln-37hz77b-f76d1-wdpjv-worker-b-snzrj  Started container liveness
  Warning  Unhealthy       10s (x6 over 34s)  kubelet, ci-ln-37hz77b-f76d1-wdpjv-worker-b-snzrj  Liveness probe failed: HTTP probe failed with statuscode: 500
  Normal   Killing         10s (x2 over 28s)  kubelet, ci-ln-37hz77b-f76d1-wdpjv-worker-b-snzrj  Container liveness failed liveness probe, will be restarted
  Normal   Pulling         10s (x3 over 47s)  kubelet, ci-ln-37hz77b-f76d1-wdpjv-worker-b-snzrj  Pulling image "registry.k8s.io/liveness"
  Normal   Pulled          10s                kubelet, ci-ln-37hz77b-f76d1-wdpjv-worker-b-snzrj  Successfully pulled image "registry.k8s.io/liveness" in 244.116568ms
10.3. Application health monitoring by using the Developer perspective
You can monitor application health by adding readiness, liveness, and startup probes from the Developer perspective, either when you deploy an application or on a deployed application. Probes detect unhealthy containers and keep applications available before failures affect users.
You can use the Developer perspective to add three types of health probes to your container to ensure that your application is healthy:
- Use a readiness probe to check if the container is ready to handle requests.
- Use a liveness probe to check if the container is running.
- Use a startup probe to check if the application within the container has started.
You can add health checks either while creating and deploying an application, or after you have deployed an application.
10.4. Adding health checks using the Developer perspective
You can use the Topology view to add health checks to your deployed application.
Prerequisites
- You have switched to the Developer perspective in the web console.
- You have created and deployed an application on Red Hat OpenShift Service on AWS using the Developer perspective.
Procedure
- In the Topology view, click the application node to see the side panel. If the container does not have health checks added, a Health Checks notification is displayed with a link to add health checks.
In the displayed notification, click Add Health Checks by using one of the following methods:
- Click the Add Health Checks link in the notification.
Click the Actions list and select Add Health Checks.
If the container already has health checks, you see the Edit Health Checks option instead of the add option.
- In the Add Health Checks form, if you have deployed multiple containers, use the Container list to ensure that the appropriate container is selected.
Click the required health probe links to add them to the container. Default data for the health checks is pre-populated. You can add the probes with the default data or further customize the values and then add them. For example, to add a Readiness probe that checks if your container is ready to handle requests:
- Click Add Readiness Probe, to see a form containing the parameters for the probe.
- Click the Type list to select the request type you want to add. For example, select Container Command to specify the command that runs inside the container.
-
In the Command field, add an argument
cat. Similarly, you can add multiple arguments for the check. For example, add another argument/tmp/healthy. Retain or modify the default values for the other parameters as required.
NoteThe
Timeoutvalue must be lower than thePeriodvalue. TheTimeoutdefault value is1. ThePerioddefault value is10.- Click the checkmark at the bottom of the form. The Readiness Probe Added message is displayed.
- Click Add to add the health check. You are redirected to the Topology view and the container is restarted.
- In the side panel, verify that the probes have been added by clicking on the deployed pod under the Pods section.
- In the Pod Details page, click the listed container in the Containers section.
-
In the Container Details page, verify that the Readiness probe - Exec Command
cat/tmp/healthyhas been added to the container.
10.5. Editing health checks using the Developer perspective
You can edit, remove, or add readiness, liveness, and startup probes on a deployed application from the Topology view in the Developer perspective. Use the Edit Health Checks page to update probe parameters, remove probes, or add new probe types.
Prerequisites
- You have switched to the Developer perspective in the web console.
- You have created and deployed an application on Red Hat OpenShift Service on AWS using the Developer perspective.
- You have added health checks to your application.
Procedure
- In the Topology view, right-click your application and select Edit Health Checks. Alternatively, in the side panel, click the Actions drop-down list and select Edit Health Checks.
- To remove a previously added health probe, click the Remove icon adjoining it.
To edit the parameters of an existing probe:
- Click the Edit Probe link next to a previously added probe to see the parameters for the probe.
- Modify the parameters as required, and click the check mark to save your changes.
To add a new health probe, click the add probe links. For example, to add a liveness probe that checks if your container is running:
- Click Add Liveness Probe to see a form containing the parameters for the probe.
Edit the probe parameters as required.
NoteThe
Timeoutvalue must be lower than thePeriodvalue. TheTimeoutdefault value is1. ThePerioddefault value is10.- Click the check mark at the bottom of the form. The Liveness Probe Added message is displayed.
- Click Save to save your modifications and add the additional probes to your container. You are redirected to the Topology view.
Verification
- In the side panel, verify that the probes have been added by clicking on the deployed pod under the Pods section.
- In the Pod Details page, click the listed container in the Containers section.
-
In the Container Details page, verify that the Liveness probe -
HTTP Get 10.129.4.65:8080/has been added to the container, in addition to the earlier existing probes.
10.6. Monitoring health check failures using the Developer perspective
You can monitor health check failures for a deployed application from the Topology view in the Developer perspective. Use the Observe tab to view events that report probe failures and show when containers need attention before users are affected.
Prerequisites
- You have switched to the Developer perspective in the web console.
- You have created and deployed an application on Red Hat OpenShift Service on AWS using the Developer perspective.
- You have added health checks to your application.
Procedure
- In the Topology view, click the application node to see the side panel.
- Click the Observe tab to see health check failure events in the Events (Warning) section.
- Click the down arrow adjoining Events (Warning) to see the details of the health check failure.
Additional resources
Chapter 11. Editing applications
You can edit the configuration and the source code of the application you create using the Topology view.
11.1. Prerequisites
- You have created and deployed an application on Red Hat OpenShift Service on AWS using the Developer perspective.
- You have logged in to the web console and have switched to the Developer perspective.
11.2. Editing the source code of an application using the Developer perspective
You can use the Topology view in the Developer perspective to edit the source code of your application.
Procedure
In the Topology view, click the Edit Source code icon, displayed at the bottom-right of the deployed application, to access your source code and modify it.
NoteThis feature is available only when you create applications using the From Git, From Catalog, and the From Dockerfile options.
If the Eclipse Che Operator is installed in your cluster, a Che workspace (
 ) is created and you are directed to the workspace to edit your source code. If it is not installed, you will be directed to the Git repository (
 ) your source code is hosted in.
11.3. Editing the application configuration using the Developer perspective
You can use the Topology view in the Developer perspective to edit the configuration of your application.
Currently, only configurations of applications created by using the From Git, Container Image, From Catalog, or From Dockerfile options in the Add workflow of the Developer perspective can be edited. Configurations of applications created by using the CLI or the YAML option from the Add workflow cannot be edited.
Prerequisites
Ensure that you have created an application using the From Git, Container Image, From Catalog, or From Dockerfile options in the Add workflow.
Procedure
After you have created an application and it is displayed in the Topology view, right-click the application to see the edit options available.
Figure 11.1. Edit application
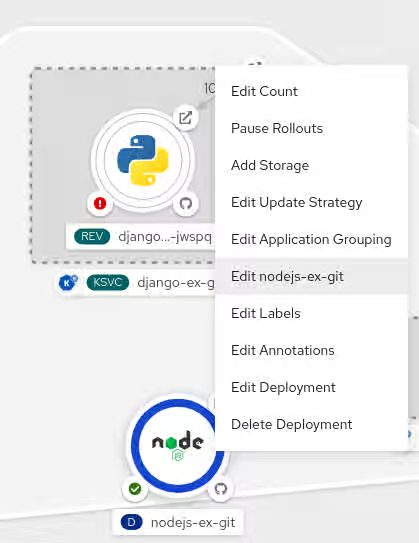
- Click Edit application-name to see the Add workflow you used to create the application. The form is pre-populated with the values you had added while creating the application.
Edit the necessary values for the application.
NoteYou cannot edit the Name field in the General section, the CI/CD pipelines, or the Create a route to the application field in the Advanced Options section.
Click Save to restart the build and deploy a new image.
Figure 11.2. Edit and redeploy application
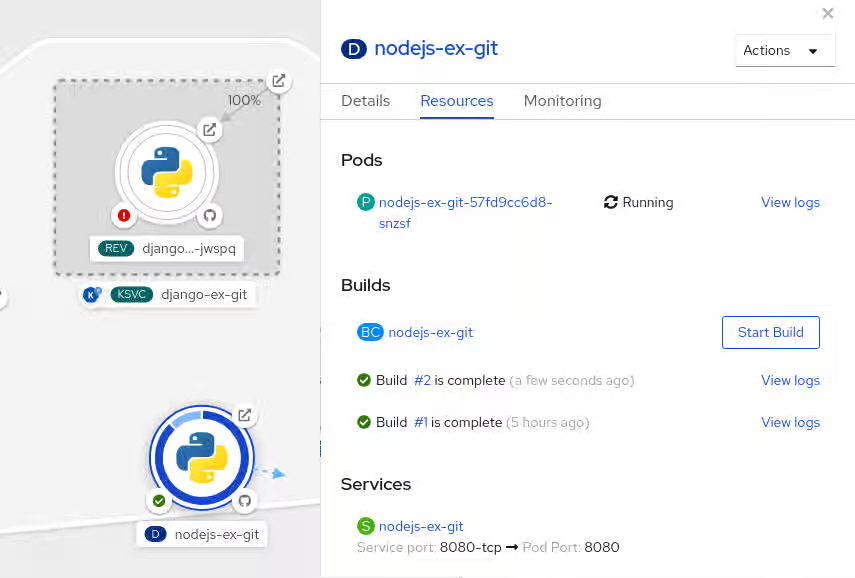
Chapter 12. Working with quotas
A resource quota, defined by a ResourceQuota object, limits aggregate resource consumption per project. You can limit the quantity of objects that you can create in a project by type, and the total amount of compute resources and storage consumed by resources in that project.
An object quota count places a defined quota on all standard namespaced resource types. When using a resource quota, an object is charged against the quota if it exists in server storage. These types of quotas are useful to protect against exhaustion of storage resources.
This guide describes how resource quotas work and how developers can work with and view them.
12.1. Viewing a quota
View the usage statistics for the hard limits defined in a project quota to monitor resource consumption and plan cluster capacity.
You can view quota usage statistics on the project’s Quota page in the web console or by using the CLI.
Procedure
Get the list of quotas defined in the project. For example, for a project called
demoproject:$ oc get quota -n demoproject
Example output
NAME                           AGE    REQUEST                                                                                                      LIMIT
besteffort                     4s     pods: 1/2
compute-resources-time-bound   10m    pods: 0/2                                                                                                    limits.cpu: 0/1, limits.memory: 0/1Gi
core-object-counts             109s   configmaps: 2/10, persistentvolumeclaims: 1/4, replicationcontrollers: 1/20, secrets: 9/10, services: 2/10
Describe the quota you are interested in, for example the
core-object-countsquota:$ oc describe quota core-object-counts -n demoproject
Example output
Name:			core-object-counts
Namespace:		demoproject
Resource		Used	Hard
--------		----	----
configmaps		3	10
persistentvolumeclaims	0	4
replicationcontrollers	3	20
secrets			9	10
services		2	10
12.2. Resources managed by quotas
Review the specific compute resources, storage resources, and object counts that you can manage with a project quota.
A pod is in a terminal state if status.phase in (Failed, Succeeded) is true.
Table 12.1. Compute resources managed by quota
| Resource Name | Description |
|---|---|
|
|
The sum of CPU requests across all pods in a non-terminal state cannot exceed this value. |
|
|
The sum of memory requests across all pods in a non-terminal state cannot exceed this value. |
|
|
The sum of CPU requests across all pods in a non-terminal state cannot exceed this value. |
|
|
The sum of memory requests across all pods in a non-terminal state cannot exceed this value. |
|
| The sum of CPU limits across all pods in a non-terminal state cannot exceed this value. |
|
| The sum of memory limits across all pods in a non-terminal state cannot exceed this value. |
Table 12.2. Storage resources managed by quota
| Resource Name | Description |
|---|---|
|
| The sum of storage requests across all persistent volume claims in any state cannot exceed this value. |
|
| The total number of persistent volume claims that can exist in the project. |
|
| The sum of storage requests across all persistent volume claims in any state that have a matching storage class, cannot exceed this value. |
|
| The total number of persistent volume claims with a matching storage class that can exist in the project. |
|
|
The sum of local ephemeral storage requests across all pods in a non-terminal state cannot exceed this value. |
|
|
The sum of ephemeral storage requests across all pods in a non-terminal state cannot exceed this value. |
|
| The sum of ephemeral storage limits across all pods in a non-terminal state cannot exceed this value. |
Table 12.3. Object counts managed by quota
| Resource Name | Description |
|---|---|
|
| The total number of pods in a non-terminal state that can exist in the project. |
|
| The total number of ReplicationControllers that can exist in the project. |
|
| The total number of resource quotas that can exist in the project. |
|
| The total number of services that can exist in the project. |
|
|
The total number of services of type |
|
|
The total number of services of type |
|
| The total number of secrets that can exist in the project. |
|
|
The total number of |
|
| The total number of persistent volume claims that can exist in the project. |
|
| The total number of imagestreams that can exist in the project. |
12.3. Quota scopes
Measure resource usage with a quota, and add scopes to restrict the allowed set of target resources to prevent validation errors.
Each quota can have an associated set of scopes. A quota only measures usage for a resource if it matches the intersection of enumerated scopes.
| Scope | Description |
|---|---|
|
|
Match pods that have best effort quality of service for either |
|
|
Match pods that do not have best effort quality of service for |
A BestEffort scope restricts a quota to limiting the following resources:
-
pods
A NotBestEffort scope restricts a quota to tracking the following resources:
-
pods -
memory -
requests.memory -
limits.memory -
cpu -
requests.cpu -
limits.cpu
12.4. Quota enforcement
Track project resource usage, such as compute and storage, and automatically deny modifications that exceed defined limits to prevent quota violations.
After a resource quota for a project is first created, the project restricts the ability to create any new resources that may violate a quota constraint until it has calculated updated usage statistics.
After a quota is created and usage statistics are updated, the project accepts the creation of new content. When you create or modify resources, your quota usage is incremented immediately upon the request to create or modify the resource.
When you delete a resource, your quota use is decremented during the next full recalculation of quota statistics for the project. A configurable amount of time determines how long it takes to reduce quota usage statistics to their current observed system value.
If project modifications exceed a quota usage limit, the server denies the action, and an appropriate error message is returned to the user explaining the quota constraint violated, and what their currently observed usage statistics are in the system.
12.5. Requests versus limits
To manage cluster capacity, use a project quota to restrict container compute resources. When you configure CPU and memory quotas, incoming containers can explicitly request or limit resources to ensure stable performance.
If the quota has a value specified for requests.cpu or requests.memory, then it requires that every incoming container make an explicit request for those resources. If the quota has a value specified for limits.cpu or limits.memory, then it requires that every incoming container specify an explicit limit for those resources.
Chapter 13. Pruning objects to reclaim resources
Reclaim cluster storage and optimize API server performance by pruning stale resources. You can run manual CLI commands or configure automated cron jobs to clean up obsolete deployment, build, image, and group records.
Over time, API objects created in Red Hat OpenShift Service on AWS can accumulate in the cluster’s etcd data store through normal user operations, such as when building and deploying applications.
A user with the dedicated-admin role can periodically prune older versions of objects from the cluster that are no longer required. For example, by pruning images you can delete older images and layers that are no longer in use, but are still taking up disk space.
13.1. Basic pruning operations
Remove obsolete or unreferenced cluster objects to reclaim cluster storage and maintain optimal API server performance.
The CLI groups prune operations under a common parent command:
$ oc adm prune <object_type> <options>
This specifies:
-
The
<object_type>to perform the action on, such asgroups,builds,deployments, orimages. -
The
<options>supported to prune that object type.
13.2. Pruning groups
Remove stale user group records from external identity providers by using the group pruner. Pruning orphaned groups keeps user management data accurate, ensures cluster security, and prevents unauthorized access permissions.
To prune groups records from an external provider, administrators can run the following command:
$ oc adm prune groups \
--sync-config=path/to/sync/config [<options>]Table 13.1. oc adm prune groups flags
| Options | Description |
|---|---|
|
| Indicate that pruning should occur, instead of performing a dry-run. |
|
| Path to the group blacklist file. |
|
| Path to the group whitelist file. |
|
| Path to the synchronization configuration file. |
Procedure
To see the groups that the prune command deletes, run the following command:
$ oc adm prune groups --sync-config=ldap-sync-config.yaml
To perform the prune operation, add the
--confirmflag:$ oc adm prune groups --sync-config=ldap-sync-config.yaml --confirm
13.3. Pruning deployment resources
Delete completed or failed deployment configurations and pod records to free up cluster storage, reduce database clutter, and speed up resource lookups.
You can prune resources associated with deployments that are no longer required by the system, due to age and status.
The following command prunes replication controllers associated with DeploymentConfig objects:
$ oc adm prune deployments [<options>]
To also prune replica sets associated with Deployment objects, use the --replica-sets flag. This flag is currently a Technology Preview feature.
Table 13.2. oc adm prune deployments flags
| Option | Description |
|---|---|
|
| Indicate that pruning should occur, instead of performing a dry-run. |
|
|
Per the |
|
|
Per the |
|
|
Do not prune any replication controller that is younger than |
|
|
Prune all replication controllers that no longer have a |
|
|
If Important This flag is a Technology Preview feature. |
Procedure
To see what a pruning operation would delete, run the following command:
$ oc adm prune deployments --orphans --keep-complete=5 --keep-failed=1 \ --keep-younger-than=60mTo actually perform the prune operation, add the
--confirmflag:$ oc adm prune deployments --orphans --keep-complete=5 --keep-failed=1 \ --keep-younger-than=60m --confirm
13.4. Pruning builds
Prune obsolete build records and logs from your cluster to reclaim cluster storage and prevent API performance degradation.
To prune builds that are no longer required by the system due to age and status, administrators can run the following command:
$ oc adm prune builds [<options>]
Table 13.3. oc adm prune builds flags
| Option | Description |
|---|---|
|
| Indicate that pruning should occur, instead of performing a dry-run. |
|
| Prune all builds whose build configuration no longer exists, status is complete, failed, error, or canceled. |
|
|
Per build configuration, keep the last |
|
|
Per build configuration, keep the last |
|
|
Do not prune any object that is younger than |
Procedure
To see what a pruning operation would delete, run the following command:
$ oc adm prune builds --orphans --keep-complete=5 --keep-failed=1 \ --keep-younger-than=60mTo actually perform the prune operation, add the
--confirmflag:$ oc adm prune builds --orphans --keep-complete=5 --keep-failed=1 \ --keep-younger-than=60m --confirmNoteDevelopers can enable automatic build pruning by modifying their build configuration.
13.5. Automatically pruning images
To reclaim storage in the OpenShift image registry in Red Hat OpenShift Service on AWS and define image retention period, you can configure the automatic image pruner.
You set the schedule, suspension, and retention options on the pruning custom resource (CR).
Prerequisites
-
You have access to an Red Hat OpenShift Service on AWS cluster using an account with
dedicated-adminpermissions. -
Install the
ocCLI.
The behavior of the Image Registry Operator for managing the pruner is independent to the managementState specified on the ClusterOperator object of the Image Registry Operator. If the Image Registry Operator is not in the Managed state, the image pruner can still be configured and managed by the Pruning Custom Resource.
However, the managementState of the Image Registry Operator alters the behavior of the deployed image pruner job:
-
Managed: the--prune-registryflag for the image pruner is set totrue. -
Removed: the--prune-registryflag for the image pruner is set tofalse, meaning it only prunes image metadata in etcd.
Procedure
Verify that the object named
imagepruners.imageregistry.operator.openshift.io/clustercontains the followingspecandstatusfields:spec: schedule: 0 0 * * * suspend: false keepTagRevisions: 3 keepYoungerThanDuration: 60m keepYoungerThan: 3600000000000 resources: {} affinity: {} nodeSelector: {} tolerations: [] successfulJobsHistoryLimit: 3 failedJobsHistoryLimit: 3 status: observedGeneration: 2 conditions: - type: Available status: "True" lastTransitionTime: 2019-10-09T03:13:45 reason: Ready message: "Periodic image pruner has been created." - type: Scheduled status: "True" lastTransitionTime: 2019-10-09T03:13:45 reason: Scheduled message: "Image pruner job has been scheduled." - type: Failed staus: "False" lastTransitionTime: 2019-10-09T03:13:45 reason: Succeeded message: "Most recent image pruning job succeeded."where:
spec.schedule-
CronJobformatted schedule. This is an optional field, default is daily at midnight. spec.suspend-
If set to
true, theCronJobrunning pruning is suspended. This is an optional field, default isfalse. The initial value on new clusters isfalse. spec.keepTagRevisions-
The number of revisions per tag to keep. This is an optional field, default is
3. The initial value is3. spec.keepYoungerThanDuration-
Retain images younger than this duration. This is an optional field. If a value is not specified, either
keepYoungerThanor the default value60m(60 minutes) is used. spec.keepYoungerThan-
Deprecated. The same as
keepYoungerThanDuration, but the duration is specified as an integer in nanoseconds. This is an optional field. WhenkeepYoungerThanDurationis set, this field is ignored. spec.resources- Standard pod resource requests and limits. This is an optional field.
spec.affinity- Standard pod affinity. This is an optional field.
nodeSelector- Standard pod node selector. This is an optional field.
spec.tolerations- Standard pod tolerations. This is an optional field.
spec.successfulJobsHistoryLimit-
The maximum number of successful jobs to retain. Must be greater than or equal to
1to ensure metrics are reported. This is an optional field, default is3. The initial value is3. spec.failedJobsHistoryLimit-
The maximum number of failed jobs to retain. Must be greater than or equal
1to ensure metrics are reported. This is an optional field, default is3. The initial value is3. status.observedGeneration- The generation observed by the Operator.
status.conditionsThe standard condition objects with the following types:
-
Available: Indicates if the pruning job has been created. Reasons can beReadyorError. -
Scheduled: Indicates if the next pruning job has been scheduled. Reasons can beScheduled,Suspended, orError. -
Failed: Indicates if the most recent pruning job failed.
-
13.6. Pruning cron jobs
Clean up completed and failed Kubernetes jobs manually to prevent resource exhaustion. You can restrict cron job access to authorized users and configure resource quotas to control job and pod creation.
Cron jobs can perform pruning of successful jobs, but might not properly handle failed jobs. Therefore, the cluster administrator should perform regular cleanup of jobs manually. They should also restrict the access to cron jobs to a small group of trusted users and set appropriate quota to prevent the cron job from creating too many jobs and pods.
Additional resources
Chapter 14. Reducing resource consumption with application idling
As an administrator, you can reduce cluster resource consumption and lower public cloud costs by temporarily scaling inactive application resources to zero replicas.
If any scalable resources are not in use, Red Hat OpenShift Service on AWS discovers and idles them by scaling their replicas to 0. The next time network traffic is directed to the resources, the resources are unidled by scaling up the replicas, and normal operation continues.
Applications are made of services, as well as other scalable resources, such as deployment configs. The action of idling an application involves idling all associated resources.
14.1. Application idling
Identify the scalable resources for one or more services, such as deployment configurations and replication controllers, and scale them down to zero replicas to optimize cluster capacity.
You can use the oc idle command to idle a single service, or use the --resource-names-file option to idle multiple services.
14.1.1. Idling a single service
Scale down the scalable resources of a specific service to zero replicas to reduce cluster consumption.
Procedure
To idle a single service, run:
$ oc idle <service>
14.1.2. Idling multiple services
Scale multiple inactive services down to zero replicas to optimize cluster capacity.
Idling multiple services is helpful if an application spans across a set of services within a project, or when idling multiple services in conjunction with a script to idle multiple applications in bulk within the same project.
Procedure
- Create a file containing a list of the services, each on their own line.
Idle the services using the
--resource-names-fileoption:$ oc idle --resource-names-file <filename>
NoteThe
idlecommand is limited to a single project. For idling applications across a cluster, run theidlecommand for each project individually.
14.2. Unidling applications
Restore normal application operations by scaling up the replicas when network traffic is directed back to the idled resources.
Application services become active again when they receive network traffic and are scaled back up to their previous state. This includes both traffic to the services and traffic passing through routes. Applications can also be manually unidled by scaling up the resources.
Procedure
To scale up a DeploymentConfig, run:
$ oc scale --replicas=1 dc <dc_name>
NoteAutomatic unidling by a router is currently only supported by the default HAProxy router.
Chapter 15. Deleting applications
You can delete applications created in your project.
15.1. Deleting applications using the Developer perspective
You can delete an application and all of its associated components using the Topology view in the Developer perspective:
- Click the application you want to delete to see the side panel with the resource details of the application.
- Click the Actions drop-down menu displayed on the upper right of the panel, and select Delete Application to see a confirmation dialog box.
- Enter the name of the application and click Delete to delete it.
You can also right-click the application you want to delete and click Delete Application to delete it.