How to use iptraf to monitor network interface?
Environment
- Red Hat Enterprise Linux
- Network traffic
Issue
How to use iptraf to monitor network interface?
Resolution
Install and run the iptraf utility as the root user:
- Red Hat Enterprise Linux 8:
yum install iptraf-ng -yand run theiptraf-ngcommand - Red Hat Enterprise Linux 7:
yum install iptraf-ng -yand run theiptraf-ngcommand - Red Hat Enterprise Linux 6:
yum install iptraf -yand run theiptrafcommand - Red Hat Enterprise Linux 5:
yum install iptraf -yand run theiptrafcommand - Red Hat Enterprise Linux 4:
up2date iptrafand run theiptrafcommand
Usage
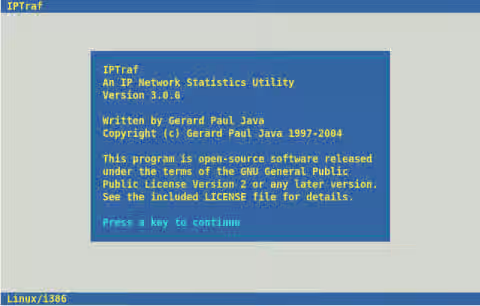
When iptraf is run, a text-based interface will appear as below:
Press a key to continue. The main menu appears:
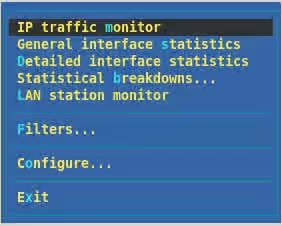
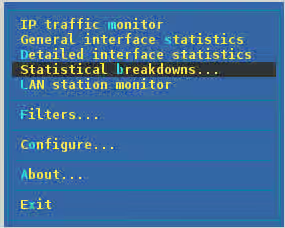
Choose the IP traffic monitor option. A new menu with a list of all network interfaces will be shown:
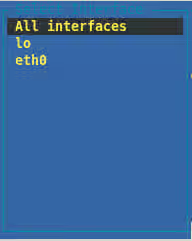
Select the interface you wish to monitor. Basic statistics about the interface will be shown such as Packets Captured, TCP Flow Rate, and so on.
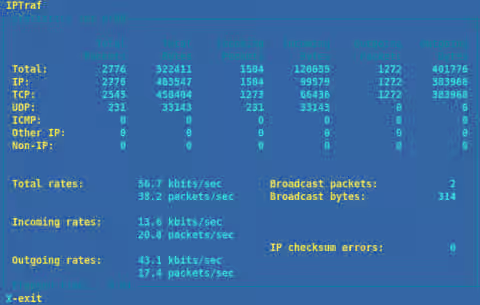
Detailed interface statistics provides information about the network interface:
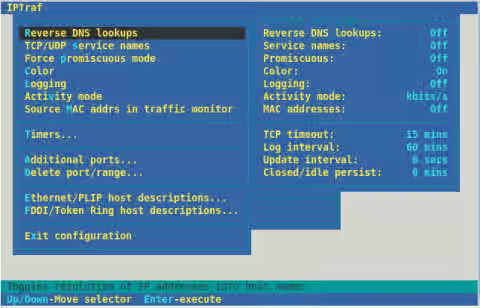
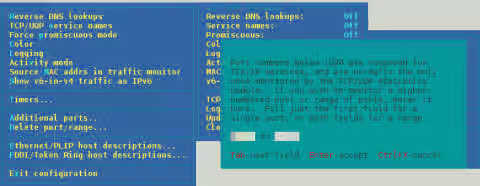
iptraf can be configured with the Configure... option:
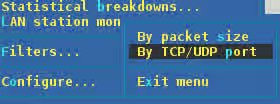
If you wish to monitor a specific port, or set of ports, this can be done from the Statistical Breakdowns option:
Select to *Filter... by packet size or by TCP/UDP port:
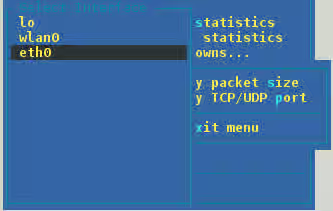
Select the interface to monitor on:
A filtered display shows statistics as follows:

The TCP/UDP port range can be changed from the Configure... section, inside Additional ports...:
Root Cause
IPTraf is a console-based network statistics utility for Linux. It gathers a variety of figures such as TCP connection packet and byte counts, interface statistics and activity indicators, TCP/UDP traffic breakdowns, and LAN station packet and byte counts.
Features
- An IP traffic monitor that shows information on the IP traffic passing over your network. Includes TCP flag information, packet and byte counts, ICMP details, OSPF packet types.
- General and detailed interface statistics showing IP, TCP, UDP, ICMP, non-IP and other IP packet counts, IP checksum errors, interface activity, packet size counts.
- A TCP and UDP service monitor showing counts of incoming and outgoing packets for common TCP and UDP application ports
- A LAN statistics module that discovers active hosts and shows statistics showing the data activity on them
- TCP, UDP, and other protocol display filters, allowing you to view only traffic you're interested in.
- Logging
- Supports Ethernet, FDDI, ISDN, SLIP, PPP, and loopback interface types.
- Utilizes the built-in raw socket interface of the Linux kernel, allowing it to be used over a wide range of supported network cards.
- Full-screen, menu-driven operation.
Support many protocols such as: IP, UDP, ICMP, IGMP, IGP, IGRP, OSPF, ARP, RARP.
Non-IP packets will simply be indicated as "Non-IP" and on Ethernet LANs will be supplied with the appropriate Ethernet addresses.
More information available on the external upstream website at: <Content from iptraf.seul.org is not included.http://iptraf.seul.org/>
This solution is part of Red Hat’s fast-track publication program, providing a huge library of solutions that Red Hat engineers have created while supporting our customers. To give you the knowledge you need the instant it becomes available, these articles may be presented in a raw and unedited form.