How do I identify high CPU utilization by Java threads on Linux/Solaris
Environment
- Java application or application server (e.g., Red Hat JBoss EAP, Tomcat, etc.) on Linux/Solaris
Issue
- Java application using a large percentage of CPU
- Java application server (JBoss EAP, Tomcat) high CPU utilization
- CPU resource data is needed to diagnose high CPU usage
- Need to identify a java thread utilizing large CPU resources
- There is an elevated CPU consume in the processors of our virtual server where we could not evidence using TOP command
Resolution
This article covers identifying CPU usage by Java applications on Linux or Solaris. As such, it covers just one part of diagnosing situations where there is unexplained high CPU utilization. High CPU usage is more generally addressed in Java application high CPU.
It is also possible to do the same on Openshift. See also the article How to identify high CPU utilization by Java threads on OCP 4.
1. Collect thread-level CPU usage and thread dumps
The first step is capturing Java thread dumps along with thread-level CPU usage information. Java thread dump can be captured by using kill -3 <JAVA_PID> (sending SIGQUIT signal to java process) that will output a java thread dump to the standard output of the Java process, or by using the jstack command which will capture java thread dump to the standard output of the jstack command. And the thread-level CPU usage information can be captured by top command with -H option like top -b -n 1 -H -p <JAVA_PID>.
When the CPU spike happens, you can run the script appropriate for the architecture contained in the attached archive (This content is not included.high_cpu_linux.tar.gz or This content is not included.high_cpu_solaris.tar.gz) passing in the Java process ID as an argument.
The archive contains both scripts with the SIGQUIT version and the jstack version to capture Java thread dumps.
Archive Summary
high_cpu_linux.tar.gz
 |-- high_cpu_linux.sh           # Using SIGQUIT to generate thread dumps
 |-- high_cpu_linux_jstack.sh    # using jstack and SIGQUIT to generate thread dumps

high_cpu_solaris.tar.gz
 |-- high_cpu_solaris.sh         #  Using SIGQUIT to generate thread dumps:
 |-- high_cpu_solaris_jstack.sh  #  Using jstack and SIGQUIT to generate thread dumps:
The scripts will capture a series of 6 thread dumps along with CPU by light weight thread, spaced 20 seconds apart (the time interval can be adjusted if necessary). The CPU information will be captured in a file called high-cpu.out in the directory where the script is run, and thread dumps will be sent to stdout. If using the jstack version of the script, thread dumps will also be captured in high-cpu-tdump.out.
If a non-jstack version is being used and the Java application is started with a service script that logs console output, the thread dumps will be in the console log. Otherwise, redirect stdout to a file on startup. See How do I generate a Java thread dump on Linux/Unix? for a discussion on redirecting stdout to a file.
Or aside from the script and having to manually determine the process id, a simple way to capture these data points for any running java processes is a line line command like the following:
$ for y in {1..20}; do echo $y >&2; for pid in $(ps -C java --noheader -o pid); do jstack -l $pid >> jstack-$pid.out; top -b -n 1 -H -p $pid >> high-cpu-$pid.out; done; top -b -n 1 -H >> high-cpu.out; sleep 10; done
Be sure to test the script or command before the issue happens to ensure it runs properly in the target environment. This is especially important when using the jstack version of the script as jstack may or may not work depending on what version of the JDK is being used or what version of the jstack tool is being used. Note that the jstack version should only be used with JDK 6+ as jstack from JDK 5 will not produce the same desired thread dump data.
Note:
- Usage instructions are included in each .sh script
- If running JBoss EAP or one of the other JBoss enterprise products as a service, and are unable to find the generated thread dump see Unable to generate thread dump using jstack or kill -3 command
- Make sure to execute the
jstackcommand from the same user as the java process when usinghigh_cpu_linux_jstack.shandhigh_cpu_solaris_jstack.sh. Please see this article for more details. - Example while targeting a specific $USER and $JAVA_PID:
su -p -s /bin/sh $USER -c "./high_cpu_linux_jstack.sh $JAVA_PID"
2. Identify thread consuming high CPU usage
From the high-cpu.out file, it's possible to identify process ID's for java threads utilizing a large percentage of the CPU.
For example, output such as the attached example This content is not included.top command output "high-cpu-linux.out" shows CPU being used by three Java threads:
  PID USER      PR  NI  VIRT  RES  SHR S %CPU %MEM    TIME+  COMMAND
 4382 root      25   0 1284m 480m  80m R 39.5 23.7  13:00.64 java
 6657 root      25   0 1284m 480m  80m R 39.5 23.7   7:23.10 java
16322 root      25   0 1284m 480m  80m R 19.8 23.7  57:51.77 java
And the same PID (4382) are consistently using significant CPU across the six snapshots in the attached example.
Then, let's follow-up on thread with PID 4382 from Java thread dump.
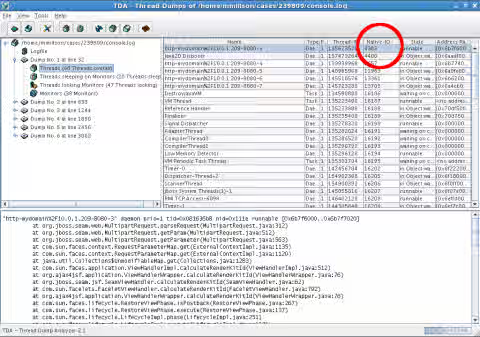
Using the Content from github.com is not included.Thread Dump Analyzer (TDA) tool, one can load the thread dumps that were gathered with the high CPU data. Click on the Native-ID column in the upper right pane to sort by native thread ID and cross reference the light weight thread IDs from the top output to see the threads consuming high CPU. The screen shot below shows the stack track for thread ID 4382, identifying the code being executed by the thread:
Since JDK 21, the process ID of the thread is captured as the same decimal format value as Native ID nid=... in Java thread dump. (This has been implemented since JDK18+ by the enhancement Content from bugs.openjdk.org is not included.JDK-8268425).
"default task-1" #215 [3177477] prio=5 os_prio=0 cpu=12.16ms elapsed=7.92s tid=0x000055f3d01034e0 nid=3177477 waiting on condition  [0x00007fbbf55fc000]
                                                                                                  ^^^^^^^^^^^
Until JDK 17, the process ID of the thread is captured as hexadecimal format value as Native ID nid=0x... in Java thread dump. For example:
"default task-123" #265 prio=5 os_prio=0 tid=0x0000563d65418000 nid=0x111e runnable [0x00007f0fb38ff000]
                                                                ^^^^^^^^^^
You can convert between hexadecimal value and decimal value by the printf command:
# convert from hexadecimal_value (0x....) to decimal value:
$ printf "%d" <hexadecimal_value>

# convert from decimal value to hexadecimal_value (0x....):
$ printf "%x" <decimal_value>

# if you want to prepend "0x" to the output result:
$ printf "0x%x" <decimal_value>
For example:
$ printf "%d" 0x111e
4382
$ printf "%x" 4382
111e
$ printf "0x%x" 4382
0x111e
3. Shell script to run
The shell script to run is high_cpu_linux_jstack.sh
This script is taking 6 snapshots each 20s (total duration 2mn).
Output files:
- high-cpu.out
- high-cpu-tdump.out
Command line
Usage: sh ./high_cpu_linux_jstack.sh <JBOSS_PID>
#!/bin/sh
#
# Takes the JBoss PID as an argument.
#
# Captures cpu by light weight thread and thread dumps a specified number of
# times and INTERVAL. Thread dumps are retrieved using jstack and are placed in
# high-cpu-tdump.out
#
# Usage: sh ./high_cpu_linux_jstack.sh <JBOSS_PID>
#
# Change Log:
# * 2011-05-02 19:00 <loleary>
# - Added date output to high-cpu.out for log correlation
# - Added -p argument to top to limit high-cpu.out to <JBOSS_PID>
#
#

# Number of times to collect data.
LOOP=6
# Interval in seconds between data points.
INTERVAL=20

for ((i=1; i <= $LOOP; i++))
do
   _now=$(date)
   echo "${_now}" >>high-cpu.out
   top -b -n 1 -H -p $1 >>high-cpu.out
   echo "${_now}" >>high-cpu-tdump.out
   jstack -l $1 >>high-cpu-tdump.out
   echo "thread dump #" $i
   if [ $i -lt $LOOP ]; then
      echo "Sleeping..."
      sleep $INTERVAL
   fi
done
Diagnostic Steps
Analyze the output of high_cpu_linux_jstack.sh in the Access Labs app JVMPeg.
This solution is part of Red Hat’s fast-track publication program, providing a huge library of solutions that Red Hat engineers have created while supporting our customers. To give you the knowledge you need the instant it becomes available, these articles may be presented in a raw and unedited form.