How do I identify high CPU utilization by Java threads on Windows
Environment
- Java application or application server (e.g., JBoss EAP, Tomcat, etc.)
- Microsoft Windows
Issue
- Java application using a large percentage of CPU
- Java application server (JBoss EAP, Tomcat) high CPU utilization
- CPU resource data is needed to diagnosis high CPU usage
- Need to identify a java thread utilizing large CPU resources
Resolution
Disclaimer: Links contained herein to external website(s) are provided for convenience only. Red Hat has not reviewed the links and is not responsible for the content or its availability. The inclusion of any link to an external website does not imply endorsement by Red Hat of the website or their entities, products or services. You agree that Red Hat is not responsible or liable for any loss or expenses that may result due to your use of (or reliance on) the external site or content.
This article covers looking into CPU usage by Java applications on Windows. As such, it covers just one part of diagnosing situations where there is unexplained high CPU utilization. High CPU usage is more generally addressed in Java application high CPU.
There are two sets of information to gather. First, one gathers CPU utilization information on processes and threads using the either the GUI Windows Content from technet.microsoft.com is not included.Process Explorer tool or the command line "wmic" tool. Next, thread dumps are required. Thread dump information is used with along with the CPU utilization information to identify specify Java code that may be consuming high CPU.
Collect CPU data using WMIC
From a command prompt run the following, replacing %PID% with the process ID
wmic path Win32_PerfFormattedData_PerfProc_Thread get IDProcess,IDThread,PercentProcessorTime,PercentUserTime,PercentPrivilegedTime | findstr "%PID% "
The output is formatted into columns being the PID, TID, the total CPU and the CPU split into user and kernel time.
It is also possible to get finer grained values by using
wmic path Win32_PerfRawData_PerfProc_Thread get IDProcess,IDThread,PercentProcessorTime,PercentUserTime,PercentPrivilegedTime
The values are not percentages despite the name, so need to be divided by the total of the "PercentProcessorTime" column.
Collect CPU data with PowerShell (Updated January 2025)
Microsoft announced WMI command line (WMIC) utility deprecation and it's disabled by default on Windows 11 as explained in Content from techcommunity.microsoft.com is not included.WMI command line (WMIC) utility deprecation: Next steps. We can get cpu usage time per thread with PowerShell instead of WMIC:
// obtain cpu time usage every 10 seconds
PS C:\> while($true) { Get-CimInstance -ClassName Win32_PerfFormattedData_PerfProc_Thread | Where-Object { $_.IDProcess -eq <java-pid> } | Select-Object @{Name="Timestamp"; Expression={Get-Date -Format "yyyy-MM-dd HH:mm:ss"}}, IDProcess, IDThread, PercentUserTime, PercentPrivilegedTime,PercentProcessorTime, ThreadState, ThreadWaitReason | ConvertTo-CSV; sleep 10; }
#TYPE Selected.Microsoft.Management.Infrastructure.CimInstance
"Timestamp","IDProcess","IDThread","PercentUserTime","PercentPrivilegedTime","PercentProcessorTime","ThreadState","ThreadWaitReason"
"2025-01-20 00:59:05","3784","6620","0","0","0","5","6"
"2025-01-20 00:59:05","3784","7428","0","0","0","5","15"
...
#TYPE Selected.Microsoft.Management.Infrastructure.CimInstance
"Timestamp","IDProcess","IDThread","PercentUserTime","PercentPrivilegedTime","PercentProcessorTime","ThreadState","ThreadWaitReason"
"2025-01-20 00:59:16","3784","6620","0","0","0","5","6"
"2025-01-20 00:59:16","3784","7428","0","0","0","5","15"
...
Collect CPU Data using Process Explorer
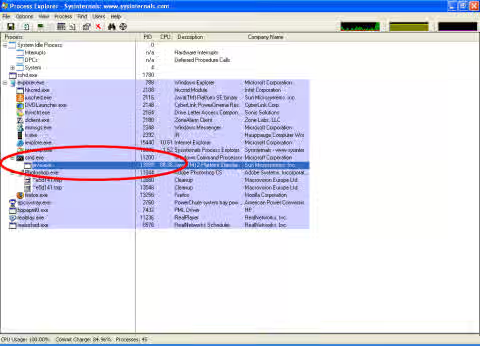
When the issue happens, start Windows Process Explorer and verify the Java process is consuming CPU (and not some other process). For example, in the screen shot below, the Java process is using 86.36% CPU:
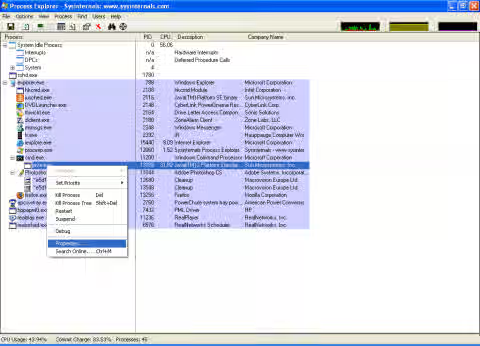
Right click on the Java process row and select Properties from the context menu per the screen shot below:
This will bring up a Properties dialog box with the Threads tab information displayed per the next screen shot:
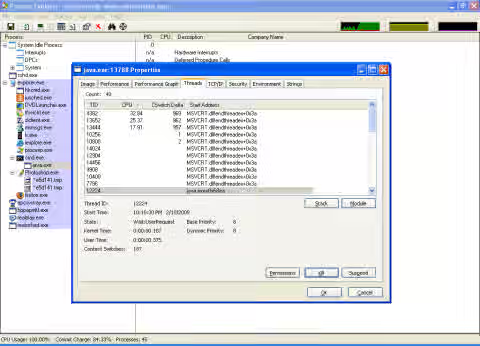
The first column shows the light weight thread ID. The second column shows CPU. It should already be sorted by CPU, but if not, click the second column so the sort arrow is pointed down and high CPU light weight Java threads are listed first. If the CPU label is not visible, expand the column width so it is visible.
When high CPU utilization occurs, take a series of 6 thread dumps spaced approximately 20 seconds apart per How do I generate a Java thread dump on Windows?. Note the time each thread dump is taken.
At the same time the thread dumps are being taken, observe the Windows Process Explorer "Properties" dialog box "Threads" tab to see what light weight threads are consuming CPU. Take a screen shot of the Thread information at as close to the same time the thread dump is generated as possible. For example, in the screen shot above, light weight thread 4382 is consuming 32.84%, 13652 is consuming 25.37%, and 13444 is consuming 17.91% CPU.
Name the Process Explorer screen shots so they can be related to a specific thread dump.
Identify Threads Consuming High CPU
From the information above, you can identify process ID's for Java threads utilizing a large percentage of the CPU. For example, according to the previous screen shot, thread 4382 is using the majority of the CPU (at the time of the snapshot.)
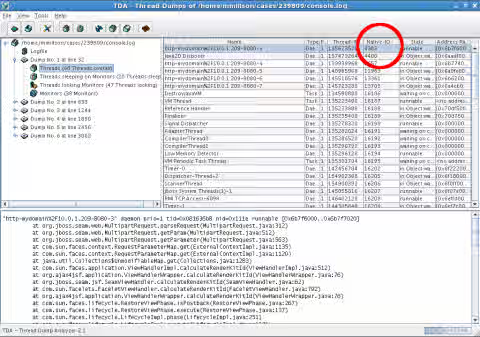
Using the Content from java.net is not included.Thread Dump Analyzer (TDA) tool, one can load the thread dumps that were gathered with the high CPU data. Click on the Native-ID column in the upper right pane to sort by native thread ID and cross reference the light weight thread IDs from the top output to see the threads consuming high CPU. The screen shot below shows the stack track for thread ID 4382, identifying the code being executed by the thread:
This solution is part of Red Hat’s fast-track publication program, providing a huge library of solutions that Red Hat engineers have created while supporting our customers. To give you the knowledge you need the instant it becomes available, these articles may be presented in a raw and unedited form.