CPU Throttling even when the container does not reach its CPU Limit
Environment
- Red Hat OpenShift Container Platform (RHOCP)
- 3
- 4
- Red Hat Enterprise Linux (RHEL)
- 7
- 8
- 9
- Red Hat Enterprise Linux Core OS (RHCOS)
- 4
Issue
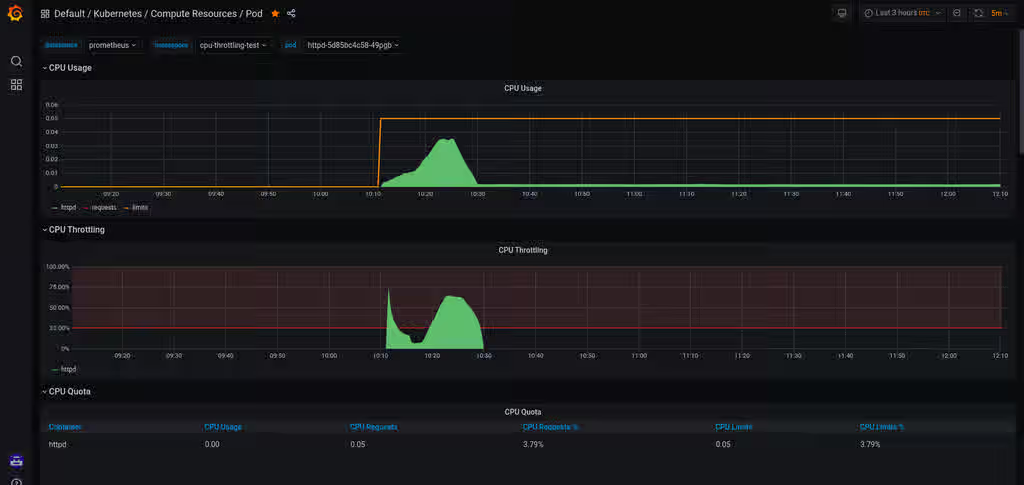
- Pods running with CPU limits CPU throttling despite the CPU limit is not hit.
- The default Grafana dashboard shows CPU throttling even though CPU usage does not touch its limit.
- We could see CPU throttling even though we are running an updated kernel as mentioned in the Red Hat Knowledge Base 5285071
Resolution
- This behaviour can be expected when running multi-threaded applications within pods. If the application is not demonstrating any notable performance issues, then the CPU Throttling metrics may be safely ignored.
- If the Grafana dashboard notes heavy CPU throttling, and the application demonstrates notable performance issues, you may attempt to decrease the number of threads within the application and/or increase the CPU Limit to see if the limits are sized appropriately for the contained application stack.
A bug existed in the past and it was fixed to the kernel level. For knowing more about the bug and kernel versions that contain the fix, read CFS quotas can lead to unnecessary throttling in OpenShift Container Platform .
Root Cause
- Threads within an application contained in a pod may hit their CPU limits while others do not cause an increase to the count of CPU Throttling instances.
- Understanding the CPU Throttling chart requires elaboration into what causes the metrics to change.
- The Linux kernel maintains CPU usage via discretized chunks of time called periods. The default length of time is 100,000 microseconds (0.1 seconds) for each period, so a process running for 1 second will incur 10 periods (0.1 sec/period x 1 sec = 10 periods).
- The kernel sets limits for CPU usage by limiting the amount of time one or more processes can execute within these periods. The limits are called quotas. The default quota is unbound (so no limits). Setting a 50% CPU usage limit will mean the quota for the limited process and all its threads is 50% of the quota. For the example above, that limit is 50,000 microseconds (0.05 seconds). The
- The period and quotas are found in the cgroup area of the sysfs on the host in
/sys/fs/cgroup/cpu,cpuacct/withincpu.cfs_period_usandcpu.cfs_quota_uswithin the pod's cgroup. For example,/sys/fs/cgroup/cpu,cpuacct/kubepods.slice/kubepods-burstable.slice/kubepods-burstable-<UUID>.slice/. - When a quota limit is set, the quota is divided by the number of threads within the application's thread group. For example, if a thread group has 100 threads, then each thread will only be allotted 1/100th of the resource limit set for its quota. If even a single thread within that thread group reaches its quota for that period, the Graphana graph will show some amount of throttling.
- In combining the above examples, one of these threads would be limited to 500 microseconds (0.0005 seconds). Surpassing this limit for any of the 100 threads would increment the count of CPU Throttling for the entire pod.
- Note The CPU usage and throttling metrics begin as soon as the pod is created. As such, even when expecting heavy throttling (for example during load testing), the period and throttling counts within the cgroup may not match constantly, as pods execute additional work before launching the workload deployed into the pod. Monitoring the rate of increase to period and quota metrics here is more useful to get an idea of how much throttling is occurring.
- Prior to the BUG fix from Kernel, the actual amount of CPU usage the threaded task was a fraction of what it should have gotten based on the quota. The Kernel BUG fix allowed the usage of Quota completely. This can be compared to the
cpuacct.usagefile from the cgroup. - Note It should also be highlighted that when a thread reaches its quota for that period, it will be scheduled off the CPU and will not be given any additional CPU time until the next period. This inherently will cause latency to occur. Setting CPU limits for a latency-sensitive application will need to be thoroughly tested if CPU limits are needed.
Diagnostic Steps
- Start a pod that spawns multiple threads and make sure to have some load on it.
- The Grafana dashboard will show high throttling, despite the CPU usage is below the limit.
SBR
Product(s)
Components
Category
This solution is part of Red Hat’s fast-track publication program, providing a huge library of solutions that Red Hat engineers have created while supporting our customers. To give you the knowledge you need the instant it becomes available, these articles may be presented in a raw and unedited form.