Troubleshooting Red Hat OpenShift Container Platform 4: Node NotReady
The NotReady status in a node can be caused by different issues, but the main reason is usually that the kubelet.service in the node is not running or unable to connect to the API Server.
Index
- Check for CPU soft lockups
- Check Kubelet status
- Node under Load
- Verify CSR in Pending status
- Look for NotReady events in the Kubelet log
- Check PLEG is not healthy
- Node unable to contact the API server due to network issue
- Check certificate rotation process
- Check MCO is not in degraded state
- Node hang/Kernel Crashes/OOM issues
- CRI-O container runtime issues
- Check resources usage
Check for CPU soft lockups
Connect to the node(s) and check for soft lockup messages in the journal or dmesg as explained in virtual machine reports a "BUG: soft lockup" (or multiple at the same time):
$ ssh -i <path to sshkey> core@<node IP>
[...]
$ sudo journalctl --no-pager | grep -c "soft lockup"
[...]
$ sudo journalctl --no-pager | grep "soft lockup"
Check Kubelet status
Connect into the node with SSH as core user using the sshkey configured at installation phase:
$ ssh -i <path to sshkey> core@<node IP>
Verify if kubelet.serviceis active and running:
$ sudo systemctl is-active kubelet.service
active
If an OCP node is not ready after cluster upgrade or node restart then perform this procedure
Node under Load
Check if the node has enough resources using below command and probable reason in the events:
$ oc describe node <node-name>
---
Allocated resources:
Total limits may be over 100 percent, i.e., overcommitted.)
Resource                    Requests     Limits
--------                    --------     ------
cpu                         380m (25%)   270m (18%)
memory                      880Mi (11%)  250Mi (3%)
attachable-volumes-aws-ebs  0            0
Events:
Type     Reason                   Age                From                      Message
----     ------                   ----               ----                      -------
Normal   NodeHasSufficientPID     6d (x5 over 6d)    kubelet, m01.example.com  Node m01.example.com status is now: NodeHasSufficientPID
Normal   NodeAllocatableEnforced  6d                 kubelet, m01.example.com  Updated Node Allocatable limit across pods
Normal   NodeHasSufficientMemory  6d (x6 over 6d)    kubelet, m01.example.com  Node m01.example.com status is now: NodeHasSufficientMemory
Normal   NodeHasNoDiskPressure    6d (x6 over 6d)    kubelet, m01.example.com  Node m01.example.com status is now: NodeHasNoDiskPressure
Normal   NodeHasSufficientDisk    6d (x6 over 6d)    kubelet, m01.example.com  Node m01.example.com status is now: NodeHasSufficientDisk
Normal   NodeHasSufficientPID     6d                 kubelet, m01.example.com  Node m01.example.com status is now: NodeHasSufficientPID
Normal   Starting                 6d                 kubelet, m01.example.com  Starting kubelet.
Verify CSR in Pending status
$ oc get csr
NAME        AGE     SIGNERNAME                                    REQUESTOR                                                                   CONDITION
csr-244x8   13h     kubernetes.io/kube-apiserver-client-kubelet   system:serviceaccount:openshift-machine-config-operator:node-bootstrapper   Pending
csr-24kfd   20h     kubernetes.io/kube-apiserver-client-kubelet   system:serviceaccount:openshift-machine-config-operator:node-bootstrapper   Pending
csr-256z7   18h     kubernetes.io/kube-apiserver-client-kubelet   system:serviceaccount:openshift-machine-config-operator:node-bootstrapper   Pending
If CSR in Pending status are present, approve them with the following command
$ oc get csr -o go-template='{{range .items}}{{if not .status}}{{.metadata.name}}{{"\n"}}{{end}}{{end}}' | xargs oc adm certificate approve
Check certificate rotation process
Search for certificate rotation errors in Kubelet log:
$ journalctl -u kubelet.service --no-pager |grep "csr.go"
$ journalctl -u kubelet.service --no-pager |grep "certificate_manager.go"
Look for NotReady events in the Kubelet log
Look for the NodeNotReady or KubeletNotReady events in the journal logs of the kubelet:
$ journalctl -u kubelet.service --no-pager |grep -i  KubeletNotReady
Feb 19 17:13:52.877852 ip-10-0-138-243 hyperkube[1486]: I0219 17:13:52.877752    1486 setters.go:555] Node became not ready: {Type:Ready Status:False LastHeartbeatTime:2021-02-19 17:13:52.87773318 +0000 UTC m=+116886.246819463 LastTransitionTime:2021-02-19 17:13:52.87773318 +0000 UTC m=+116886.246819463 Reason:KubeletNotReady Message:container runtime is down}
Check "PLEG is not healthy"
Verify if PLEG is not healthymessages are present in the Kubelet log:
$ journalctl -u kubelet.service --no-pager | grep "PLEG is not healthy"
Feb 18 08:45:52.293400 ip-10-0-138-243 hyperkube[1486]: E0218 08:45:52.293288    1486 kubelet.go:1772] skipping pod synchronization - [container runtime status check may not have completed yet, PLEG is not healthy: pleg has yet to be successful]
If present, this article can help to understand it Understanding: PLEG is not healthy.
Node unable to contact the API server due to network issue
Check the kubelet journal for errors related to node status updates. In the example below the kubelet is not able to do a DNS lookup of the IP adress of the internal API load balancer.
$ journalctl --no-pager | grep "Error updating node status"
Jul 18 11:57:31 mynodename kubenswrapper[2782]: E0718 11:57:31.540565    2782 kubelet_node_status.go:487] "Error updating node status, will retry" err="error getting node \"mynodename\": Get \"https://api-int.cluster-name:6443/api/v1/nodes/mynodename.cluster-name?timeout=10s\": dial tcp: lookup api-int.cluster-name on x.x.x.x:53: dial udp x.x.x.x:53: connect: network is unreachable"
Check MCO is not in degraded state
Check the machine-config operator clusteroperator resource for any errors which would indicate a problem with specific nodes or machineconfigpools. Refer Link
$ oc describe clusteroperator machine-config
Checking status of nodes
$ for node in $(oc get nodes -o name | awk -F'/' '{ print $2 }');do echo "-------------------- $node ------------------"; oc describe node $node | grep machineconfiguration.openshift.io/state; done
Understand known causes for MachineConfig Operator in degraded state.
Node hang/Kernel Crashes/OOM issues
OpenShift Container Platform runs on RHCOS, which is based on RHEL. Refer to OpenShift 4 node with cgroup out of memory and oom-kill errors for troubleshooting OOM issues. For additional troubleshooting and investigate Kernel issues refer to troubleshooting operating system issues.
CRI-O container runtime issues
Verify if CRI-O panics below stack straces are seen in the logs:
$ journalctl -u kubelet.service --no-pager
Mar 14 15:23:27 worker-1 systemd[1]: crio-conmon-5e4a5efe282d3f77fe472d8810fa9a8a61 df545a6087a7e8ecaa9379b7f1fa5c.scope: Consumed 55ms CPU time
Mar 14 15:23:27 worker-1 crio[1636]: panic: close of closed channel
Mar 14 15:23:27 worker-1 crio[1636]: goroutine 5778599 [running]:
Mar 14 15:23:27 worker-1 crio[1636]: panic(0x55c2b280a280, 0x55c2b2aa4f90)
Mar 14 15:23:27 worker-1 crio[1636]:         /usr/lib/golang/src/runtime/panic.go:1065 +0x565 fp=0xc001827530 sp=0xc001827468 pc=0x55c2b098e8a5
Mar 14 15:23:27 worker-1 crio[1636]: runtime.closechan(0xc00187e300)
Mar 14 15:23:27 worker-1 crio[1636]:         /usr/lib/golang/src/runtime/chan.go:363 +0x3f5 fp=0xc001827570 sp=0xc001827530 pc=0x55c2b095cbb5
Refer crio panics with panic: close of closed channel
Troubleshooting CRI-O container runtime issues
Check resources usage
If the SystemMemoryExceedsReservation alert is observed, refer to SystemMemoryExceedsReservation alert received in OpenShift 4.
Verify node performance if any lack of memory or CPU, or I/O bandwith is occurring. Connect to the OpenShift Container Platform web console as cluster-admin and go to Monitoring->Dashboards and select the "Kubernetes / Compute Resources / Node (Pods)" dashboard to search for any spike in the resource consumption:
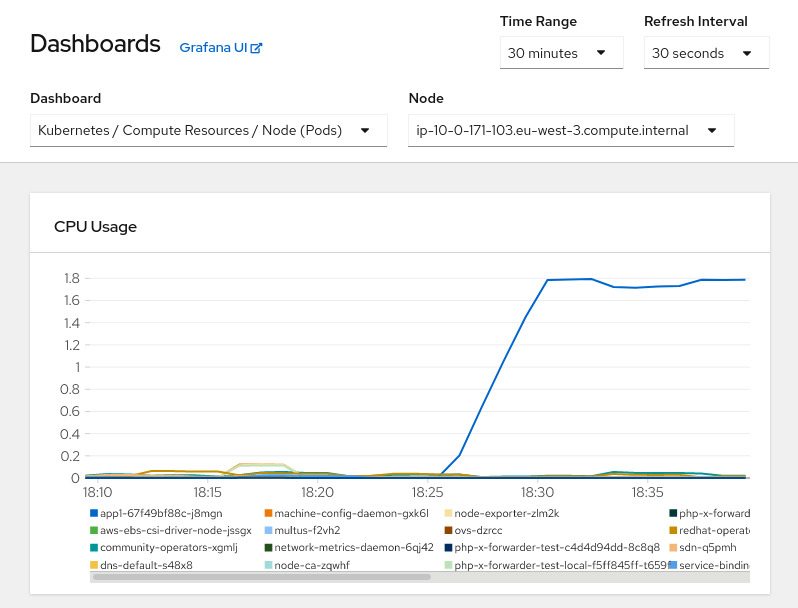
From this view is possible to determinate if there is any pod consuming too many resources, a good habit is to configure resources requests and limits. Refer to This content is not included.how to specify limits and requests for cpu and memory in OpenShift for additional information.