Observability
See how Observability provides insight about the health and utilization of clusters, and workloads across your fleet.
Abstract
Chapter 1. Observability service
Observability can help you identify and assess performance problems without additional tests and support. The Red Hat Advanced Cluster Management for Kubernetes observability component is a service you can use to understand the health and utilization of clusters, and workloads across your fleet. By using the observability service, you are able to automate and manage the components that are within observability.
Observability service uses existing and widely-adopted observability tools from the open source community. By default, multicluster observability operator is enabled during the installation of Red Hat Advanced Cluster Management. Thanos is deployed within the hub cluster for long-term metrics storage. The observability-endpoint-operator is automatically deployed to each imported or created managed cluster. This controller starts a metrics collector that collects the data from Red Hat OpenShift Container Platform Prometheus, then sends the data to the Red Hat Advanced Cluster Management hub cluster.
Read the following documentation for more details about the observability component:
- Observability architecture
- Observability configuration
- Enabling the observability service
- This content is not included.Setting up a Grafana developer instance
- Using observability
- Configuring alerts for observability
- Observability advanced configuration
- Using observability with Red Hat Insights
-
RightSizingRecommendationguides (Technology Preview) - Multicluster observability add-on
1.1. Observability architecture
The multiclusterhub-operator enables the multicluster-observability-operator pod by default. You must configure the multicluster-observability-operator pod.
1.1.1. Observability open source components
Observability service uses open source observability tools from community. View the following descriptions of the tools that are apart of the product observability service:
- Thanos
- A toolkit of components that you can use to perform global querying across multiple Prometheus instances. For long-term storage of Prometheus data, persist it in any S3-compatible storage. You can also compose a highly-available and scalable metrics system.
- Prometheus
- A monitoring and alerting tool that you can use to collect metrics from your application and store these metrics as time-series data. Store all scraped samples locally, run rules to aggregate and record new time series from existing data, and generate alerts.
- Alertmanager
- A tool to manage and receive alerts from Prometheus. Deduplicate, group, and route alerts to your integrations such as email, Slack, and PagerDuty. Configure Alertmanager to silence and inhibit specific alerts.
1.1.2. Observability component versions
See the following list to learn which component versions Oberservability uses in Red Hat Advanced Cluster Management for Kubernetes 2.17:
Table 1.1. Table list of component versions
| Component | Version |
|---|---|
| Grafana | 12.2.0 |
| Thanos | 0.39.2 |
| Prometheus Alertmanager | 0.28.1 |
| Prometheus | 3.5.0 |
| Prometheus operator | 0.85.0 |
| Kube State Metrics | 2.17.0 |
| Node Exporter | 1.9.1 |
| Memcached Exporter | 0.15.3 |
1.1.3. Observability architecture diagram
The following diagram shows the components of observability:
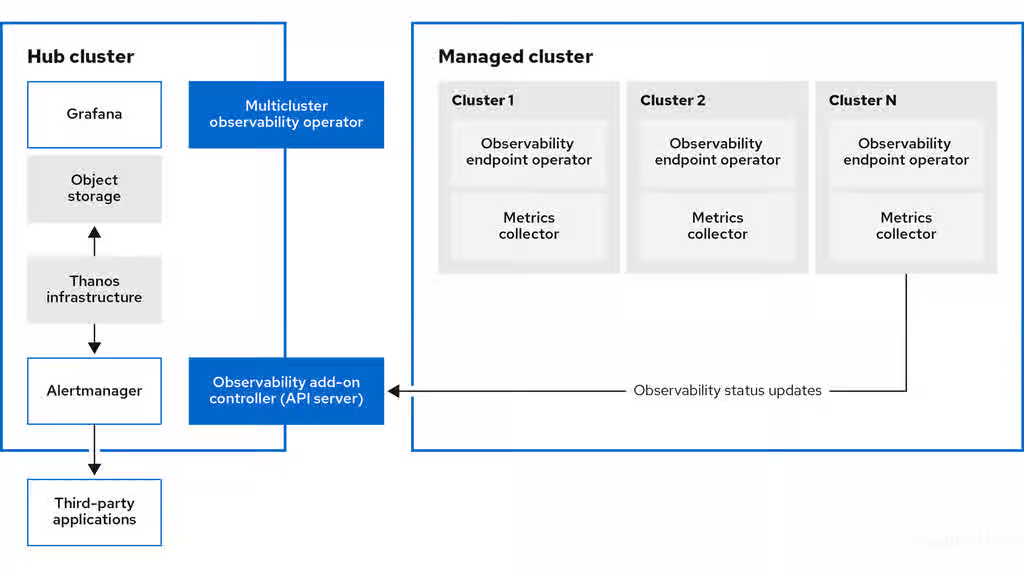
The components of the observability architecture include the following items:
-
The multicluster hub operator, also known as the
multiclusterhub-operatorpod, deploys themulticluster-observability-operatorpod. It is the root component that deploys resources for the Red Hat Advanced Cluster Management observability service, such as the metrics store on the hub cluster and collectors on managed clusters through the generation ofManifestWorksresources. - The observability add-on controller is the API server that automatically updates the log of the managed cluster.
The Thanos infrastructure includes the Thanos Compactor, which is deployed by the
multicluster-observability-operatorpod. The Thanos Compactor ensures that queries are performing well by using the retention configuration, and compaction of the data in storage.To help identify when the Thanos Compactor is experiencing issues, use the four default alerts that are monitoring its health. Read the following table of default alerts:
Table 1.2. Table of default Thanos alerts
Alert Severity Description ACMThanosCompactHaltedcritical
An alert is sent when the compactor stops.
ACMThanosCompactHighCompactionFailureswarning
An alert is sent when the compaction failure rate is greater than 5 percent.
ACMThanosCompactBucketHighOperationFailureswarning
An alert is sent when the bucket operation failure rate is greater than 5 percent.
ACMThanosCompactHasNotRunwarning
An alert is sent when the compactor has not uploaded anything in last 24 hours.
- The observability component deploys an instance of Grafana to enable data visualization with dashboards (static) or data exploration. You can also design your Grafana dashboard. For more information, see Using Grafana dashboards in the additional resources section.
- The Prometheus Alertmanager enables alerts to be forwarded with third-party applications. You can customize the observability service by creating custom recording rules or alerting rules.
1.1.4. Persistent stores used in the observability service
Important: Do not use the local storage operator or a storage class that uses local volumes for persistent storage. You can lose data if the pod relaunched on a different node after a restart. When this happens, the pod can no longer access the local storage on the node. Be sure that you can access the persistent volumes of the receive and rules pods to avoid data loss.
When you install Red Hat Advanced Cluster Management the following persistent volumes (PV) must be created so that Persistent Volume Claims (PVC) can attach to it automatically. As a reminder, you must define a storage class in the MultiClusterObservability custom resource when there is no default storage class specified or you want to use a non-default storage class to host the PVs. It is recommended to use Block Storage, similar to what Prometheus uses. Also each replica of alertmanager, thanos-compactor, thanos-ruler, thanos-receive-default and thanos-store-shard must have its own PV. View the following table:
Table 1.3. Table list of persistent volumes
| Component name | Purpose |
| alertmanager |
Alertmanager stores the |
| observability-thanos-compactor | The compactor needs local disk space to store intermediate data for its processing, as well as bucket state cache. The required space depends on the size of the underlying blocks. The compactor must have enough space to download all of the source blocks, then build the compacted blocks on the disk. On-disk data is safe to delete between restarts and should be the first attempt to get crash-looping compactors unstuck. However, it is recommended to give the compactor persistent disks in order to effectively use bucket state cache in between restarts. |
| observability-thanos-rule |
The thanos ruler evaluates Prometheus recording and alerting rules against a chosen query API by issuing queries at a fixed interval. Rule results are written back to the disk in the Prometheus 2.0 storage format. The amount of hours or days of data retained in this stateful set was fixed in the API version |
| observability-thanos-receive-default |
Thanos receiver accepts incoming data (Prometheus remote-write requests) and writes these into a local instance of the Prometheus TSDB. Periodically (every 2 hours), TSDB blocks are uploaded to the object storage for long term storage and compaction. The amount of hours or days of data retained in this stateful set, which acts a local cache was fixed in API Version |
| observability-thanos-store-shard | It acts primarily as an API gateway and therefore does not need a significant amount of local disk space. It joins a Thanos cluster on startup and advertises the data it can access. It keeps a small amount of information about all remote blocks on local disk and keeps it in sync with the bucket. This data is generally safe to delete across restarts at the cost of increased startup times. |
Note: The time series historical data is stored in object stores. Thanos uses object storage as the primary storage for metrics and metadata related to them. For more details about the object storage and downsampling, see Enabling observability service.
1.1.5. Observability support
- Red Hat Advanced Cluster Management is tested with and fully supported by Red Hat OpenShift Data Foundation.
- Red Hat Advanced Cluster Management supports the function of the multicluster observability operator on user-provided third-party object storage that is S3 API compatible. The observability service uses Thanos supported, stable object stores.
- Red Hat Advanced Cluster Management support efforts include reasonable efforts to identify root causes. If you open a support ticket and the root cause is the S3 compatible object storage that you provided, then you must open an issue using the customer support channels.
Additional resources
- Observability service
- Observability configuration
- Enabling the observability serviceSetting up the Grafana developer instance
- This content is not included.Backing up and restoring observability service
- Content from thanos.io is not included.Thanos documentation
- Content from prometheus.io is not included.Prometheus Overview
- Content from prometheus.io is not included.Alertmanager documentation
1.2. Observability configuration
When the observability service is enabled, the hub cluster is always configured to collect and send metrics to the configured Thanos instance, regardless of whether disableHubSelfManagement is set to true (enabled) or set to false (disabled). When the hub cluster is self-managed as a local-cluster, the disableHubSelfManagement parameter is set to false, which is the default setting. The multiclusterhub-operator enables the multicluster-observability-operator pod by default. You must configure the multicluster-observability-operator pod.
Metrics and alerts for the hub cluster appear in the <your-local-cluster-name> namespace. The local cluster is only available if disableHubSelfManagement is enabled. You can query the <your-local-cluster-name> metrics in the Grafana explorer. Continue reading to understand what metrics that you can collect with the observability component, and for information about the observability pod capacity.
1.2.1. Metric types
By default, OpenShift Container Platform sends metrics to Red Hat using the Telemetry service. The acm_managed_cluster_info is available with Red Hat Advanced Cluster Management and is included with telemetry, but is not displayed on the Red Hat Advanced Cluster Management Observe environments overview dashboard.
View the following table of metric types that are supported by the framework:
Table 1.4. Parameter table
| Metric name | Metric type | Labels/tags | Status |
|---|---|---|---|
|
| Gauge |
| Stable |
|
| Histogram | None | Stable. Read Governance metric for more details. |
|
| Histogram | None | Stable. Refer to Governance metric for more details. |
|
| Histogram | None | Stable. Read Governance metric for more details. |
|
| Gauge |
| Stable. Review Governance metric for more details. |
|
| Gauge |
| Stable. Review Governance metric for more details. |
|
| Gauge |
| Stable. Read Managing insight _PolicyReports_ for more details. |
|
| Counter | None | Stable. See the Search components section in the Searching in the console documentation. |
|
| Histogram | None | Stable. See the Search components section in the Searching in the console documentation. |
|
| Histogram | None | Stable. See the Search components section in the Searching in the console documentation. |
|
| Counter | None | Stable. See the Search components section in the Searching in the console documentation. |
|
| Histogram | None | Stable. See the Search components section in the Searching in the console documentation. |
|
| Gauge | None | Stable. See the Search components section in the Searching in the console documentation. |
|
| Histogram | None | Stable. See the Search components section in the Searching in the console documentation. |
1.2.2. Default metrics
To view the default metrics, see the observability-metrics-allowlist by running the following command:
oc -n open-cluster-management-observability get cm observability-metrics-allowlist -o yaml
Note: You cannot change the default metrics in the allowlist.
1.2.3. Observability pod capacity requests
Observability components require 2701mCPU and 11972Mi memory to install the observability service. The following table is a list of the pod capacity requests for five managed clusters with observability-addons enabled:
Table 1.5. Observability pod capacity requests
| Deployment or StatefulSet | Container name | CPU (mCPU) | Memory (Mi) | Replicas | Pod total CPU | Pod total memory |
|---|---|---|---|---|---|---|
| observability-alertmanager | alertmanager | 4 | 200 | 3 | 12 | 600 |
| config-reloader | 4 | 25 | 3 | 12 | 75 | |
| alertmanager-proxy | 1 | 20 | 3 | 3 | 60 | |
| observability-grafana | grafana | 4 | 100 | 2 | 8 | 200 |
| grafana-dashboard-loader | 4 | 50 | 2 | 8 | 100 | |
| observability-observatorium-api | observatorium-api | 20 | 128 | 2 | 40 | 256 |
| observability-observatorium-operator | observatorium-operator | 100 | 100 | 1 | 10 | 50 |
| observability-rbac-query-proxy | rbac-query-proxy | 20 | 100 | 2 | 40 | 200 |
| oauth-proxy | 1 | 20 | 2 | 2 | 40 | |
| observability-thanos-compact | thanos-compact | 500 | 1024 | 1 | 100 | 512 |
| observability-thanos-query | thanos-query | 300 | 1024 | 2 | 600 | 2048 |
| observability-thanos-query-frontend | thanos-query-frontend | 100 | 256 | 2 | 200 | 512 |
| observability-thanos-query-frontend-memcached | memcached | 45 | 128 | 3 | 135 | 384 |
| exporter | 5 | 50 | 3 | 15 | 150 | |
| observability-thanos-receive-controller | thanos-receive-controller | 4 | 32 | 1 | 4 | 32 |
| observability-thanos-receive-default | thanos-receive | 300 | 512 | 3 | 900 | 1536 |
| observability-thanos-rule | thanos-rule | 50 | 512 | 3 | 150 | 1536 |
| configmap-reloader | 4 | 25 | 3 | 12 | 75 | |
| observability-thanos-store-memcached | memcached | 45 | 128 | 3 | 135 | 384 |
| exporter | 5 | 50 | 3 | 15 | 150 | |
| observability-thanos-store-shard | thanos-store | 100 | 1024 | 3 | 300 | 3072 |
Additional resources
- Enabling the observability service
- Adding custom metrics
- Setting up the Grafana developer instance
- Information collected by Telemetry
- This content is not included.Governance metric
- Content from prometheus.io is not included.Prometheus recording rules
- Content from prometheus.io is not included.Prometheus alerting rules
1.3. Observability advanced configuration
After you enable observability, you can further customize the observability configuration to the specific needs of your environment. Manage and view cluster fleet data that the observability service collects.
View the following application advanced configuration topics:
- Adding custom metrics
- Scaling metrics collection (Technology Preview)
- Configuring proxy settings for observability add-ons
- Customizing route certificate
- Creating custom rules
- Updating the MultiClusterObservability custom resource replicas from the console
- Increasing and decreasing persistent volumes and persistent volume claims
- Customizing the managed cluster Observatorium API and Alertmanager URLs (Technology Preview)
- Configuring fine-grain RBAC (Technology Preview)
1.3.1. Adding custom metrics
To monitor metrics from a remote cluster by using Red Hat Advanced Cluster Management for Kubernetes, check if the metric is exported as a Platform or a User workload metric. Use one of the following three methods to find the metric type:
- Find the metric type in the documentation of the solution you want to monitor.
- Find the metric type by contacting the support for your product.
Find the metric type by checking the annotation that the
ServiceMonitorfor the observed resource uses.-
Platform metrics use
operator.prometheus.io/controller-id: openshift-platform-monitoring/prometheus-operator. -
User workload metrics use
operator.prometheus.io/controller-id: openshift-user-workload-monitoring/prometheus-operator.
-
Platform metrics use
You can also find ServiceMonitors in the console by going to Observe > Targets and choosing Platform or User from the Source filter in the top right.
Note: The Source filter provides service monitor or target information, not a list of metrics.
Required access: Cluster administrator
Procedure
-
Add Platform metrics by creating a
ConfigMapresource on the hub cluster in theopen-cluster-management-observabilitynamespace. Useobservability-metrics-custom-allowlistas the name. See the followingConfigMapexample that you can use to monitor Platform metrics:
kind: ConfigMap
apiVersion: v1
metadata:
  name: observability-metrics-custom-allowlist
  namespace: open-cluster-management-observability
data:
  metrics_list.yaml: |
    names:
      - node_memory_MemTotal_bytes
    recording_rules:
      - record: apiserver_request_duration_seconds:histogram_quantile_90
expr: histogram_quantile(0.90,sum(rate(apiserver_request_duration_seconds_bucket {job=\"apiserver\", verb!=\"WATCH\"}[5m])) by (verb,le))- Optional: Add the names of the custom metrics you want to collect from your managed cluster.
Optional: Add one value for the
exprandrecordparameter pair to define the query expression.Note: The name for the metrics you collect is the same name that you define in your managed cluster
recordparameter. After you run the query expression, you get the metric value results. You can use one section or both sections, which applies to every cluster with monitoring enabled.-
If you only want to collect custom metrics from a single managed cluster, use the following example and apply the config map on your managed cluster in the
open-cluster-management-addon-observabilitynamespace:
-
If you only want to collect custom metrics from a single managed cluster, use the following example and apply the config map on your managed cluster in the
kind: ConfigMap
apiVersion: v1
metadata:
  name: observability-metrics-custom-allowlist
  namespace: open-cluster-management-addon-observability
data:
  metrics_list.yaml: |
    names:
      - node_memory_MemTotal_bytes
        recording_rules:
      - record: apiserver_request_duration_seconds:histogram_quantile_90
expr: histogram_quantile(0.90,sum(rate(apiserver_request_duration_seconds_bucket{job="apiserver", verb!="WATCH"}[5m])) by (verb,le))- Optional: Add the names of the custom metrics you want to collect from your managed cluster.
Optional: Enter only one value for the
exprandrecordparameter pair to define the query expression.Note: The name for the metrics you collect is the same name that you define in your managed cluster
recordparameter. After you run the query expression, you get the metric value results. You can use one section or both sections.
1.3.2. Adding user workload metrics
To collect custom workload metrics from managed clusters, create ConfigMap resource named observability-metrics-custom-allowlist in a namespace.
After creating the ConfigMap resource, the observability collector collects and pushes the metrics from the target namespace to the hub cluster.
Procedure
-
Set the configuration on the managed cluster in namespace where you want to capture the user workload metrics. The name must be
observability-metrics-custom-allowlist. -
The following example monitors the User workload metric
sample_metricsfrom the namespacemonitored_namespace. If you create the configuration in theopen-cluster-management-addon-observabilitynamespace instead, the metrics are collected from all the namespaces of the managed cluster. See the following example:
kind: ConfigMap
apiVersion: v1
metadata:
  name: observability-metrics-custom-allowlist
  namespace: <monitored_namespace>
data:
  uwl_metrics_list.yaml:
    names:
- <sample_metrics>-
For the
dataparameter, add the value of the config map data in YAML format. List the metric names that you want to collect from thetestnamespace to thenamessection.
Additional resources
1.3.3. Removing default metrics
Remove default metrics from the observability-metrics-custom-allowlist.yaml file if you do not want to collect data for a specific metric from your managed cluster.
Procedure
Verify that
mco observabilityis enabled by using the following command:oc get mco observability -o yaml
Add the name of the default metric to the
metrics_list.yamlparameter with a hyphen-at the start of the metric name. View the following metric example:-cluster_infrastructure_provider
Create the
observability-metrics-custom-allowlistconfig map in theopen-cluster-management-observabilitynamespace with the following command:oc apply -n open-cluster-management-observability -f observability-metrics-custom-allowlist.yaml
- Verify that the observability service is not collecting the specific metric from your managed clusters. When you query the metric from the Grafana dashboard, the metric is not displayed.
Additional resources
1.3.4. Dynamic metrics for single-node OpenShift clusters
Dynamic metrics collection supports automatic metric collection based on certain conditions. By default, a single-node OpenShift cluster does not collect pod and container resource metrics. Once a single-node OpenShift cluster reaches a specific level of resource consumption, the defined granular metrics are collected dynamically. When the cluster resource consumption is consistently less than the threshold for a period of time, granular metric collection stops.
The metrics are collected dynamically based on the conditions on the managed cluster specified by a collection rule. Because these metrics are collected dynamically, the following Red Hat Advanced Cluster Management Grafana dashboards do not display any data. When a collection rule is activated and the corresponding metrics are collected, the following panels display data for the duration of the time that the collection rule is initiated:
- Kubernetes/Compute Resources/Namespace (Pods)
- Kubernetes/Compute Resources/Namespace (Workloads)
- Kubernetes/Compute Resources/Nodes (Pods)
- Kubernetes/Compute Resources/Pod
- Kubernetes/Compute Resources/Workload
A collection rule includes the following conditions:
- A set of metrics to collect dynamically.
- Conditions written as a PromQL expression.
-
A time interval for the collection, which must be set to
true. - A match expression to select clusters where the collect rule must be evaluated.
By default, collection rules are evaluated continuously on managed clusters every 30 seconds, or at a specific time interval. The lowest value between the collection interval and time interval takes precedence.
Once the collection rule condition persists for the duration specified by the for attribute, the collection rule starts and the metrics specified by the rule are automatically collected on the managed cluster. Metrics collection stops automatically after the collection rule condition no longer exists on the managed cluster, at least 15 minutes after it starts.
The collection rules are grouped together as a parameter section named collect_rules, where it can be enabled or disabled as a group. Red Hat Advanced Cluster Management installation includes the collection rule group, SNOResourceUsage with two default collection rules: HighCPUUsage and HighMemoryUsage. The HighCPUUsage collection rule begins when the node CPU usage exceeds 70%.
The HighMemoryUsage collection rule begins if the overall memory utilization of the single-node OpenShift cluster exceeds 70% of the available node memory. Currently, the previously mentioned thresholds are fixed and cannot be changed. When a collection rule begins for more than the interval specified by the for attribute, the system automatically starts collecting the metrics that are specified in the dynamic_metrics section.
View the list of dynamic metrics that from the collect_rules section, in the following YAML file:
collect_rules:
  - group: SNOResourceUsage
    annotations:
      description: >
        By default, a {sno} cluster does not collect pod and container resource metrics. Once a {sno} cluster
        reaches a level of resource consumption, these granular metrics are collected dynamically.
        When the cluster resource consumption is consistently less than the threshold for a period of time,
        collection of the granular metrics stops.
    selector:
      matchExpressions:
        - key: clusterType
          operator: In
          values: ["{sno}"]
    rules:
    - collect: SNOHighCPUUsage
      annotations:
        description: >
          Collects the dynamic metrics specified if the cluster cpu usage is constantly more than 70% for 2 minutes
      expr: (1 - avg(rate(node_cpu_seconds_total{mode=\"idle\"}[5m]))) * 100 > 70
      for: 2m
      dynamic_metrics:
        names:
          - container_cpu_cfs_periods_total
          - container_cpu_cfs_throttled_periods_total
          - kube_pod_container_resource_limits
          - kube_pod_container_resource_requests
          - namespace_workload_pod:kube_pod_owner:relabel
          - node_namespace_pod_container:container_cpu_usage_seconds_total:sum_irate
          - node_namespace_pod_container:container_cpu_usage_seconds_total:sum_rate
    - collect: SNOHighMemoryUsage
      annotations:
        description: >
          Collects the dynamic metrics specified if the cluster memory usage is constantly more than 70% for 2 minutes
      expr: (1 - sum(:node_memory_MemAvailable_bytes:sum) / sum(kube_node_status_allocatable{resource=\"memory\"})) * 100 > 70
      for: 2m
      dynamic_metrics:
        names:
          - kube_pod_container_resource_limits
          - kube_pod_container_resource_requests
          - namespace_workload_pod:kube_pod_owner:relabel
        matches:
          - __name__="container_memory_cache",container!=""
          - __name__="container_memory_rss",container!=""
          - __name__="container_memory_swap",container!=""
          - __name__="container_memory_working_set_bytes",container!=""
A collect_rules.group can be disabled in the custom-allowlist as shown in the following example. When a collect_rules.group is disabled, metrics collection reverts to the previous behavior. These metrics are collected at regularly, specified intervals:
collect_rules:
  - group: -SNOResourceUsage
The data is only displayed in Grafana when the rule is initiated.
1.3.5. Scaling metrics collection (Technology Preview)
To enhance performance in high-scale deployments, you can configure the metrics-collector to collect metrics in parallel with multiple workers. The default configuration uses a single worker to federate metrics. By increasing the number of workers in the metric collection process, you enable internal workers to shard /federate endpoint requests that are made to Prometheus on your managed cluster.
Required access: Cluster administrator
Prerequisites
- You have the observability service enabled on your hub and managed clusters. See Enabling the observability service.
Procedure
-
To increase and decrease metrics collection on your clusters, edit the
workersparameter in themulticluster-observability-operatorresource. If you want to use the same
workersvalue for each of your managed clusters, set the value in yourMultiClusterObservabilitycustom resource definition. By default, the value is set to1. For example, change theworkersparameter value to4. Your YAML file might resemble the following resource:apiVersion: observability.open-cluster-management.io/v1beta2 kind: MultiClusterObservability metadata: name: observability spec: observabilityAddonSpec: enableMetrics: true workers: 4Optional: If you want to override the
workersparameter for specific clusters, add theobservability.open-cluster-management.io/addon-source: "override"annotation to theObservabilityAddOnspecification of your managed cluster.-
To revert the override, use the
observability.open-cluster-management.io/addon-source: "mco"annotation.
-
To revert the override, use the
-
To verify the value of the
workersparameter, check the values in theMultiClusterObservabilitycustom resource.
1.3.6. Configuring proxy settings for observability add-ons
Configure the proxy settings to allow the communications from the managed cluster to access the hub cluster through a HTTP and HTTPS proxy server. Typically, add-ons do not need any special configuration to support HTTP and HTTPS proxy servers between a hub cluster and a managed cluster. But if you enabled the observability add-on, you must complete the proxy configuration.
Prerequisites
- You have a hub cluster.
- You have enabled the proxy settings between the hub cluster and managed cluster.
Procedure
- Configure proxy settings by navigating to the cluster namespace on your hub cluster.
Create an
AddOnDeploymentConfigresource with the proxy settings by adding aspec.proxyConfigparameter. View the following YAML example:apiVersion: addon.open-cluster-management.io/v1alpha1 kind: AddOnDeploymentConfig metadata: name: <addon-deploy-config-name> namespace: <managed-cluster-name> spec: agentInstallNamespace: open-cluster-management-addon-observability proxyConfig: httpsProxy: "http://<username>:<password>@<ip>:<port>" noProxy: ".cluster.local,.svc,172.30.0.1"-
For the
httpsProxyparameter, specify either a HTTP proxy or a HTTPS proxy. -
For the
noProxyparameter, include the IP address of thekube-apiserver.
-
For the
To get the IP address, run following command on your managed cluster:
oc -n default describe svc kubernetes | grep IP:
Go to the
ManagedClusterAddOnresource and update it by referencing theAddOnDeploymentConfigresource that you made. View the following YAML example:apiVersion: addon.open-cluster-management.io/v1alpha1 kind: ManagedClusterAddOn metadata: name: observability-controller namespace: <managed-cluster-name> spec: installNamespace: open-cluster-management-addon-observability configs: - group: addon.open-cluster-management.io resource: addondeploymentconfigs name: <addon-deploy-config-name> namespace: <managed-cluster-name>Note: The
spec.installNamespacefield is deprecated. See This content is not included.Product deprecations and removals to learn more.Verify the proxy settings. If you successfully configured the proxy settings, the metric collector deployed by the observability add-on agent on the managed cluster sends the data to the hub cluster. Complete the following steps:
- Go to the hub cluster then the managed cluster on the Grafana dashboard.
- View the metrics for the proxy settings.
Disable proxy settings for observability add-ons if you need to make development changes.
-
Go to the
ManagedClusterAddOnresource. -
Remove the referenced
AddOnDeploymentConfigresource.
-
Go to the
1.3.7. Customizing route certificate
If you want to customize the OpenShift Container Platform route certification, you must add the routes in the alt_names section. Configure secure connections with the observability object store by creating a Secret resource that contains the certificate authority and configuring the MultiClusterObservability custom resource.
To ensure your OpenShift Container Platform routes are accessible, add the following information: alertmanager.apps.<domainname>, observatorium-api.apps.<domainname>, rbac-query-proxy.apps.<domainname>.
Note: Users are responsible for certificate rotations and updates.
Procedure
Customize certificates for accessing the object store. To validate the object store connection, create the
Secretobject in the file that contains the certificate authority by using the following command:oc create secret generic <tls_secret_name> --from-file=ca.crt=<path_to_file> -n open-cluster-management-observability
Alternatively, you can apply the following YAML to create the secret:
apiVersion: v1
kind: Secret
metadata:
  name: <tls_secret_name>
  namespace: open-cluster-management-observability
type: Opaque
data:
  ca.crt: <base64_encoded_ca_certificate>
Optional: If you want to enable mutual TLS, you need to add the
public.crtandprivate.keykeys in the previous secret.Add the TLS secret details to the
metricObjectStoragesection by using the following command:oc edit mco observability -o yaml
Your file might resemble the following YAML:
metricObjectStorage:
  key: thanos.yaml
  name: thanos-object-storage
  tlsSecretName: tls-certs-secret
  tlsSecretMountPath: /etc/<s3-directory>/certs
-
The value for
tlsSecretNameis the name of theSecretobject that you previously created. -
The
/etc/<s3-directory>/certs/path defined for thetlsSecretMountPathparameter specifies where the certificates are mounted in the observability components. This path is required for the next step.
-
The value for
Update the
thanos.yamldefinition in thethanos-object-storagesecret by adding thehttp_config.tls_configsection with the certificate details. View the following example. Replace values where needed:thanos.yaml: | type: s3 config: bucket: <bucket-name> endpoint: <s3.port> insecure: false access_key: <s3-access> secret_key: <s3-secret> http_config: tls_config: ca_file: /etc/<s3-directory>/certs/ca.crt insecure_skip_verify: false-
Set the
insecureparameter tofalseto enable HTTPS. The path for the
ca_fileparameter must match thetlsSecretMountPathfrom theMultiClusterObservabilitycustom resource. Theca.crtmust match the key in the<tls_secret_name>Secretresource.Optional: If you want to enable mutual TLS, you need to add the
cert_fileandkey_filekeys to thetls_configsection. See the following example. Replace values where needed:
thanos.yaml: | type: s3 config: bucket: <bucket-name> endpoint: <s3.port> insecure: false access_key: <s3-access> secret_key: <s3-secret> http_config: tls_config: ca_file: /etc/<s3-directory>/certs/ca.crt cert_file: /etc/<s3-directory>/certs/public.crt key_file: /etc/<s3-directory>/certs/private.key insecure_skip_verify: false-
The path for
ca_file,cert_file, andkey_filemust match thetlsSecretMountPathfrom theMultiClusterObservabilitycustom resource. Theca.crt,public.crt, andprivate.crtmust match the respective key in thetls_secret_name>Secretresource.
-
Set the
To verify that you can access the object store, check that the pods are deployed. Run the following command:
oc -n open-cluster-management-observability get pods -l app.kubernetes.io/name=thanos-store
Additional resources
1.3.8. Creating custom rules
Create custom rules for the observability installation by adding Prometheus recording rules and alerting rules to the observability resource.
To precalculate expensive expressions, use the recording rules abilities with Prometheus to create alert conditions and send notifications based on how you want to send an alert to an external service. The results are saved as a new set of time series.
Procedure
Create the following custom alert rule to get a notification for when your CPU usage passes your defined value:
data: custom_rules.yaml: | groups: - name: cluster-health rules: - alert: ClusterCPUHealth-jb annotations: summary: Notify when CPU utilization on a cluster is greater than the defined utilization limit description: "The cluster has a high CPU usage: {{ $value }} core for {{ $labels.cluster }} {{ $labels.clusterID }}." expr: | max(cluster:cpu_usage_cores:sum) by (clusterID, cluster, prometheus) > 0 for: 5s labels: cluster: "{{ $labels.cluster }}" prometheus: "{{ $labels.prometheus }}" severity: criticalNotes:
-
When you update your custom rules,
observability-thanos-rulepods restart automatically. - You can create multiple rules in the configuration.
-
The default alert rules are in the
observability-thanos-rule-default-rulesconfig map of theopen-cluster-management-observabilitynamespace.
-
When you update your custom rules,
Create a custom recording rule to get the sum of the container memory cache of a pod. See the following example:
data: custom_rules.yaml: | groups: - name: container-memory rules: - record: pod:container_memory_cache:sum expr: sum(container_memory_cache{pod!=""}) BY (pod, container)Note: After you make changes to the config map, the configuration automatically reloads. The configuration reloads because of the
config-reloadwithin theobservability-thanos-rulesidecar.-
Verify that the alert rules are functioning correctly. Navigate to the Grafana dashboard by selecting the Explore page and query
ALERTS. The alert is only available in Grafana if you created the alert.
1.3.9. Securing communication from Alertmanager to third-party endpoints
Secure external communication from Alertmanager to third-party endpoints such as Slack, email, and PagerDuty for access to authorization credentials. Create Secret resources with arbitrary content that you can mount within your alertmanager pods.
Procedure
-
To reference secrets within your Alertmanager configuration, add the
Secretresource content within theopen-cluster-management-observabilitynamespace and mount the content within thealertmanagerpods. To create a
tlssecret with TLS certificates, run the following command:oc create secret tls tls --cert=</path/to/cert.crt> --key=</path/to/cert.key> -n open-cluster-management-observability
To mount the
tlssecret to yourMultiClusterObservabilityresource, add it to theadvancedsection. Your resource might resemble the following content:... advanced: alertmanager: secrets: ['tls']
To add a reference of your
tlssecret within your Alertmanager configuration, add the path of your secret to the configuration. Your resource might resemble the following configuration:tls_config: cert_file: '/etc/alertmanager/secrets/tls/tls.crt' key_file: '/etc/alertmanager/secrets/tls/tls.key'
To verify that the secrets are within your
alertmanagerpods, run the following command:oc -n open-cluster-management-observability get secret alertmanager-config --template='{{ index .data "alertmanager.yaml" }}' |base64 -d > alertmanager.yamlYour YAML might resemble the following contents:
"global": "http_config": "tls_config": "cert_file": "/etc/alertmanager/secrets/storyverify/tls.crt" "key_file": "/etc/alertmanager/secrets/storyverify/tls.key"To save the
alertmanager.yamlconfiguration in thealertmanager-configsecret, run the following command:oc -n open-cluster-management-observability create secret generic alertmanager-config --from-file=alertmanager.yaml --dry-run -o=yaml
To replace the previous secret with your new secret, run the following command:
oc -n open-cluster-management-observability replace secret --filename=-
Additional resources
- xref:../observability/obs_alerts.adoc
1.3.10. Forwarding your alerts
After you enable observability, alerts from your OpenShift Container Platform managed clusters are automatically sent to Alertmanager on your hub cluster. By default, all platform alerts are sent to Alertmanager on your hub cluster. Enable user workload alerts on your OpenShift Container Platform managed clusters to get user workload alerts forwarded to your hub cluster.
Procedure
Create the
alertmanager-configYAML file to configure alerts with an external notification system.View the following example of the
alertmanager-configYAML file:
global:
  slack_api_url: '<slack_webhook_url>'

route:
  receiver: 'slack-notifications'
  group_by: [alertname, datacenter, app]

receivers:
- name: 'slack-notifications'
  slack_configs:
  - channel: '#alerts'
text: 'https://internal.myorg.net/wiki/alerts/{{ .GroupLabels.app }}/{{ .GroupLabels.alertname }}'-
If you want to configure a proxy for alert forwarding, add the following
globalentry to thealertmanager-configYAML file:
global:
  slack_api_url: '<slack_webhook_url>'
  http_config:
proxy_url: http://****To forward user workload alerts, configure the alerts to be processed by the user workload Prometheus instance and not by Thanos ruler. See the following example of the
PrometheusRuleresource:apiVersion: monitoring.coreos.com/v1 kind: PrometheusRule metadata: labels: openshift.io/prometheus-rule-evaluation-scope: leaf-prometheus
1.3.11. Disabling alert forwarding for managed clusters
Disable alert forwarding for managed clusters to stop updates for the cluster-monitoring-reverted ConfigMap from the observability operator endpoint. To disable alert forwarding for managed clusters, set the mco-disable-alerting parameter to "true" in the MultiClusterObservability custom resource. When you disable alert forwarding for managed clusters, both the platform and user workload alerts are not forwarded to the Alertmanager on your hub cluster. The configuration updates for the cluster-monitoring-config config map in the openshift-monitoring namespace are reverted.
When the changes are reverted, the cluster-monitoring-reverted ConfigMap is created in the open-cluster-management-addon-observability namespace. Any new, alert forward configurations that are manually added are not reverted from the ConfigMap resource. After you update the configuration, both platform and user workload Prometheus instances on your managed cluster restarts. Complete the following steps:
Important: You lose metrics when a persistent volume is not configured for Prometheus on your managed cluster.
Procedure
Run the following command to set the
mco-disable-alertingparameter to"true":oc annotate MultiClusterObservability observability mco-disable-alerting=true
- Verify that the hub cluster alert manager is no longer propagating managed cluster alerts to third-party messaging tools.
1.3.12. Updating the MultiClusterObservability custom resource replicas from the console
If your workload increases, increase the number of replicas of your observability pods.
Required access: Cluster administrator
Procedure
- Navigate to the console from your hub cluster.
-
Locate the
MultiClusterObservabilitycustom resource, and update thereplicasparameter value for the component where you want to change the replicas. Your updated YAML might resemble the following content:
spec:
   advanced:
      receive:
replicas: 6Additional resources
- This content is not included.Observability API documentation
1.3.13. Increasing and decreasing persistent volumes and persistent volume claims
Increase and decrease the persistent volume and persistent volume claims to change the amount of storage in your storage class.
Procedure
-
To increase the size of the persistent volume, update the
MultiClusterObservabilitycustom resource if the storage class support expanding volumes. To decrease the size of the persistent volumes remove the pods using the persistent volumes, delete the persistent volume and re-create them. You might experience data loss in the persistent volume. Complete the following steps:
-
Pause the
MultiClusterObservabilityoperator by adding the annotationmco-pause: "true"to theMultiClusterObservabilitycustom resource. Look for the stateful sets or deployments of the desired component. Change their replica count to
0. This initiates a shutdown, which involves uploading local data when applicable to avoid data loss. For example, the ThanosReceivestateful set is namedobservability-thanos-receive-defaultand has three replicas by default. Therefore, you are looking for the following persistent volume claims:-
data-observability-thanos-receive-default-0 -
data-observability-thanos-receive-default-1 -
data-observability-thanos-receive-default-2
-
- Delete the persistent volumes and persistent volume claims used by the desired component.
-
In the
MultiClusterObservabilitycustom resource, edit the storage size in the configuration of the component to the desired amount in the storage size field. Prefix with the name of the component. -
Unpause the
MultiClusterObservabilityoperator by removing the previously added annotation. -
To initiate a reconcilation after having the operator paused, delete the
multicluster-observability-operatorandobservatorium-operatorpods. The pods are recreated and reconciled immediately.
-
Pause the
-
Verify that persistent volume and volume claims are updated by checking the
MultiClusterObservabilitycustom resource.
1.3.14. Customizing the managed cluster Observatorium API and Alertmanager URLs (Technology Preview)
You can customize the Observatorium API and Alertmanager URLs that the managed cluster uses to communicate with the hub cluster to maintain all Red Hat Advanced Cluster Management functions when you use a load balancer or reserve proxy.
Procedure
Add your URLs to the
advancedsection of theMultiClusterObservabilityspec. See the following example:spec: advanced: customObservabilityHubURL: <yourURL> customAlertmanagerHubURL: <yourURL>Notes:
-
Only HTTPS URLs are supported. If you do not add
https://to your URL, the scheme is added automatically. -
You can include the standard path for the Remote Write API,
/api/metrics/v1/default/api/v1/receivein thecustomObservabilityHubURLspec. If you do not include the path, the observability service automatically adds the path at runtime. - Any intermediate component you use for the custom observability hub cluster URL cannot use TLS termination because the component relies on MTLS authentication. The custom Alertmanager hub cluster URL supports intermediate component TLS termination by using your own existing certificate instructions.
-
Only HTTPS URLs are supported. If you do not add
If you are using a
customObservabilityHubURL, create a route object by using the following template. Replace<intermediate_component_url>with the intermediate component URL:apiVersion: route.openshift.io/v1 kind: Route metadata: name: proxy-observatorium-api namespace: open-cluster-management-observability spec: host: <intermediate_component_url> port: targetPort: public tls: insecureEdgeTerminationPolicy: None termination: passthrough to: kind: Service name: observability-observatorium-api weight: 100 wildcardPolicy: NoneIf you are using a
customAlertmanagerHubURL, create a route object by using the following template. Replace<intermediate_component_url>with the intermediate component URL:apiVersion: route.openshift.io/v1 kind: Route metadata: name: alertmanager-proxy namespace: open-cluster-management-observability spec: host: <intermediate_component_url> path: /api/v2 port: targetPort: oauth-proxy tls: insecureEdgeTerminationPolicy: Redirect termination: reencrypt to: kind: Service name: alertmanager weight: 100 wildcardPolicy: None
1.3.15. Silencing alerts
Silence alerts by the alert name, match label, or time duration. After you add the alert that you want to silence, an ID is created. Your ID for your silenced alert might resemble the following string, d839aca9-ed46-40be-84c4-dca8773671da.
Procedure
To silence a Red Hat Advanced Cluster Management alert, you must have access to the
alertmanagerpods in theopen-cluster-management-observabilitynamespace. Run the following command in theobservability-alertmanager-0pod terminal to silenceSampleAlert:amtool silence add --alertmanager.url="http://localhost:9093" --author="user" --comment="Silencing sample alert" alertname="SampleAlert"
Silence an alert by using multiple match labels. The following command uses
match-label-1andmatch-label-2:amtool silence add --alertmanager.url="http://localhost:9093" --author="user" --comment="Silencing sample alert" <match-label-1>=<match-value-1> <match-label-2>=<match-value-2>
If you want to silence an alert for a specific period of time, use the
--durationflag. Run the following command to silence theSampleAlertfor an hour:amtool silence add --alertmanager.url="http://localhost:9093" --author="user" --comment="Silencing sample alert" --duration="1h" alertname="SampleAlert"
Define a start or end time for the silenced alert. Run the following command to silence the
SampleAlertat a specific start time:amtool silence add --alertmanager.url="http://localhost:9093" --author="user" --comment="Silencing sample alert" --start="2023-04-14T15:04:05-07:00" alertname="SampleAlert"
To view all silenced alerts that are created, run the following command:
amtool silence --alertmanager.url="http://localhost:9093"
If you no longer want to silence an alert, end the silencing by running the following command:
amtool silence expire --alertmanager.url="http://localhost:9093" "d839aca9-ed46-40be-84c4-dca8773671da"
To end the silencing of all alerts, run the following command:
amtool silence expire --alertmanager.url="http://localhost:9093" $(amtool silence query --alertmanager.url="http://localhost:9093" -q)
1.3.16. Suppressing alerts
Suppress low-severity Red Hat Advanced Cluster Management alerts across your clusters globally to reduce alert notifications. Configure the alertmanager-config Secret resource in the open-cluster-management-observability namespace by adding alert inhibition rules.
Procedure
-
Mute an alert when there is a set of parameter matches that match another set of existing matchers. In order for the rule to take effect, both the target and source alerts must have the same label values for the label names in the
equallist. Yourinhibit_rulesmight resemble the following:
global:
  resolve_timeout: 1h
inhibit_rules:
  - equal:
      - namespace
    source_match
      severity: critical
    target_match_re:
severity: warning|infoThe
inhibit_rulesparameter section is defined to look for alerts in the same namespace. When acriticalalert is initiated within a namespace and if there are any other alerts that contain the severity levelwarningorinfoin that namespace, only thecriticalalerts are routed to the Alertmanager receiver. The following alerts might be displayed when there are matches:ALERTS{alertname="foo", namespace="ns-1", severity="critical"} ALERTS{alertname="foo", namespace="ns-1", severity="warning"}If the value of the
source_matchandtarget_match_reparameters do not match, the alert is routed to the receiver:ALERTS{alertname="foo", namespace="ns-1", severity="critical"} ALERTS{alertname="foo", namespace="ns-2", severity="warning"}- View suppressed alerts in Red Hat Advanced Cluster Management. Run the following command:
amtool alert --alertmanager.url="http://localhost:9093" --inhibited
1.3.17. Configuring fine-grain RBAC (Technology Preview)
To restrict metric access to specific namespaces within the cluster, use fine-grain role-based access control (RBAC). Using fine-grain RBAC, you can allow application teams to only view the metrics for the namespaces that you give them permission to access.
You must configure metric access control on the hub cluster for the users of that hub cluster. On this hub cluster, a ManagedCluster custom resource represents every managed cluster. To configure RBAC and to select the allowed namespaces, use the rules and action verbs specified in the ManagedCluster custom resources.
For example, you have an application named, my-awesome-app, and this application is on two different managed clusters, devcluster1 and devcluster2. Both clusters are in the AwesomeAppNS namespace. You have an admin user group named, my-awesome-app-admins, and you want to restrict this user group to only have access to metrics from only these two namespaces on the hub cluster.
Procedure
Define a
ClusterRoleresource with permissions to access metrics. Your resource might resemble the following YAML:apiVersion: rbac.authorization.k8s.io/v1 kind: ClusterRole metadata: name: awesome-app-metrics-role rules: - apiGroups: - "cluster.open-cluster-management.io" resources: - managedclusters: resourceNames: - devcluster1 - devcluster2 verbs: - metrics/AwesomeAppNS-
managedclustersrepresents the parameter values for the managed clusters. -
resourceNamesrepresents the list of managed clusters. -
verbsrepresents the namespace of the managed clusters.
-
Define a
ClusterRoleBindingresource that binds the group,my-awesome-app-admins, with theClusterRoleresource for theawesome-app-metrics-role. Your resource might resemble the following YAML:kind: ClusterRoleBinding apiVersion: rbac.authorization.k8s.io/v1 metadata: name: awesome-app-metrics-role-binding subjects: - kind: Group apiGroup: rbac.authorization.k8s.io name: my-awesome-app-admins roleRef: apiGroup: rbac.authorization.k8s.io kind: ClusterRole name: awesome-app-metrics-role
Note: When the users in the
my-awesome-app-adminsnamespace log in to the Grafana console, they have the following restrictions:- Users see no data for dashboards that summarize fleet level data.
-
Users can only select managed clusters and namespaces specified in the
ClusterRoleresource.
-
To set up different types of user access, define separate
ClusterRolesandClusterRoleBindingsresources to represent the different managed clusters in the namespaces.
1.4. Enabling the observability service
When you enable the observability service on your hub cluster, the multicluster-observability-operator watches for new managed clusters and automatically deploys metric and alert collection services to the managed clusters. You can use metrics and configure Grafana dashboards to make cluster resource information visible, help you save cost, and prevent service disruptions.
Monitor the status of your managed clusters with the observability component, also known as the multicluster-observability-operator pod. Enable the observability service by creating a MultiClusterObservability custom resource instance. After you enable the observability service, the following functions are initiated:
- All the alert managers from the managed clusters are forwarded to the Red Hat Advanced Cluster Management hub cluster.
All the managed clusters that are connected to the Red Hat Advanced Cluster Management hub cluster are enabled to send alerts back to the Red Hat Advanced Cluster Management observability service. You can configure the Red Hat Advanced Cluster Management Alertmanager to take care of deduplicating, grouping, and routing the alerts to the correct receiver integration such as email, PagerDuty, or OpsGenie. You can also handle silencing and inhibition of the alerts.
Note: Alert forwarding to the Red Hat Advanced Cluster Management hub cluster feature is only supported by managed clusters on a supported OpenShift Container Platform version. After you install Red Hat Advanced Cluster Management with observability enabled, alerts are automatically forwarded to the hub cluster. See Forwarding your alerts to learn more.
Required access: Cluster administrator, the open-cluster-management:cluster-manager-admin role, or S3 administrator.
Prerequisites
- You must install Red Hat Advanced Cluster Management for Kubernetes. See This content is not included.Installing while connected online for more information.
-
You must specify the
storageConfig.storageClassfield in theMultiClusterObservabilitycustom resource if you do not want to use the platform defaultstorageClass. - Direct network access to the hub cluster is required. Network access to load balancers and proxies are not supported. For more information, see This content is not included.Networking.
- Before you enable observability, see Observability pod capacity requests for more information.
You must configure an object store to create a storage solution.
Important:
- When you configure your object store, ensure that you meet the encryption requirements that are necessary when sensitive data is persisted. The observability service uses Thanos supported, stable object stores.
- You must use a separate object storage bucket for each hub cluster. Each observability installation requires a dedicated, unique bucket. Multiple writes to the same storage path at the same time causes data corruption, historical metrics loss, and stops the Thanos Compactor.
Red Hat Advanced Cluster Management supports the following cloud providers with stable object stores:
- Amazon Web Services S3 (AWS S3)
- Red Hat Ceph (S3 compatible API)
- Google Cloud Storage
- Azure storage
- Red Hat OpenShift Data Foundation, formerly known as Red Hat OpenShift Container Storage
- Red Hat OpenShift on IBM Cloud
-
When observability is enabled or disabled on OpenShift Container Platform managed clusters that are managed by Red Hat Advanced Cluster Management, the observability endpoint operator updates the
cluster-monitoring-configconfig map by adding additionalalertmanagerconfiguration that automatically restarts the local Prometheus. -
The observability endpoint operator updates the
cluster-monitoring-configconfig map by adding additionalalertmanagerconfigurations that automatically restart the local Prometheus. When you insert thealertmanagerconfiguration in the OpenShift Container Platform managed cluster, the configuration removes the settings that relate to the retention field of the Prometheus metrics.
Procedure
- Log in to your Red Hat Advanced Cluster Management hub cluster.
Create a namespace for the observability service with the following command:
oc create namespace open-cluster-management-observability
Generate your pull-secret. If Red Hat Advanced Cluster Management is installed in the
open-cluster-managementnamespace, run the following command:DOCKER_CONFIG_JSON=`oc extract secret/multiclusterhub-operator-pull-secret -n open-cluster-management --to=-`
If the
multiclusterhub-operator-pull-secretis not defined in the namespace, copy thepull-secretfrom theopenshift-confignamespace into theopen-cluster-management-observabilitynamespace by running the following command:DOCKER_CONFIG_JSON=`oc extract secret/pull-secret -n openshift-config --to=-`
Create the pull-secret in the
open-cluster-management-observabilitynamespace by running the following command:oc create secret generic multiclusterhub-operator-pull-secret \ -n open-cluster-management-observability \ --from-literal=.dockerconfigjson="$DOCKER_CONFIG_JSON" \ --type=kubernetes.io/dockerconfigjson
Important: If you modify the global pull secret for your cluster by using the OpenShift Container Platform documentation, be sure to also update the global pull secret in the observability namespace.
Create a secret object storage for your cloud provider. Your secret must contain the credentials to your storage solution. Run the following command to create a secret for the following cloud providers:
oc create -f thanos-object-storage.yaml -n open-cluster-management-observability
Create the following secret for Amazon S3 or S3 compatible:
apiVersion: v1 kind: Secret metadata: name: thanos-object-storage namespace: open-cluster-management-observability type: Opaque stringData: thanos.yaml: | type: s3 config: bucket: YOUR_S3_BUCKET endpoint: YOUR_S3_ENDPOINT insecure: true access_key: YOUR_ACCESS_KEY secret_key: YOUR_SECRET_KEY-
For the
endpointparameter, enter the URL without the protocol. Enter the URL for your Amazon S3 endpoint that might resemble the following URL:s3.us-east-1.amazonaws.com.
-
For the
Create the following secret for Google Cloud Platform:
apiVersion: v1 kind: Secret metadata: name: thanos-object-storage namespace: open-cluster-management-observability type: Opaque stringData: thanos.yaml: | type: GCS config: bucket: YOUR_GCS_BUCKET service_account: YOUR_SERVICE_ACCOUNTCreate the following secret for Microsoft Azure:
apiVersion: v1 kind: Secret metadata: name: thanos-object-storage namespace: open-cluster-management-observability type: Opaque stringData: thanos.yaml: | type: AZURE config: storage_account: YOUR_STORAGE_ACCT storage_account_key: YOUR_STORAGE_KEY container: YOUR_CONTAINER endpoint: blob.core.windows.net max_retries: 0-
If you use the
msi_resourcepath for theendpointparameter, the endpoint authentication is complete by using the system-assigned managed identity. Your value must resemble the following endpoint:Content from <storage-account-name>.blob.core.windows.net is not included.https://<storage-account-name>.blob.core.windows.net. If you use the
user_assigned_idpath for theendpointparameter, endpoint authentication is complete by using the user-assigned managed identity. When you use theuser_assigned_id, themsi_resourceendpoint default value ishttps:<storage_account>.<endpoint>. For more details, see Content from docs.microsoft.com is not included.Azure Storage documentation.Note: If you use Microsoft Azure as an object storage for a Red Hat OpenShift Container Platform cluster, the storage account associated with the cluster is not supported. You must create a new storage account.
-
If you use the
Create the following secret for Red Hat OpenShift Data Foundation:
apiVersion: v1 kind: Secret metadata: name: thanos-object-storage namespace: open-cluster-management-observability type: Opaque stringData: thanos.yaml: | type: s3 config: bucket: YOUR_RH_DATA_FOUNDATION_BUCKET endpoint: YOUR_RH_DATA_FOUNDATION_ENDPOINT insecure: false access_key: YOUR_RH_DATA_FOUNDATION_ACCESS_KEY secret_key: YOUR_RH_DATA_FOUNDATION_SECRET_KEYFor the
endpointparameter, enter the URL without the protocol. Enter the URL for your Red Hat OpenShift Data Foundation endpoint that might resemble the following URL:example.redhat.com:443.For more details, see This content is not included.Red Hat OpenShift Data Foundation.
- Create the following secret for Red Hat OpenShift on IBM:
apiVersion: v1 kind: Secret metadata: name: thanos-object-storage namespace: open-cluster-management-observability type: Opaque stringData: thanos.yaml: | type: s3 config: bucket: YOUR_ROKS_S3_BUCKET endpoint: YOUR_ROKS_S3_ENDPOINT insecure: true access_key: YOUR_ROKS_ACCESS_KEY secret_key: YOUR_ROKS_SECRET_KEY-
Enter the URL without the protocol. Enter the URL for your Red Hat OpenShift Data Foundation endpoint that might resemble the following URL:
example.redhat.com:443.
Verify that observability is enabled by checking the pods for the following deployments and stateful sets. You might receive the following information:
observability-thanos-query (deployment)
observability-thanos-compact (statefulset)
observability-thanos-receive-default  (statefulset)
observability-thanos-rule   (statefulset)
observability-thanos-store-shard-x  (statefulsets)
Additional resources
- Content from aws.amazon.com is not included.Amazon Web Services S3 (AWS S3)
- This content is not included.Red Hat Ceph (S3 compatible API)
- Content from cloud.google.com is not included.Google Cloud Storage
- Content from docs.microsoft.com is not included.Microsoft Azure storage
- This content is not included.Red Hat OpenShift Data Foundation (formerly known as Red Hat OpenShift Container Storage)
- Content from www.ibm.com is not included.Red Hat OpenShift on IBM
- Updating the global pull secret
- Content from cloud.ibm.com is not included.Cloud Object Storage
- Content from cloud.ibm.com is not included.Cloud Object Store
- Content from cloud.ibm.com is not included.Service Credentials
- Using observability
- Observability advanced configuration
- Observability service
1.4.1. Creating the MultiClusterObservability custom resource
Create the MultiClusterObservability custom resource to define the persistent volume storage sizes for various components. You must set the storage size during the initial creation of the MultiClusterObservability custom resource. Post-deployment changes take effect only if the storage class supports dynamic volume expansion.
Procedure
Create the
MultiClusterObservabilitycustom resource YAML file namedmulticlusterobservability_cr.yaml. View the following default YAML file for observability:apiVersion: observability.open-cluster-management.io/v1beta2 kind: MultiClusterObservability metadata: name: observability spec: observabilityAddonSpec: {} storageConfig: metricObjectStorage: name: thanos-object-storage key: thanos.yamlNote: You might want to modify the value for the
retentionConfigparameter in theadvancedsection. Depending on the number of managed clusters, you might want to update the amount of storage for stateful sets. If your S3 bucket is configured to use STS tokens, annotate the service accounts to use STS with S3 role. View the following configuration:spec: advanced: compact: serviceAccountAnnotations: eks.amazonaws.com/role-arn: $S3_ROLE store: serviceAccountAnnotations: eks.amazonaws.com/role-arn: $S3_ROLE rule: serviceAccountAnnotations: eks.amazonaws.com/role-arn: $S3_ROLE receive: serviceAccountAnnotations: eks.amazonaws.com/role-arn: $S3_ROLE query: serviceAccountAnnotations: eks.amazonaws.com/role-arn: $S3_ROLESee This content is not included.Observability API for more information.
To deploy on infrastructure machine sets, you must set a label for your set by updating the
nodeSelectorin theMultiClusterObservabilityYAML file. Your YAML file might resemble the following content:nodeSelector: node-role.kubernetes.io/infra: ""Apply the observability YAML to your cluster by running the following command:
oc apply -f multiclusterobservability_cr.yaml
Note: By default, if you do not define the
storageConfig.storageClassfield in theMultiClusterObservabilitycustom resource, platform defaultStorageClassfields are populated in thestorageConfigsection of theMultiClusterObservabilityresource. For example, AWS defaultstorageClassis set togp2.Verify default
storageClassby running the following command:oc get storageClass
See the following example output:
NAME                PROVISIONER       RECLAIMPOLICY   VOLUMEBINDINGMODE      ALLOWVOLUMEEXPANSION   AGE
gp2-csi             ebs.csi.aws.com   Delete          WaitForFirstConsumer   true                   151m
gp3-csi (default)   ebs.csi.aws.com   Delete          WaitForFirstConsumer   true                   151m
- Validate that the observability service is enabled and the data is populated by launching the Grafana dashboards.
- Click the Grafana link that is near the console header, from either the console Overview page or the Clusters page.
Access the
multicluster-observability-operatordeployment to verify that themulticluster-observability-operatorpod is being deployed by themulticlusterhub-operatordeployment. Run the following command:oc get deploy multicluster-observability-operator -n open-cluster-management --show-labels
You might receive the following results:
NAME                                  READY   UP-TO-DATE   AVAILABLE   AGE   LABELS
multicluster-observability-operator   1/1     1            1           35m   installer.name=multiclusterhub,installer.namespace=open-cluster-management
View the
labelssection of themulticluster-observability-operatordeployment for labels that are associated with the resource. Thelabelssection might contain the following details:labels: installer.name: multiclusterhub installer.namespace: open-cluster-management-
Optional: Add the
observability: disabledcluster label to your clusters if you want to exclude specific managed clusters from collecting the observability data.
1.4.2. Enabling observability from the Red Hat OpenShift Container Platform console
Optionally, you can enable observability from the Red Hat OpenShift Container Platform console. Create a project that is named open-cluster-management-observability.
Procedure
-
Create an image pull-secret named,
multiclusterhub-operator-pull-secretin theopen-cluster-management-observabilityproject. -
Create your object storage secret named,
thanos-object-storagein theopen-cluster-management-observabilityproject. - Enter the object storage secret details, then click Create. See step four of the Enabling observability section to view an example of a secret.
-
Create the
MultiClusterObservabilitycustom resource instance. When you receive the following message, the observability service is enabled successfully from OpenShift Container Platform:Observability components are deployed and running. - Verify the Thanos version from the command line interface (CLI). From your hub cluster, run the following command in the observability pods to receive the Thanos version:
thanos --version
1.4.3. Generating access keys using the AWS Security Service
Generate access keys for your cloud provider using AWS Security to authenticate and interact with your S3 bucket.
Procedure
Set up the AWS environment. Run the following commands:
export POLICY_VERSION=$(date +"%m-%d-%y")
export TRUST_POLICY_VERSION=$(date +"%m-%d-%y")
export CLUSTER_NAME=<my-cluster>
export S3_BUCKET=$CLUSTER_NAME-acm-observability
export REGION=us-east-2
export NAMESPACE=open-cluster-management-observability
export SA=tbd
export SCRATCH_DIR=/tmp/scratch
export OIDC_PROVIDER=$(oc get authentication.config.openshift.io cluster -o json | jq -r .spec.serviceAccountIssuer| sed -e "s/^https:\/\///")
export AWS_ACCOUNT_ID=$(aws sts get-caller-identity --query Account --output text)
export AWS_PAGER=""
rm -rf $SCRATCH_DIR
mkdir -p $SCRATCH_DIR
Create an S3 bucket with the following command:
aws s3 mb s3://$S3_BUCKET
Create a
s3-policyJSON file for access to your S3 bucket. Run the following command:{ "Version": "$POLICY_VERSION", "Statement": [ { "Sid": "Statement", "Effect": "Allow", "Action": [ "s3:ListBucket", "s3:GetObject", "s3:DeleteObject", "s3:PutObject", "s3:PutObjectAcl", "s3:CreateBucket", "s3:DeleteBucket" ], "Resource": [ "arn:aws:s3:::$S3_BUCKET/*", "arn:aws:s3:::$S3_BUCKET" ] } ] }Apply the policy with the following command:
S3_POLICY=$(aws iam create-policy --policy-name $CLUSTER_NAME-acm-obs \
--policy-document file://$SCRATCH_DIR/s3-policy.json \
--query 'Policy.Arn' --output text)
echo $S3_POLICY
Create a
TrustPolicyJSON file. Run the following command:{ "Version": "$TRUST_POLICY_VERSION", "Statement": [ { "Effect": "Allow", "Principal": { "Federated": "arn:aws:iam::${AWS_ACCOUNT_ID}:oidc-provider/${OIDC_PROVIDER}" }, "Action": "sts:AssumeRoleWithWebIdentity", "Condition": { "StringEquals": { "${OIDC_PROVIDER}:sub": [ "system:serviceaccount:${NAMESPACE}:observability-thanos-query", "system:serviceaccount:${NAMESPACE}:observability-thanos-store-shard", "system:serviceaccount:${NAMESPACE}:observability-thanos-compact", "system:serviceaccount:${NAMESPACE}:observability-thanos-rule", "system:serviceaccount:${NAMESPACE}:observability-thanos-receive" ] } } } ] }Create a role for AWS Prometheus and CloudWatch with the following command:
S3_ROLE=$(aws iam create-role \
  --role-name "$CLUSTER_NAME-acm-obs-s3" \
  --assume-role-policy-document file://$SCRATCH_DIR/TrustPolicy.json \
  --query "Role.Arn" --output text)
echo $S3_ROLE
Attach the policies to the role. Run the following command:
aws iam attach-role-policy \
  --role-name "$CLUSTER_NAME-acm-obs-s3" \
  --policy-arn $S3_POLICY
Your secret might resemble the following file. The
configsection specifiessignature_version2: falseand does not specifyaccess_keyandsecret_key:apiVersion: v1 kind: Secret metadata: name: thanos-object-storage namespace: open-cluster-management-observability type: Opaque stringData: thanos.yaml: | type: s3 config: bucket: $S3_BUCKET endpoint: s3.$REGION.amazonaws.com signature_version2: false-
Specify the service account annotations in the
MultiClusterObservabilitycustom resource as described in Creating the MultiClusterObservability custom resource section. Retrieve the S3 access key and secret key for your cloud providers with the following commands. You must decode, edit, and encode your
base64string in the secret:To edit and decode the S3 access key for your cloud provider, run the following command:
YOUR_CLOUD_PROVIDER_ACCESS_KEY=$(oc -n open-cluster-management-observability get secret <object-storage-secret> -o jsonpath="{.data.thanos\.yaml}" | base64 --decode | grep access_key | awk '{print $2}')To view the access key for your cloud provider, run the following command:
echo $YOUR_CLOUD_PROVIDER_ACCESS_KEY
To edit and decode the secret key for your cloud provider, run the following command:
YOUR_CLOUD_PROVIDER_SECRET_KEY=$(oc -n open-cluster-management-observability get secret <object-storage-secret> -o jsonpath="{.data.thanos\.yaml}" | base64 --decode | grep secret_key | awk '{print $2}')- Run the following command to view the secret key for your cloud provider:
echo $YOUR_CLOUD_PROVIDER_SECRET_KEY
1.4.4. Configuring storage for AWS Security Token Service
Configure Amazon Simple Storage Service (Amazon S3) or S3-compatible object storage by using short-term, limited-privilege credentials generated by the AWS Security Token Service (AWS STS).
Procedure
- Create an AWS Identity and Acess Management (IAM) policy that restricts access to your target Amazon S3 bucket.
- Create an IAM role containing a trust policy that generate JWT tokens for OpenShift Container Platform service accounts.
- Annotate the observability service accounts that require access to the Amazon S3 bucket.
1.5. Using observability
Use the observability service to view the utilization of clusters across your fleet. There are lists of alerts affecting the health of the operator and separately includes all OpenShift Virtualization alerts, even those not impacting the health of the operator.
To access your endpoint by using the mutual TLS, which verifies the identities of both parties in a network connection, query metrics through the Red Hat OpenShift Container Platform rbac-query-proxy route with the observability external API.
Required access: Cluster administrator
Procedure
Query metrics using the observability API. Get the details of the route with the following command:
export PROXY_ROUTE_URL=$(oc get route rbac-query-proxy -n open-cluster-management-observability -o jsonpath='{.spec.host}')To access the
rbac-query-proxyroute with your OpenShift Container Platform OAuth access token, run the following command to get the token. The token must be associated with a user or service account, which has permission to get namespaces:MY_TOKEN=$(oc whoami --show-token)
To access the
openshift-ingressroute, get the default CA certificate and store the content of thetls.crtkey in a local file. Run the following command:oc -n openshift-ingress get secret router-certs-default -o jsonpath="{.data.tls\.crt}" | base64 -d > ca.crtNote: The
router-certs-defaultsecret does not exist if your hub cluster is running on OpenShift Service on AWS. Instead, use the CA certificate thatspec.defaultCertificate.namepoints to in the default ingress controller object. Store the content of thetls.crtkey in a local file. Complete the following steps:-
Get the name of the
spec.defaultCertificate.nameby running the following command:
SECRET_NAME=$(oc get ingresscontroller default -n openshift-ingress-operator -o jsonpath=" {.spec.defaultCertificate.name}")Extract the certificate from the secret by running the following command:
oc get secret $SECRET_NAME -n openshift-ingress -o jsonpath=" {.data.tls\.crt}" | base64 -d > ca.crt
-
Get the name of the
To query metrics from the API, run the following command:
curl --cacert ./ca.crt -H "Authorization: Bearer ${MY_TOKEN}" https://${PROXY_ROUTE_URL}/api/v1/query?query=${QUERY_EXPRESSION}Note: The
QUERY_EXPRESSIONis the standard Prometheus query expression. For example, query the metricscluster_infrastructure_providerby replacing the URL in the previous command with the following URL:Content from {proxy_route_url} is not included.https://{PROXY_ROUTE_URL}/api/v1/query?query=cluster_infrastructure_provider. For more details, see Content from prometheus.io is not included.Querying Prometheus.-
If you want to configure custom certificates for the
rbac-query-proxyroute, see This content is not included.Replacing certificates for rbac-query-proxy route.
Additional resources
1.5.1. Setting up the Grafana developer instance
Use Grafana dashboards to view hub cluster and managed cluster metrics. The data displayed in the Grafana alerts dashboard relies on alerts metrics originating from managed clusters. The alerts metric does not affect managed clusters forwarding alerts to the Red Hat Advanced Cluster Management alert manager on the hub cluster. Therefore, the metrics and alerts have distinct propagation mechanisms and follow separate code paths.
Even if you see data in the Grafana alerts dashboard, that does not guarantee that the managed cluster alerts are successfully forwarding to the Red Hat Advanced Cluster Management hub cluster alert manager. If the metrics are propagated from the managed clusters, you can view the data displayed in the Grafana alerts dashboard.
Required access: Cluster administrator
Prerequisites
-
You must clone the
multicluster-observability-operatorrepository to access the required tools and scripts.
Procedure
Clone the
multicluster-observability-operatorrepository so that you are able to run the scripts that are in thetoolsfolder:git clone https://github.com/open-cluster-management/multicluster-observability-operator.git cd multicluster-observability-operator/tools
Run the
setup-grafana-dev.shscript to set up your Grafana instance. When you run the script with the--deployflag, the following resources are created:secret/grafana-dev-config,deployment.apps/grafana-dev,service/grafana-dev,ingress.extensions/grafana-dev, andpersistentvolumeclaim/grafana-dev:./setup-grafana-dev.sh --deploy
Your output might resemble the following content:
secret/grafana-dev-config created
deployment.apps/grafana-dev created
service/grafana-dev created
serviceaccount/grafana-dev created
clusterrolebinding.rbac.authorization.k8s.io/open-cluster-management:grafana-crb-dev created
route.route.openshift.io/grafana-dev created
persistentvolumeclaim/grafana-dev created
oauthclient.oauth.openshift.io/grafana-proxy-client-dev created
deployment.apps/grafana-dev patched
service/grafana-dev patched
route.route.openshift.io/grafana-dev patched
oauthclient.oauth.openshift.io/grafana-proxy-client-dev patched
clusterrolebinding.rbac.authorization.k8s.io/open-cluster-management:grafana-crb-dev patched
Switch your user role to Grafana administrator by using the
switch-to-grafana-admin.shscript:-
Select the Grafana URL,
https:grafana-dev-open-cluster-management-observability.{OPENSHIFT_INGRESS_DOMAIN}, then log in. From the CLI, run the following command to add the logged-in user as a Grafana administrator. For example, log in as the
kubeadminby running the following command:./switch-to-grafana-admin.sh kube:admin
Your output might resemble the following content:
User <kube:admin> switched to be grafana admin
-
Select the Grafana URL,
1.5.2. Verifying the Grafana version
Verify the Grafana version that is currently deployed within the cluster environment. You can verify from the command line interface (CLI) or from the Grafana user interface.
Required access: Cluster administrator
Procedure
Verify the Grafana version from the CLI:
- Log in to your hub cluster.
-
Access the terminal for the
observability-grafanapod.
To display the current Grafana version that is deployed within the cluster environment, run the following command:
grafana-cli --version
Verify the Grafana version from the Grafana console:
- Log in to the Grafana console dashboard.
- Navigate to the Manage tab.
- To view the version, scroll to the end of the page.
Additional resources
- Designing your Grafana dashboard
- Designing Grafana dashboards with a config map
- Exporting metrics to external endpoints for the multicluster observability add-on
- Content from man7.org is not included.uuidegen for instructions to create a UUID.
- Enabling managed cluster labels in Grafana
- Observability service
1.5.3. Designing Grafana dashboards
After you set up the Grafana instance, you can design the dashboard. Complete the following steps to refresh the Grafana console and design your dashboard.
Required access: Cluster administrator
Prerequisites
-
You must have an active and configured
grafana-devinstance.
Procedure
- From the Grafana console, create a dashboard by selecting the Create icon from the navigation panel.
- Select Dashboard, and then click Add new panel.
- From the New Dashboard/Edit Panel view, navigate to the Query tab.
-
Configure your query by selecting
Observatoriumfrom the data source selector. - Enter a valid Prometheus Query Language (PromQL) query.
- From the Grafana dashboard header, click the Save icon that is in the dashboard header.
- Add a descriptive name for the dashbard and click Save.
Additional resources
1.5.4. Designing Grafana dashboards with a config map
Design your Grafana dashboard with a Kubernetes config map. Wrapping your dashboard layout into a config map ensures reproducibility and persistence across environments. Use the generate-dashboard-configmap-yaml.sh script to generate the dashboard config map, and save the config map locally.
Prerequisites
-
You must have created a dashboard within your
grafana-devinstance. -
You must have permissions to apply configurations to the
open-cluster-management-observabilitynamespace.
Procedure
If you have permissions to run the automation scripts, run the following command and replace the dashboard name:
./generate-dashboard-configmap-yaml.sh "Example dashboard name"
Your might receive the following output:
Save dashboard <demo-dashboard> to ./demo-dashboard.yaml
If you do not have permissions to run the previously mentioned script, complete the following steps:
- Open your custom dashboard from the Grafana console and click the Dashboard settings icon.
- Click the JSON Model icon from the side navigation panel.
-
Copy the dashboard JSON data and paste it in the
datasection. -
Modify the
nameand replace$your-dashboard-name. -
Generate and enter a universally unique identifier (UUID) in the
uidfield indata.$your-dashboard-name.json.$$your_dashboard_json. You can use a program such as uuidegen to create a UUID. Create a YAML file Your
ConfigMapmight resemble the following file:kind: ConfigMap apiVersion: v1 metadata: name: $your-dashboard-name namespace: open-cluster-management-observability labels: grafana-custom-dashboard: "true" data: $your-dashboard-name.json: |- $your_dashboard_jsonNote: If your dashboard is not located in the General folder, use the
observability.open-cluster-management.io/dashboard-folderannotation to specify the target folder name. See the following example:
annotations:
  observability.open-cluster-management.io/dashboard-folder: Custom
Apply the YAML file fromo the CLI or OpenShift Container Platform console to create the config map. Run the following command:
oc apply -f demo-dashboard.yaml
- To apply the YAML from the console, navigate to the OpenShift Container Platform console.
- Open the YAML editor and paste the config map definition.
- Click Create to make the dashboard available in the folder.
Additional resources
1.5.5. Enabling managed cluster labels in Grafana
Enable managed cluster labels to use them with Grafana dashboards. When observability is enabled in the hub cluster, the observability-managed-cluster-label-allowlist ConfigMap is created in the open-cluster-management-observability namespace. The ConfigMap contains a list of managed cluster labels maintained by the observabilty-rbac-query-proxy pod, to populate a list of label names to filter from within the ACM - Cluster Overview Grafana dashboard. By default, observability ignores a subset of labels in the observability-managed-cluster-label-allowlist ConfigMap.
Procedure
Import or modify a cluster into the managed cluster fleet. The
observability-rbac-query-proxypod watches for any changes in reference to the managed cluster labels and automatically updates theobservability-managed-cluster-label-allowlistconfig map to reflect the changes. The config map contains only unique label names, which are either included in theignore_labelsorlabelslist. Yourobservability-managed-cluster-label-allowlistConfigMap might resemble the following YAML file:data: managed_cluster.yaml: | ignore_labels: - clusterID - cluster.open-cluster-management.io/clusterset - feature.open-cluster-management.io/addon-application-manager - feature.open-cluster-management.io/addon-cert-policy-controller - feature.open-cluster-management.io/addon-cluster-proxy - feature.open-cluster-management.io/addon-config-policy-controller - feature.open-cluster-management.io/addon-governance-policy-framework - feature.open-cluster-management.io/addon-observability-controller - feature.open-cluster-management.io/addon-search-collector - feature.open-cluster-management.io/addon-work-manager - installer.name - installer.namespace - local-cluster - name labels: - cloud - vendor-
Any label that is listed in the
ignore_labelskeylist of the ConfigMap is removed from the drop-down filter on the ACM - Clusters Overview Grafana dashboard. -
The labels that are enabled are displayed in the drop-down filter on the ACM - Clusters Overview Grafana dashboard. The values are from the
acm_managed_cluster_labelsmetric, depending on thelabelkey value that is selected.
-
Any label that is listed in the
Add a managed cluster label to the
observability-managed-cluster-label-allowlistconfig map for the label to appear available as a filter option in Grafana. Be sure to add a unique label to the hub cluster, or managed cluster object that is associated with the managed cluster fleet. For example, if you add the label,department=financeto a managed cluster, the config map is updated and might resemble the following changes:data: managed_cluster.yaml: | ignore_labels: - clusterID - cluster.open-cluster-management.io/clusterset - feature.open-cluster-management.io/addon-application-manager - feature.open-cluster-management.io/addon-cert-policy-controller - feature.open-cluster-management.io/addon-cluster-proxy - feature.open-cluster-management.io/addon-config-policy-controller - feature.open-cluster-management.io/addon-governance-policy-framework - feature.open-cluster-management.io/addon-observability-controller - feature.open-cluster-management.io/addon-search-collector - feature.open-cluster-management.io/addon-work-manager - installer.name - installer.namespace - local-cluster - name labels: - cloud - department - vendorEnable a managed cluster label that is in the
ignore_labelsparameter section. From theobservability-managed-cluster-label-allowlistconfig map, move the label to thelabelsparameter section.-
Enable the
local-clusterandnamelabels. The config map resyncs after 30 seconds to ensure that the cluster labels are updated. Yourobservability-managed-cluster-label-allowlistconfig map might resemble the following content:
data: managed_cluster.yaml: | ignore_labels: - clusterID - installer.name - installer.namespace labels: - cloud - vendor - local-cluster - name-
Enable the
Check the
observability-rbac-query-proxypod logs in theopen-cluster-management-observabilitynamespace to verify where the label is listed. Run the following command:oc logs -n open-cluster-management-observability deployment/observability-rbac-query-proxy | grep -i "label"
The following information might be displayed in the pod log:
enabled managedcluster labels: <label>
-
To remove the managed cluster labels from the Label drop-down filter in Grafana, add the label name to the
ignore_labelslist. Check the
observability-rbac-query-proxypod logs in theopen-cluster-management-observabilitynamespace to verify that the label is disabled. Run the following command:oc logs -n open-cluster-management-observability deployment/observability-rbac-query-proxy | grep -i "label"
The following information might be displayed in the pod log:
disabled managedcluster label: <label>
1.5.6. Viewing and exploring data by using Grafana dashboards
View the data from your managed clusters by accessing Grafana from the hub cluster. You can query specific alerts and add filters for the query. When you query historical data, manually set your query parameter options to control how much data is displayed from the dashboard.
Note: Do not set the ObservabilitySpec.resources.CPU.limits parameter if observability is enabled on single node managed clusters. When you set the CPU limits, it causes the observability pod to be counted against the capacity for your managed cluster. See the reference for Management Workload Partitioning in the Additional resources section.
- Viewing Red Hat Advanced Cluster Management dashboards
When you enable the Red Hat Advanced Cluster Management observability service, three dashboards become available. View the following dashboard descriptions:
- Alert Analysis: Overview dashboard of the alerts being generated within the managed cluster fleet.
- Clusters by Alert: Alert dashboard where you can filter by the alert name.
- Alerts by Cluster: Alert dashboard where you can filter by cluster, and view real-time data for alerts that are initiated or pending within the cluster environment.
Procedure
-
Explore the cluster_infrastructure_provider alert from a single-node OpenShift cluster, run the following query expression:
cluster_infrastructure_provider{clusterType="SNO"} - From your hub cluster, select the Grafana link that is in the console header.
- Edit your cluster dashboard by selecting Edit Panel.
- From the Query front-end data source in Grafana, click the Query tab.
-
Select
$datasource. - If you want to see more data, increase the value of the Step parameter section. If the Step parameter section is empty, it is automatically calculated.
- Find the Custom query parameters field and select max_source_resolution=auto.
- To verify that the data is displayed, refresh your Grafana page.
- View the etcd table from the hub cluster dashboard in Grafana to learn the stability of the etcd as a data store. Select the Grafana link from your hub cluster to view the etcd table data, which is collected from your hub cluster. The Leader election changes across managed clusters are displayed.
- View the Kubernetes API server dashboards to see the total number of clusters that are exceeding or meeting the targeted service-level objective (SLO) value for the past seven or 30-day period, offending and non-offending clusters, and API Server Request Duration.
View the cluster fleet Kubernetes API service-level overview from the hub cluster dashboard in Grafana:
- Navigate to the Grafana dashboard.
- Access the managed dashboard menu by selecting Kubernetes > Service-Level Overview > API Server. The Fleet Overview and Top Cluster details are displayed.
View the Kubernetes API service-level overview table from the hub cluster dashboard in Grafana to see the error budget for the past seven or 30-day period, the remaining downtime, and trend.
- Navigate to the Grafana dashboard from your hub cluster.
- Access the managed dashboard menu by selecting Kubernetes > Service-Level Overview > API Server. The Fleet Overview and Top Cluster details are displayed.
- View the OpenShift Virtualization dashboard to see comprehensive insights for each cluster with the OpenShift Virtualization operator installed. The state of the operator is displayed, which is determined by active OpenShift Virtualization alerts and the conditions of the Hyperconverged Cluster Operator.
- View the number of running virtual machines and the operator version for each cluster.
- Filter the dashboard by cluster name, operator health alerts, health impact of alerts, and alert severity.
1.5.7. Uninstalling the Grafana instance
When you do not need the Grafana instance, clean up the environment by running the uninstallation script.
Required access: Cluster administrator
Procedure
-
Run the
setup-grafana-dev.shscript with the--cleanflag to uninstall the Grafana instance and clean up the environment. When you run the script with the--cleanflag, the following resources are deleted:secret/grafana-dev-config,deployment.apps/grafana-dev,service/grafana-dev,ingress.extensions/grafana-dev, andpersistentvolumeclaim/grafana-dev.
./setup-grafana-dev.sh --clean
+ You might receive the following output:
+
secret "grafana-dev-config" deleted
deployment.apps "grafana-dev" deleted
serviceaccount "grafana-dev" deleted
route.route.openshift.io "grafana-dev" deleted
persistentvolumeclaim "grafana-dev" deleted
oauthclient.oauth.openshift.io "grafana-proxy-client-dev" deleted
clusterrolebinding.rbac.authorization.k8s.io "open-cluster-management:grafana-crb-dev" deleted
1.6. Disabling observability
You can disable observability to stop data collection on the Red Hat Advanced Cluster Management hub cluster. Disable observability by removing observability components on all managed clusters.
Procedure
-
Update the
multicluster-observability-operatorresource by settingenableMetricstofalse. Your updated resource might resemble the following change:
spec:
  imagePullPolicy: Always
  imagePullSecret: multiclusterhub-operator-pull-secret
  observabilityAddonSpec:
    enableMetrics: false
workers: 1-
Use the
observabilityAddonSpecparameter to define the global settings for all managed clusters that have the observability add-on enabled. Use the
enableMetricsparameter to indicate that the observability add-on is enabled to push metrics to hub cluster server.Disable observability on a single cluster.
-
Add the
observability: disabledlabel to themanagedclusters.cluster.open-cluster-management.iocustom resource. From the Red Hat Advanced Cluster Management console Clusters page, add the
observability=disabledlabel to the specified cluster.Note: When a managed cluster with the observability component is detached, the
metrics-collectordeployments are removed.
-
Add the
Remove observability to disable and uninstall the observability service.
- From the OpenShift Container Platform console navigation, select Operators > Installed Operators > Advanced Cluster Manager for Kubernetes.
-
Click Remove for the
MultiClusterObservabilitycustom resource.
1.7. Configuring alerts for observability
Configure alerts for observability to track the activity of both the hub cluster and managed cluster, forward platform and user workload alerts to the Alertmanager on your hub cluster, and route notifications to external systems such as Slack, email or PagerDuty. To add integrations and configure routes for Alertmanager, override the alertmanager-config secret in the open-cluster-management-observability namespace.
Prerequisites
- Enable observability on your hub cluster.
-
Have the create permission for
Secretresources in theopen-cluster-management-observabilitynamespace. -
Have edit permission on the
MultiClusterObservabilityresource. - Configure the Prometheus instances on your managed cluster to help prevent metric loss during restart. For help, see Configuring persistent storage in the OpenShift Container Platform documentation.
- Enable user workload monitoring and alerts on your managed clusters. For help, see Configuring user workload monitoring and Managing alerts in the OpenShift Container Platform documentation.
-
For the user workload for Prometheus, add a label to alerting rules to force only user workload Prometheus that are deployed in the
openshift-user-workload-monitoringnamespace to evaluate the alerting rule and prevents the Thanos Ruler instance from processing them. For help, see Enabling alert routing for user-defined projects in the OpenShift Container Platform documentation.
Procedure
Configure Alertmanager by extracting the data from the
alertmanager-configsecret. Run the following command:oc -n open-cluster-management-observability get secret alertmanager-config --template='{{ index .data "alertmanager.yaml" }}' |base64 -d > alertmanager.yamlEdit and save the
alertmanager.yamlfile configuration by running the following command:oc -n open-cluster-management-observability create secret generic alertmanager-config --from-file=alertmanager.yaml --dry-run -o=yaml | oc -n open-cluster-management-observability replace secret --filename=-
Your updated secret might resemble the following content:
global
  smtp_smarthost: 'localhost:25'
  smtp_from: 'alertmanager@example.org'
  smtp_auth_username: 'alertmanager'
  smtp_auth_password: 'password'
templates:
- '/etc/alertmanager/template/*.tmpl'
route:
  group_by: ['alertname', 'cluster', 'service']
  group_wait: 30s
  group_interval: 5m
  repeat_interval: 3h
  receiver: team-X-mails
  routes:
  - match_re:
      service: ^(foo1|foo2|baz)$
    receiver: team-X-mails
After you modify the secret, your changes are applied immediately. For an example of Alertmanager, see Content from github.com is not included.prometheus/alertmanager.
Additional resources
1.8. RightSizingRecommendation guides
The RightSizingRecommendation feature compares real-time CPU and memory usage with the resource configuration that you set, and offers guides to optimize workloads on a namespace and cluster level.
With RightSizingRecommendation, you can use infrastructure more efficiently, reduce costs, and ensure better performance across workloads by identifying over-provisioned or under-utilized resources across managed clusters.
After you enable the observability service, the RightSizingRecommendation feature is enabled by default for namespaces and virtual machines. View the following descriptions of your RightSizingRecommendation options:
- Namespace right-sizing
- Optimize workloads at the namespace and cluster level based on your pod CPU or memory usage.
- Virtualization right-sizing
- Optimize workloads at the virtual machine level and cluster level based on your virtual machine CPU or memory usage.
Notes:
- Prometheus rules are based on the cluster name, not on the cluster ID.
- The CPU and memory request, utilization, and guide metrics show maximum values based on the last number of aggregated days you select.
-
Historical data points are not backfilled. After you install the
RightSizingRecommendationfeature, you need to wait to investigate longer aggregation periods. -
After you enable the
RightSizingRecommendationfeature, it might take about 30 minutes for data to appear in the dashboard. The metric collection and aggregation with Thanos causes the delay.
See the following topics to learn about optimizing workloads by using RightSizingRecommendation specification:
1.8.1. Optimizing workloads by using RightSizingRecommendation for namespaces
Implement RightSizingRecommendation to view a comparison of real-time CPU and memory usage with the resource configuration that you set. After you enable the observability service, the RightSizingRecommendation feature for namespaces is enabled by default. You can disable the feature by editing the MultiClusterObservability custom resource on the hub cluster.
The RightSizingRecommendation feature uses the following resources:
- The
rs-namespace-configConfigMap -
Stores configurations for placement and
PrometheusRule. - The
rs-prom-rules-policyPolicy - Contains the Prometheus rules to evaluate resource usage.
- The
rs-placementPlacement - Determines target clusters based on label selectors.
- The
rs-policyset-bindingPlacementBinding - Binds the policy and placement together.
Required access: Editor
Prerequisites
-
You have
MultiClusterObservabilityoperator enabled on your hub cluster. To learn how to enable the observability, see Enabling the observability service.
Procedure
-
Disable
RightSizingRecommendationfor namespaces. Open the
observabilityinstance configuration. Run the following command:oc edit multiclusterobservability observability
Add the following lines to the
specsection of yourMultiClusterObservabilitycustom resource:apiVersion: observability.open-cluster-management.io/v1beta2 kind: MultiClusterObservability metadata: name: observability spec: capabilities: platform: analytics: namespaceRightSizingRecommendation: enabled: false . . .-
To enable
RightSizingRecommendationfor namespaces, set thenamespaceRightSizingRecommendation.enabled:totrue. -
View
RightSizingRecommendationguides from your Grafana board by selecting RightSizing Recommendation > ACM Right-Sizing Namespace. - To view the aggregated data on Grafana, expand or collapse the dashboard by clicking the drop-down arrow. For example, expand the memory data by clicking the name of the dashboard.
1.8.2. Configuring RightSizingRecommendation for namespaces
Customize RightSizingRecommendation to optimize CPU and memory resources for your namespaces. Edit the rs-namespace-config ConfigMap resource.
Required access: Editor
Prerequisites
-
You have enabled the
RightSizingRecommendationspecification. For more details, see Optimizing workloads by using RightSizingRecommendation guides for namespaces.
Procedure
Configure your placement for the
rs-namespace-configConfigMapresource placement. See the following example where the policy only applies to clusters with theenvironment=prodlabel:placementConfiguration: | spec: . . . predicates: - requiredClusterSelector: labelSelector: matchLabels: environment: prod . . .Configure your
PrometheusRuleresource by completing changes to one of the following steps:-
Define the namespaces that you want to include or exclude in the
namespaceFilterCriteriaspecification. -
Add a list of namespaces that you want to include in the
inclusionCriteriaspecification. Add a list of namespaces that you want to exclude in the
exclusionCriteriaspecification.Note: You cannot use both
inclusionCriteriaandexclusionCriteriaat the same time.To adjust the CPU and memory percentages, define the percentage usage.
See the following example where the
inclusionCriteriaspecification includesprodand theexclusionCriteriaexcludesopenshift:
. . . prometheusRuleConfig: | namespaceFilterCriteria: inclusionCriteria: - prod.* exclusionCriteria: - openshift.* labelFilterCriteria: - labelName: label_kubernetes_io_metadata_name inclusionCriteria: - prod - staging exclusionCriteria: - kube.* recommendationPercentage: 120 . . .-
Define the namespaces that you want to include or exclude in the
Configure your namespace binding. By default, the
RightSizingRecommendationfeature uses theopen-cluster-management-global-setnamespace for binding policies to clusters.To bind generated policies to a different namespace and cluster set, add your namespace to the
namespaceBindingspecification. Important: Ensure that the target namespace is part of a validClusterSetbefore you apply the change. The policies that you generate might not apply to any clusters if there is no valid binding.See the following example where the
<your-namespace-binding>namespace is the value fornamespaceBinding:
apiVersion: observability.open-cluster-management.io/v1beta2
kind: MultiClusterObservability
metadata:
  name: observability
spec:
  . . .
  capabilities:
    platform:
      analytics:
        namespaceRightSizingRecommendation:
          enabled: true
          namespaceBinding: <your-namespace-binding>
  . . .
1.8.3. Disabling RightSizingRecommendation for Virtualization workloads
Use RightSizingRecommendation for Virtualization to help you identify over-provisioned or under-utilized virtual machine resources across managed clusters. After you enable the observability service, the RightSizingRecommendation feature is enabled by default. You can disable the feature by editing the MultiClusterObservability custom resource on the hub cluster.
The RightSizingRecommendation feature uses the following resources:
- The
rs-virt-configConfigMap -
Stores virtual machine configurations for placement and
PrometheusRule. - The
rs-virt-prom-rules-policyPolicy - Contains the Prometheus rules to evaluate resource usage.
- The
rs-virt-placementPlacement - Determines target clusters based on label selectors.
- The
rs-virt-policyset-bindingPlacementBinding - Binds the policy and placement together.
Required access: Editor
Prerequisites
-
You have the
MultiClusterObservabilityoperator enabled on your hub cluster. To learn how to enable the observability, see Enabling the observability service. - You have the Red Hat OpenShift Virtualization operator installed on your related managed cluster or hub cluster. For more information, see Installing OpenShift Virtualization.
Procedure
Open the
observabilityinstance configuration. Run the following command:oc edit multiclusterobservability observability
Add the following lines to the
specsection of yourMultiClusterObservabilitycustom resource:apiVersion: observability.open-cluster-management.io/v1beta2 kind: MultiClusterObservability metadata: name: observability spec: capabilities: platform: analytics: virtualizationRightSizingRecommendation: enabled: false . . .-
To enable
RightSizingRecommendationfor your virtual machines, set thevirtualizationRightSizingRecommendation.enabled:parameter totrue. View
RightSizingRecommendationguides from your Grafana dashboard by selecting RightSizing Recommendation > ACM Right-Sizing OpenShift Virtualization.Note: The CPU and memory information at the cluster level is displayed.
- To view CPU and memory details, and past resource usage for your virtual machines, select the name of your virtual machine.
1.8.4. Configuring RightSizingRecommendation for Virtualization
You can customize the RightSizingRecommendation specification to optimize CPU and memory resources for your virtual machines. Edit the MultiClusterObservability resource.
Prerequisites
-
You have enabled the
RightSizingRecommendationspecification. For more information, see Enabling RightSizingRecommendation for Virtualization workloads.
Procedure
Configure placement for your virtual machines by editing the
rs-virt-configConfigMapresource and defining theplacementConfigurationparameter. Customize your placement to where the policy only applies to clusters with theenvironment=prodlabel, as displayed in the following example:placementConfiguration: | spec: . . . predicates: - requiredClusterSelector: labelSelector: matchLabels: environment: prod . . .Configure
PrometheusRulefor your virtual machines by completing one of the following steps:-
Define the namespaces that you want to include or exclude in the
namespaceFilterCriteriaspecification. -
Add a list of namespaces that you want to include in the
inclusionCriteriaspecification. Add a list of namespaces that you want to exclude in the
exclusionCriteriaspecification.Note: You cannot use both
inclusionCriteriaandexclusionCriteriaat the same time.To adjust the CPU and memory percentages, define the percentage usage.
See the following example where the
inclusionCriteriaspecification includesprodand theexclusionCriteriaexcludesopenshift:
. . . prometheusRuleConfig: | namespaceFilterCriteria: inclusionCriteria: - prod.* exclusionCriteria: - openshift.* labelFilterCriteria: - labelName: label_kubernetes_io_metadata_name inclusionCriteria: - prod - staging exclusionCriteria: - kube.* recommendationPercentage: 120 . . .-
Define the namespaces that you want to include or exclude in the
Configure your namespace binding. By default, the
RightSizingRecommendationfeature uses theopen-cluster-management-global-setnamespace for binding policies to clusters.To bind generated policies to a different namespace and cluster set, use the
namespaceBindingproperty. Important: Ensure that the target namespace is part of a validClusterSetbefore you apply the change. The policies that you generate might not apply to any clusters if there is no valid binding.See the following example where the
<your-namespace-binding>namespace is the value fornamespaceBinding:
apiVersion: observability.open-cluster-management.io/v1beta2 kind: MultiClusterObservability metadata: name: observability spec: . . . capabilities: platform: analytics: virtualizationRightSizingRecommendation: enabled: true namespaceBinding: <your-namespace-binding> . . .Important: Ensure that the target namespace is part of a valid
ClusterSetbefore you apply the change. The policies that you generate might not apply to any clusters if there is no valid binding.
1.9. Observability instance sizes
The observability instance sizes feature simplifies the scaling process for Red Hat Advanced Cluster Management for Kubernetes observability.
See the following table for the supported observability instance sizes and requirements:
Table 1.6. Table of instance sizes
| Instance size | Active timeseries supported | CPU units | Memory |
|---|---|---|---|
| Default | < 200k | 3 | 12 GiB |
| Minimal | < 1 million | 16 | 25 GiB |
| Small | 1 million | 32 | 72 GiB |
| Medium | 5 million | 55 | 137 GiB |
| Large | 10 million | 103 | 293 GiB |
| Xlarge | 20 million | 163 | 590 GiB |
| 2xlarge | 50 million | 222 | 1019 GiB |
| 4xlarge | 100 million | 337 | 2158 GiB |
- Active time series
-
A unique combination of a metric name and its associated labels that receives data. In a Prometheus-based system, a series is
activeif it received a new data point in the last 5 minutes.
To find the total number of active time series, use the following PromQL queries on the Observe > Metrics page on your hub cluster:
max(acm_prometheus_tsdb_head_series)
Note: The query returns the total number of series in memory. The output might include series that recently stopped receiving data but have not yet been moved to long-term storage yet.
1.10. Changing observability instance sizes
The observability instance sizes feature simplifies the scaling process for Red Hat Advanced Cluster Management for Kubernetes observability. With instance sizes, you can scale observability API and Thanos components to preconfigured settings instead of scaling each component individually.
The instance size feature is optional.
Required access: Cluster administrator
Prerequisites
- Your hub cluster needs sufficient CPU and memory resources for the instance size that you want to use. See Observability instance sizes for more information.
-
You must correctly configure persistent volumes for stateful components such as
alertmanager,thanos-compactor, andthanos-receive.
Procedure
-
To apply a size, edit the
MultiClusterObservabilitycustom resource on your hub cluster. Add the instance size that you want to use to the
spec.instanceSizefield in theMultiClusterObservabilitycustom resource. See the following YAML sample:apiVersion: observability.open-cluster-management.io/v1beta2 kind: MultiClusterObservability metadata: name: observability spec: instanceSize: <size_value>
-
For a list of valid
spec.instanceSizeoptions, see Observability instance sizes.
-
For a list of valid
-
Verify the status and instance size of the observability pods in the
open-cluster-management-observabilitynamespace in the console.
Important notes:
-
If you manually defined replicas or resource limits in the
AdvancedConfigsection of youMultiClusterObservabilitycustom resource, your existingAdvancedConfigsettings always override theinstanceSizesetting. - The default size aligns with the standard Red Hat Advanced Cluster Management installation requirements of 2701mCPU and 11972Mi memory for a five cluster environment. Due to variations in cluster size, number of nodes, load, and additional factors, only an approximation of the number of timeseries are provided.
1.11. Multicluster observability add-on
Use the multicluster observability add-on as an alternative way to collect metrics from your managed clusters. Configure metrics collection by using names, matchers, and recording rules for both platform and user workloads. The multicluster observability add-on use the Prometheus Operator and Prometheus Agent from the Red Hat OpenShift Cluster Observabililty Operator to federate, downsample, and remote-write metrics to your hub cluster. Reduce data loss during network partitions between your managed and hub clusters when you enable the multicluster observability add-on. By default, the multicluster observability add-on is disabled.
1.11.1. Managed cluster workloads
Managed cluster monitoring workloads use the Prometheus Operator and Prometheus Agent from the Cluster Observability Operator. The multicluster observability add-on uses the existing obo-prometheus-operator from Red Hat OpenShift Cluster Observabililty Operator on a managed cluster to reconcile Prometheus custom resources. If obo-prometheus-operator is not present, the multicluster observability add-on deploys obo-prometheus-operator within the configured agentInstallNamespace.
Both of the multicluster observability add-on and Cluster Observabililty Operator share the monitoring.rhobs API Group for the ScrapeConfig and PrometheusAgent resources.
For other managed clusters that are not OpenShift Container Platform clusters, the following resources are deployed:
- Node exporter
- Kube state metrics
- Prometheus server
Note: For clusters other than OpenShift Container Platform, the cluster ID of other managed clusters use the id.k8s.io claim of the managed cluster, while the current endpoint operator uses the cluster name.
1.11.2. Configurable APIs
Control monitoring behavior on your managed clusters by configuring default resource configurations. The following default resources are automatically created for platform monitoring and to have functional dashboards, PrometheusAgent, ScrapeConfig, and PrometheusRule. View the following descriptions of each API:
PrometheusAgent-
Defines a
PrometheusAgentdeployment, a resource-optimized Prometheus instance for remote-write workflows. Configures remote-write targets, scrape intervals, and resource limits. Use thePrometheusAgentresource as your metrics collector. ScrapeConfig-
A list of metrics to be federated from a given
target. Configure the following specifications,job_name,metrics_path,params, andrelabel_configs. You can override thetargetconfiguration for user workloads. PrometheusRule- Supports alerting and recording rule definitions that you can apply for each cluster. Supports groups of rules with evaluation intervals and alert annotations or labels.
ClusterManagementAddOnPlacements and configurations for deploying your managed clusters. Configurations include an
AddonDeploymentConfigresource to customize the deployment of the multicluster observability add-on on managed clusters. You can use this configuration to customize the node placement and select the installation namespace on your managed clusters, where the Prometheus Agent pods are deployed.Note: A single
AddonDeploymentConfigresource is used for all placements.
1.11.3. Default platform metrics
By default, the multicluster observability add-on collects platform metrics from your managed clusters. There are a set of ScrapeConfig resources that are automatically generated and deployed to all of your managed clusters. All placements that you reference within the ClusterManagementAddOn resource automatically receive the ScrapeConfig configurations. Use the default ScrapeConfig resources for platform workload dashboards.
The following default platform metrics are collected:
-
platform-metrics-hcp, which is specific for the hosted control plane platform -
platform-metrics-virtualization, which is specific for the Red Hat OpenShift Virtualization platform -
platform-metrics-alerts, which is specific for custom alert rule metrics across all platforms -
platform-metrics-default, which is specific for default metrics across all platfroms
1.11.4. Health status of the multicluster observability add-on
The multicluster observability add-on health status is reported through the ManagedClusterAddOn resource. From the OpenShift Container Platform console for each managed cluster, the ManagedClusterResource is displayed in the Fleet Management view. The status is degraded if some resources are not deployed or the platform PrometheusAgent resource is not running.
Note: For OpenShift Container Platform versions earlier than version 4.20, select All Clusters from the Cluster switcher.
The following alerting rules are pushed to all managed clusters:
MetricsCollectorNotIngestingSamples-
Alerts you when the
PrometheusAgentresource is not federating any metrics. MetricsCollectorRemoteWriteFailures-
Alerts you when there is a high failure rate for remote-write requests in the
PrometheusAgentresource of your managed cluster. MetricsCollectorRemoteWriteBehind-
Alerts you when the
PrometheusAgentresource remote-write is too slow.
Additional resources
- Enabling the multicluster observability add-on
- Configuring APIs for the multicluster obsservability add-on
- Adding custom metrics for the multicluster observability add-on
- Federating user workloads from Cluster Observability Operator
- Relabeling default metrics for the multicluster observability add-on
- Exportng metrics to external endpoints for the multicluster observability add-on
- Forwarding your alerts for multicluster observability add-on
1.11.5. Enabling the multicluster observability add-on
Enable the multicluster observability add-on on your hub cluster to configure your metrics for your platform and user workloads. You are required to enable platform workloads and it is optional to enable user workloads.
When you enable platform and userWorkloads specifications, the MultiClusterObservability operator stops deploying the metrics collectors to your managed clusters and deploys the multicluster-observability-addon-manager in the open-cluster-management-observability namespace. The multicluster-observability-addon-manager deploys the new metrics collectors based on the PrometheusAgent resource defined on your hub cluster.
Required access: Cluster administrator
Prerequisites
- You must enable the observability service on your hub cluster. For more details, see Enabling the observability service.
- You must install the Red Hat OpenShift Cluster Observability Operator. For more information, see Cluster Observability Operator overview.
Procedure
To enable platform monitoring and user workload monitoring, add the
platformanduserWorkloadsspecification to yourMultiClusterObservabilityresource. Run the following command:oc patch mco observability -n open-cluster-management-observability --type=merge -p '{"spec":{"capabilities":{"platform":{"metrics":{"default":{"enabled": true}}},"userWorkloads":{"metrics":{"default":{"enabled": true}}}}}}'Your
MultiClusterObservabilityresource might resemble the following file example:apiVersion: observability.open-cluster-management.io/v1beta2 kind: MultiClusterObservability metadata: name: observability spec: capabilities: platform: metrics: default: enabled: true userWorkloads: metrics: default: enabled: trueTo verify that the default configuration resources for the multicluster observability add-on are created, open your
multicluster-observability-addonClusterManagementAddonresource. Run the following command:oc get prometheusagents -n open-cluster-management-observability
Verify that the default configurations are added to your placements. Run the following command:
oc get cma multicluster-observability-addon -o yaml | yq '.spec.installStrategy.placements'
1.11.6. Configuring APIs for the multicluster observability add-on
Configure the default metrics-specific APIs of the multicluster observability add-on. When you reference a new placement in your ClusterManagementAddon resource, the multicluster-observability-addon-manager automatically creates specific default PrometheusAgent resources. The multicluster-observability-addon-manager adds the PrometheusAgent resources reference in the related Placement configurations.
While there is one PrometheusAgent resource created by the placement, the default ScrapeConfigs and PrometheusRules are common to all placements. The following resources are the default configuration resources for the multicluster observability add-on: PrometheusAgent, ScrapeConfigs, and PrometheusRules.
Required access: Cluster administrator
Prerequisites
- You have installed and enabled the multicluster observability add-on. For more information, see Enabling the multicluster observability add-on.
Procedure
-
Optional Override the default scrape interval for your
PrometheusAgentresource by changing thescrapeIntervalparameter. The default value is300s. You can also override thescrapeIntervalof thescrapeConfigresource. Configure the
ScrapeConfigresource to define a set of metrics for independent federation from Prometheus of your managed clusters. Complete the following steps:-
Add the name of the job that you want to reference for the
jobNameparameter. -
To ensure that Prometheus federates metrics, add the
/federateURL path for themetricsPathparameter. -
Add the metric name and labels that you want to collect. See the following YAML file example where the
ScrapeConfigresource collects theupmetric:
apiVersion: monitoring.rhobs/v1alpha1 kind: ScrapeConfig metadata: name: some-metrics-to-collect namespace: open-cluster-management-observability labels: - app.kubernetes.io/component: <platform-metrics-collector> or <user-workload-metrics-collector> spec: jobName: some-job-name metricsPath: /federate params: match[]: - '{__name__="up"}'-
Add the name of the job that you want to reference for the
Configure the
PrometheusRuleresource to limit the cardinality of your collected metrics on your hub cluster. Complete the following steps:- Define alerting and recording rules for platform and user workload monitoring on your managed clusters.
To target user workloads in your
PrometheusRuleresource, add the following annotation to define the namespace where you want to deploy the resource:observability.open-cluster-management.io/target-namespace.Notes: - When the
observability.open-cluster-management.io/target-namespaceis not set in yourPrometheusRuleresource, thePrometheusRuleresource are deployed to the default installation namespace. Ifopenshift.io/cluster-monitoringis set totrue, thePrometheusRuleresouces are not monitored by OpenShift Container Platform user workload monitoring stack. - Be sure to use themonitoring.coreos.comgroup for thePrometheusRuleresource.
Configure the
AddonDeploymentConfigresource to customize the deployment of the multicluster observability add-on on managed clusters. Note: The values in theAddonDeploymentConfigresource are override direct modifications of other resources. Complete the following steps:-
Define the namespace where you install the
PrometheusAgentresource for theagentInstallNamespaceparameter. The default namespace isopen-cluster-management-agent-addon. -
Add the
nodePlacementspecification with the associatednodeSelectorandtolerationsparameters. -
Edit the
proxyConfigspecification by updating thehttpProxyandnoProxyconfigurations.
-
Define the namespace where you install the
1.11.7. Adding custom metrics for the multicluster observability add-on
Add your own custom metrics to be collected from your managed clusters by configuring the ScrapeConfig resource. The ScrapeConfig must be added to the Placement configurations of the ClusterManagementAddOn resource for deploying on the corresponding managed clusters. The Prometheus operator on each managed cluster adds the new ScrapeConfig resource to the PrometheusAgent resource.
Requierd access: Cluster administrator
Prerequisites
- You have installed and enabled the multicluster observability add-on. For more information, see Enabling the multicluster observability add-on.
Procedure
-
Create a new
ScrapeConfigresource in theopen-cluster-management-observabilitynamespace that includes values for the required parameters,jobName,metricsPath, andparams. Add the appropriate label for the
app.kubernetes.io/componentparameter to specify whether the metrics are for platform monitoring or user workload monitoring. Use one of the following label values,platform-metrics-collectororuser-workload-metrics-collector.Note: When you use the
platform-metrics-collectorlabel, the multicluster observability add-on automatically sets thescrapeClassandtargetsparameters to enable federation from the platform Prometheus of your OpenShift Container Platform managed cluster. You can override thescrapeClassandtargetsparameters by adding the value that you need.-
Optional: Manually set the
scrapeClassandstaticConfigsspecifications for youruser-workload-metrics-collectorScrapeConfigresource. Add the
ScrapeConfigresource reference to the placements of theClusterManagementAddOnresource where you want the resource to be deployed.Note: Ensure that you reference the
ScrapeConfigresource only after you create it. Otherwise, the add-on status updates to aDeployingstatus because the resource does not exist.Your
ScrapeConfigresource might resemble the following YAML file:apiVersion: monitoring.rhobs/v1alpha1 kind: ScrapeConfig metadata: name: add-custom-metrics namespace: open-cluster-management-observability labels: - app.kubernetes.io/component: platform-metrics-collector spec: jobName: some-job-name metricsPath: /federate params: match[]: - '{__name__="up"}'
1.11.8. Federating user workloads from Cluster Observability Operator
Configure the observability service to federate user workload metrics from the Red Hat OpenShift Cluster Observability Operator on your managed clusters. By default, user workload metrics are federated from the Prometheus user-workload on your OpenShift Container Platform cluster.
Required access: Cluster administrator
Prerequisites
- User workload monitoring is enabled on your managed cluster.
-
User workload monitoring is enabled in the
MultiClusterObservabilitycustom resource. -
You have created
ScrapeConfigresources with theapp.kubernetes.io/component: <user-workload-metrics-collector>label. -
The
ScrapeConfigresources are referenced in the configurations list of theClusterManagementAddOnfor the target placements.
Procedure
Update your
ScrapeConfigresource by adding the endpoint of the Cluster Observability OperatorMonitoringStackresource. Your resource might resemble the following YAML file:apiVersion: monitoring.coreos.com/v1alpha1 kind: ScrapeConfig spec: scrapeClass: “” scheme: HTTP staticConfigs: - targets: - my-monitoring-stack.my-monitoring-ns.svc:9090-
If you use a proxy with the Prometheus server, modify the
ScrapeConfigresource to include your TLS configuration. Create a correspondingscrapeClassspecification on the user workloadPrometheusAgentresource. Then reference thePrometheusAgentresource within theScrapeConfigresource.
1.11.9. Relabeling default metrics for the multicluster observability add-on
Relabel configurations to modify or remove the default metrics that you are collecting. Relabel configurations in each ScrapeConfig resource or globally in the remoteWrite configuration of the PrometheusAgent resource.
Required access: Cluster administrator
Prerequisites
- You have installed and enabled the multicluster observability add-on. For more information, see Enabling the multicluster observability add-on.
Procedure
To remove the
Watchdogalert metric, add thewriteRelabelConfigsspecification to theremoteWriteconfiguration of thePrometheusAgentresource. The metric removal is complete after it is federated. YourPrometheusAgentresource might resemble the following YAML file:apiVersion: monitoring.rhobs/v1alpha1 kind: ScrapeConfig metadata: name: platform-metrics-alerts namespace: open-cluster-management-observability spec: jobName: alerts metricRelabelings: - action: labeldrop regex: managed_cluster|id - action: drop regex: ^Watchdog$ sourceLabels: - alertname metricsPath: /federate params: 'match[]': - '{__name__="ALERTS"}' scheme: HTTPS scrapeClass: not-configurable staticConfigs: - targets: - not-configurable
1.11.10. Migrating custom allowlist
Use the allowlist-migration command-line interface to convert the observability-metrics-allowlist custom resource to ScrapeConfig and PrometheusRule resources. Converting to the ScrapeConfig and PrometheusRule resources allows for a scalable way to manage your custom allowlist configuration.
Download the allowlist-migration binary file for your operating system and input your custom allowlist from the console to receive the equivalent ScrapeConfig and PrometheusRule resources.
Required access: Cluster administrator
Prerequsites
-
Ensure the
multicluster-observability-addonis installed on the hub cluster.
Procedure
- From the Fleet Management perspective in the console, then click Help > Command Line Tools.
- Find the list of available downloads in the Advanced Cluster Management Observability Migration Tool - latest section.
-
Download the
allowlist-migrationbinary file for your operating system and architecture. Change the permissions. Run the following command:
chmod +x /path/to/migration
To generate your
ScrapeConfigandPrometheusRuleresources, run the following command:/path/to/migration allowlist.yaml output/dir
Add the generated
ScrapeConfigresources to your cluster by running the following command:oc apply -f <output/dir>/custom-scrapeconfig.yaml -n open-cluster-management-observability
Add the generated
PrometheusRuleresources to your cluster by running the following command:oc apply -f <output/dir>/custom-prometheusrule.yaml -n open-cluster-management-observability
Add the generated
ScrapeConfigandPrometheusRuleresources to theClusterManagementAddOnresource. Run the following command:oc patch clustermanagementaddon multicluster-observability-addon --type=json -p='[ { "op": "add", "path": "/spec/installStrategy/placements/0/configs/-", "value": { "group": "monitoring.rhobs", "resource": "scrapeconfigs", "name": "custom-scrapeconfig", "namespace": "open-cluster-management-observability" } }, { "op": "add", "path": "/spec/installStrategy/placements/0/configs/-", "value": { "group": "monitoring.coreos.com", "resource": "prometheusrules", "name": "custom-prometheusrule", "namespace": "open-cluster-management-observability" } } ]'
Verification
Verify that the generated
ScrapeConfigresource exists on your hub cluster. Run the following command:oc get ScrapeConfig -n open-cluster-management-observability
Ensure that the generated
PrometheusRuleresource exists on your hub cluster. Run the following command:oc get PrometheusRule -n open-cluster-management-observability
Verify that the
ScrapeConfigresource is propogated to the managed cluster. Run the following command:oc get ScrapeConfig -n open-cluster-management-agent-addon
Check that the
PrometheusRuleresource is propogated to the managed cluster. Run the following command:oc get PrometheusRule -n open-cluster-management-agent-addon
-
Verify custom metrics collection by entering a query in Grafana. For example, enter the following query to verify use of the
ScrapeConfigresource:up{job="my-app"}.
1.11.11. Migrating observability storage
Migrate observability storage while retaining the silenced alerts from its earlier state. Create new StatefulSets and PersistentVolumes resources that use your chosen StorageClass resource. Note: The storage for persistent volumes is different from the object storage used to store the metrics collected from your clusters.
When you use StatefulSets and PersistentVolumes resource to migrate your observability data to new storage, the resources store the following data components:
- Observatorium or Thanos
- Receives data then uploads it to object storage. Some of its components store data in PVs. For this data, the Observatorium or Thanos automatically regenerates the object storage on a startup, so there is no consequence if you lose this data.
- Alertmanager
- Only stores silenced alerts. If you want to keep these silenced alerts, you must migrate that data to the new PV.
Procedure
-
In the
MultiClusterObservability, set the.spec.storageConfig.storageClassfield to the new storage class. -
To ensure the data of the earlier
PersistentVolumesis retained even when you delete thePersistentVolumeClaim, go to all your existingPersistentVolumes. -
Change the
reclaimPolicyto"Retain": `oc patch pv <your-pv-name> -p '{"spec":{"persistentVolumeReclaimPolicy":"Retain"}}'. - Optional: To avoid losing data, see Migrate persistent data to another Storage Class in DG 8 Operator in OCP 4.
Delete both the
StatefulSetand thePersistentVolumeClaimin the followingStatefulSetcases:-
alertmanager-db-observability-alertmanager-<REPLICA_NUMBER> -
data-observability-thanos-<COMPONENT_NAME> -
data-observability-thanos-receive-default -
data-observability-thanos-store-shard
-
-
Optional: You might need to delete, then re-create the
MultiClusterObservabilityoperator pod so that you can create the newStatefulSet. -
Re-create a new
PersistentVolumeClaimwith the same name but the correctStorageClass. -
Create a new
PersistentVolumeClaimreferring to the oldPersistentVolume. -
Verify that the new
StatefulSetandPersistentVolumesuse the newStorageClassthat you chose.
1.11.12. Exporting metrics to external endpoints
To support the Prometheus Remote-Write specification in real time, export metrics to external endpoints.
Procedure
Create the Kubernetes secret for an external endpoint with the access information of the external endpoint in the
open-cluster-management-observabilitynamespace. View the following example secret:apiVersion: v1 kind: Secret metadata: name: victoriametrics namespace: open-cluster-management-observability type: Opaque stringData: ep.yaml: | url: http://victoriametrics:8428/api/v1/write http_client_config: basic_auth: username: test password: test tls_config: secret_name: ca_file_key: cert_file_key: key_file_key: insecure_skip_verify:-
The
ep.yamlparameter is the key of the content and is used in theMultiClusterObservabilitycustom resource in next step. Currently, observability supports exporting metrics to endpoints without any security checks, with Basic authentication or withtlsenablement. View the following tables for a full list of supported parameters: -
The
urlparameter is required and the URL for the external endpoint. Enter the value as a string. -
The
http_client_configparameter is optional and is the advanced configuration for the HTTP client. -
The
basic_authparameter is optional and is the HTTP client configuration for Basic authentication. -
The
usernameparameter is optional and is the user name for basic authorization. Enter the value as a string. -
The
passwordis optional and is the password for basic authorization. Enter the value as a string. -
The
tls_configparameter is optional and is the HTTP client configuration for TLS. -
The
secret_nameparameter is required and is the name of the secret that contains certificates. Enter the value as a string. -
The
ca_file_keyparameter is required and the key of the CA certificate in the secret. This parameter is only optional if theinsecure_skip_verifyparameter is set totrue. Enter the value as a string. -
The
cert_file_keyparameter is required and is the key of the client certificate in the secret. Enter the value as a string. -
The
key_file_keyparameter is required and is the key of the client key in the secret. Enter the value as a string. -
The
insecure_skip_verifyparameter is optional and used to skip the verification for target certificate. Enter the value as a boolean value.
-
The
To add a list of external endpoints that you want to export, add the
writeStorageparameter to theMultiClusterObservabilitycustom resource. View the following example:spec: storageConfig: writeStorage: - key: ep.yaml name: victoriametrics- Each item contains two attributes: name and key. Name is the name of the Kubernetes secret that contains endpoint access information, and key is the key of the content in the secret. If you add more than one item to the list, then the metrics are exported to multiple external endpoints.
View the status of metric export after the metrics export is enabled by checking the
acm_remote_write_requests_totalmetric.- From the OpenShift Container Platform console of your hub cluster, navigate to the Metrics page by clicking Metrics in the Observe section.
-
Then query the
acm_remote_write_requests_totalmetric. The value of that metric is the total number of requests with a specific response for one external endpoint, on one observatorium API instance. Thenamelabel is the name for the external endpoint. Thecodelabel is the return code of the HTTP request for the metrics export.
1.11.13. Exporting metrics to external endpoints for the multicluster observability add-on
To configure an external metrics endpoint, add your custom remoteWrite specification to your PrometheusAgent resources. When you configure your remoteWrite specification, the managed cluster sends metrics are directly to the external endpoint. Update related multicluster observability add-on configurations by relabeling default metrics. Exporting metrics from your managed cluster helps you improve resiliency during network partitions between your managed and hub clusters for up to two hours.
Required access: Cluster administrator
Prerequisites
- You have installed and enabled the multicluster observability add-on. For more information, see Enabling the multicluster observability add-on.
Procedure
-
Create the TLS
Secretconfig maps within theopen-cluster-management-observabilitynamespace. -
Add the secret names to the
secretsspecification of thePrometheusAgentresource. Add the
remoteWritespecification to thePrometheusAgentresource. YourPrometheusAgentresource might resemble the following YAML file, where theupmetric is exported to a custom endpoint:apiVersion: monitoring.rhobs/v1alpha1 kind: PrometheusAgent metadata: name: mcoa-default-platform-metrics-collector-global namespace: open-cluster-management-observability spec: secrets: - custom-endpoint-ca - custom-endpoint-cert remoteWrite: - name: custom-endpoint tlsConfig: caFile: /etc/prometheus/secrets/custom-endpoint-ca/ca.crt certFile: /etc/prometheus/secrets/custom-endpoint-cert/tls.crt keyFile: /etc/prometheus/secrets/custom-endpoint-cert/tls.key url: 'https://my-custom-remote-write-endpoint.io/api/v1/receive' writeRelabelConfigs: - action: keep regex: ^up$ sourceLabels: - __name__ - name: acm-observability ...
Additional resources
1.11.14. Disabling user workload alert forwarding for managed clusters
Disable user workload alert forwarding to stop updates to the user-workload-monitoring-config ConfigMap from observability operator endpoint. To disable user workload alert forwarding for managed clusters, set the mco-disable-uwl-alerting parameter to "true" in the MultiClusterObservability custom resource. When you set the parameter, forwarding user workload alerts to Alertmanager on your hub cluster stops and platform alerts continue to forward to Alertmanager.
After you update the configuraion, the user workload Prometheus instance on your managed cluster restarts.
Procedure
-
Run the following command to set the
mco-disable-uwl-alertingannotation to"true":
oc annotate MultiClusterObservability observability mco-disable-uwl-alerting=true
1.11.15. Forwarding your alerts for multicluster observability add-on
Configure alert forwarding for the multicluster observability add-on to send alerts to the Alertmanager of the observability stack from the managed clusters. By default, multicluster observability add-on is not configured to send alerts from Prometheus on the managed clusters to the hub cluster Alertmanager. Create a policy to configure alert forwarding when you use the multicluster observability add-on.
Required access: Cluster administrator
Prerequisites
- Ensure that the multicluster observability add-on is enabled. For more details, see Enabling the multicluster observability add-on.
Procedure
To configure alert forwarding for platform metrics, create a YAML file named
mcoa-alert-forward-platform.yaml.Add the base domain of your hub cluster for the
$hubBaseDomainparameter. If you make custom changes to theadditionalAlertmanagerConfigsspecification of the config map, be sure to add the changes directly into the policy, before applying the policy.See the following example:
apiVersion: policy.open-cluster-management.io/v1 kind: Policy metadata: name: mcoa-alert-forward-platform namespace: open-cluster-management-global-set spec: disabled: false policy-templates: - objectDefinition: apiVersion: policy.open-cluster-management.io/v1 kind: ConfigurationPolicy metadata: name: mcoa-alert-forward-platform spec: namespaceSelector: exclude: - kube-* include: - default object-templates-raw: | {{ $hubBaseDomain:= "INPUT_BASE_DOMAIN" }} {{ $hubName := (split "." $hubBaseDomain)._0 }} {{- $cmo := (lookup "v1" "ConfigMap" "openshift-monitoring" "cluster-monitoring-config") }} {{- $cy := dict }} {{- if and $cmo $cmo.data }} {{- $cy = (index $cmo "data" "config.yaml") | fromYaml }} {{- end }} {{- $mangedConfig := dict }} {{- $pm := ` prometheusK8s: additionalAlertmanagerConfigs: - apiVersion: v2 bearerToken: key: token name: observability-alertmanager-accessor-%[1]s scheme: https staticConfigs: - alertmanager-open-cluster-management-observability.apps.%[2]s tlsConfig: ca: key: service-ca.crt name: hub-alertmanager-router-ca-%[1]s insecureSkipVerify: false externalLabels: managed_cluster: %[3]s ` }} {{- $mangedConfig = merge $mangedConfig ((printf $pm $hubName $hubBaseDomain (fromClusterClaim "id.openshift.io"))| fromYaml) }} - complianceType: mustonlyhave objectDefinition: apiVersion: v1 data: config.yaml: | {{ (merge $cy $mangedConfig)| toYaml |autoindent }} kind: ConfigMap metadata: name: cluster-monitoring-config namespace: openshift-monitoring recordDiff: InStatus remediationAction: informCreate a
PlacementBindingresource to bind the policy to theglobalplacement.See the following sample:apiVersion: policy.open-cluster-management.io/v1 kind: PlacementBinding metadata: name: mcoa-alert-forward-platform-placement namespace: open-cluster-management-global-set placementRef: apiGroup: cluster.open-cluster-management.io kind: Placement name: global subjects: - apiGroup: policy.open-cluster-management.io kind: Policy name: mcoa-alert-forward-platform
To apply the policy changes across all managed clusters and enable alert forwarding from your managed clusters to the hub cluster, change the
remediationActionparameter value toenforce.Note: The
remediationActionof the previous policy is set toinformmode. From the console, validate your changes by viewing the policy from the Governance page. Your policy appears as non-compliant.Apply your YAML file. Run the following command:
oc apply -f ./forward-platform-alerts.yaml
Note: If you have managed clusters other than a Red Hat OpenShift Container Platform cluster, you must create the appropriate
PlacementBindingresource targeting the managed clusters.To configure alert forwarding for user workload metrics, create a YAML file named
mcoa-alert-forward-uwl.Add the base domain for your hub cluster in the
$hubBaseDomainparameter. Your YAML file might resemble the following example:apiVersion: policy.open-cluster-management.io/v1 kind: Policy metadata: name: mcoa-alert-forward-uwl namespace: open-cluster-management-global-set spec: disabled: false policy-templates: - objectDefinition: apiVersion: policy.open-cluster-management.io/v1 kind: ConfigurationPolicy metadata: name: mcoa-alert-forward-uwl spec: namespaceSelector: exclude: - kube-* include: - default object-templates-raw: | {{ $hubBaseDomain:= "INPUT_BASE_DOMAIN" }} {{ $hubName := (split "." $hubBaseDomain)._0 }} {{- $cmo := (lookup "v1" "ConfigMap" "openshift-user-workload-monitoring" "user-workload-monitoring-config") }} {{- $cy := dict }} {{- if and $cmo $cmo.data }} {{- $cy = (index $cmo "data" "config.yaml") | fromYaml }} {{- end }} {{- $mangedConfig := dict }} {{- $pm := ` prometheus: additionalAlertmanagerConfigs: - apiVersion: v2 bearerToken: key: token name: observability-alertmanager-accessor-%[1]s scheme: https staticConfigs: - alertmanager-open-cluster-management-observability.apps.%[2]s tlsConfig: ca: key: service-ca.crt name: hub-alertmanager-router-ca-%[1]s insecureSkipVerify: false externalLabels: managed_cluster: %[3]s ` }} {{- $mangedConfig = merge $mangedConfig ((printf $pm $hubName $hubBaseDomain (fromClusterClaim "id.openshift.io"))| fromYaml) }} - complianceType: mustonlyhave objectDefinition: apiVersion: v1 data: config.yaml: | {{ (merge $cy $mangedConfig )| toYaml |autoindent }} kind: ConfigMap metadata: name: user-workload-monitoring-config namespace: openshift-user-workload-monitoring recordDiff: InStatus remediationAction: informCreate a
PlacementBindingresource to bind the policy to theglobalplacement. Your YAML file might resemble the following sample:apiVersion: policy.open-cluster-management.io/v1 kind: PlacementBinding metadata: name: mcoa-alert-forward-uwl-placement namespace: open-cluster-management-global-set placementRef: apiGroup: cluster.open-cluster-management.io kind: Placement name: global subjects: - apiGroup: policy.open-cluster-management.io kind: Policy name: mcoa-alert-forward-uwl
- Apply your YAML file. Run the following command:
oc apply -f ./forward-uwl-alerts.yaml
Chapter 2. Using observability with Red Hat Insights
Red Hat Insights is integrated with Red Hat Advanced Cluster Management observability, and is enabled to help identify existing or potential problems in your clusters. Red Hat Insights helps you to identify, prioritize, and resolve stability, performance, network, and security risks. Red Hat OpenShift Container Platform offers cluster health monitoring through Red Hat OpenShift Cluster Manager. Red Hat OpenShift Cluster Manager collects anonymized, aggregated information about the health, usage, and size of the clusters. For more information, see Red Hat Lightspeed product documentation.
When you create or import an OpenShift cluster, anonymized data from your managed cluster is automatically sent to Red Hat. This information is used to create insights, which provide cluster health information. Red Hat Advanced Cluster Management administrator can use this health information to create alerts based on severity.
Required access: Cluster administrator
Prerequisites
- Ensure that Red Hat Insights is enabled. For more information, see Connecting to Red Hat Lightspeed through your own proxy.
- Install a supported version of OpenShift Container Platform.
- Hub cluster user, who is registered to Red Hat OpenShift Cluster Manager, must be able to manage all the Red Hat Advanced Cluster Management managed clusters in Red Hat OpenShift Cluster Manager.
Important: Red Hat Advanced Cluster Management for Kubernetes PolicyReports are violations that are generated by the insights-client. The PolicyReports are used to define and configure alerts that are sent to incident management systems. When there is a violation, alerts from a PolicyReport are sent to incident management system.
Procedure
- To search for insight policy reports, log in to your Red Hat Advanced Cluster Management hub cluster.
- Select Search from the navigation menu.
Enter the following query:
kind:PolicyReport.Note: The
PolicyReportname matches the name of the cluster.-
Specify your query with the insight policy violation and categories. When you select a
PolicyReportname, you are redirected to the Details page of the associated cluster. The Insights sidebar is automatically displayed. If the search service is disabled and you want to search for an insight, run the following command from your hub cluster:
oc get policyreport --all-namespaces
Additional resources
2.1. Viewing identified Red Hat Insights issues from the console
View Red Hat Insights identified issues from the console by using the cluster issues summary card and the PolicyReport resource. The PolicyReports are used to define and configure alerts that are sent to incident management systems.
Required access: Cluster administrator
Prerequisites
- Ensure that Red Hat Insights is enabled. For more information, see Connecting to Red Hat Insights through your own proxy.
- Install a supported version of OpenShift Container Platform.
- Hub cluster user, who is registered to Red Hat OpenShift Cluster Manager, must be able to manage all the Red Hat Advanced Cluster Management managed clusters in Red Hat OpenShift Cluster Manager.
Procedure
- Log in to your Red Hat Advanced Cluster Management cluster.
- Select Overview from the navigation menu.
-
Check the Cluster issues summary card. Select a severity link to view the
PolicyReportsthat are associated with that severity. Details of the cluster issues and the severities are displayed from the Search page. Policy reports that are associated with the severity and have one or more issues appear. - Select a policy report to view cluster details from the Clusters page. The Status card displays information about Nodes, Applications, Policy violations, and Identified issues.
Select the Number of identified issues to view details. The Identified issues card represents the information from Red Hat insights. The Identified issues status displays the number of issues by severity. The triage levels used for the issues are the following severity categories: Critical, Major, Low, and Warning.
- Alternatively, you can select Clusters from the navigation menu.
- Select a managed cluster from the table to view more details.
- From the Status card, view the number of identified issues.
- Select the number of potential issues to view the severity chart and recommended remediations for the issues from the Potential issue side panel. You can also use the search feature to search for recommended remediations. The remediation option displays the Description of the vulnerability, Category that vulnerability is associated with, and the Total risk.
Click the link to the vulnerability to view steps on How to remediate and the Reason for the vulnerability.
Note: When you resolve the issue, you receive the Red Hat Insights every 30 minutes, and Red Hat Insights is updated every two hours.
Verify which component sent the alert message from the
PolicyReport.-
Navigate to the Governance page and select a specific
PolicyReport. -
Select the Status tab and click the View details link to view the
PolicyReportYAML file. -
Locate the
sourceparameter, which informs you of the component that sent the violation. The value options aregrcandinsights.
-
Navigate to the Governance page and select a specific
2.2. Viewing Red Hat Insights updated risk predictions from the console
View Red Hat Insights updated risk predictions from the cluster Overview page in the console.
Prerequisites
- Ensure that Red Hat Insights is enabled. For more information, see Connecting to Red Hat Lightspeed through your own proxy.
- Install a supported version of OpenShift Container Platform.
- Hub cluster user, who is registered to Red Hat OpenShift Cluster Manager, must be able to manage all the Red Hat Advanced Cluster Management managed clusters in Red Hat OpenShift Cluster Manager.
Procedure
- Log in to your managed cluster.
- Go to the Overview page.
- From the Powered by Insights section, you can view the percentage of clusters with predicted risks, which are listed by severity.
- Select the number for the severity to view the list of clusters from the Clusters page.
- Select the cluster that you want, then click the Actions drop-down button.
- Click Upgrade clusters to view the risk for the upgrade.
- From the Upgrade clusters modal, find the Upgrade risks column and click the link for the number of risks to view information in the Hybrid Cloud console.
Additional resources