How does the JVM divides the Metaspace in the memory?
Environment
- Red Hat build of OpenJDK 8 (doesn't have VM.info)
- Red Hat build of OpenJDK 11+
Issue
- How does the JVM divide the space in the memory?
- How the JVM organizes the space in memory?
- How the
MaxMetaspaceSizeworks? - How to interpret the GC log for
Metaspace?
Resolution
Disclaimer: Links contained herein to an external website(s) are provided for convenience only. Red Hat has not reviewed the links and is not responsible for the content or its availability. The inclusion of any link to an external website does not imply endorsement by Red Hat of the website or their entities, products or services. You agree that Red Hat is not responsible or liable for any loss or expenses that may result due to your use of (or reliance on) the external site or content.
The solution presents the Metaspace Organization, how to interpret the Metaspace GC logs, how to extract the current values, and a diagram on the Metaspace Organization Diagram.
Metaspace Organization
Metaspace is made of one or more Virtual Spaces, which are areas of contiguous address space provided by the OS and are allocated on demand.
So, when this memory is allocated, Virtual Space reserves memory from the OS, but not yet commits it.
Inside the Virtual Space, there are the Metachunks, also known as chunks, which are the areas indeed used in the Virtual Space (the chunks might have different sizes), the corresponding memory is committed. When a ClassLoader gets garbage collected, all Metachunks belonging to it are freed. All the free chunks are maintained in the global free list.
Gc logs interpretation
Metaspace committed memory is the total size committed of all chunks.
Metaspace capacity is the total size of all allocated (i.e. not free- actually used) chunks.
Metaspace used is the total size of all class metadata from all chunks.*
The MaxMetaspaceSize limits the committed memory, not the reserved memory in the GC logs. This can bit a little confuse, since reserved memory can be higher than the MaxMetaspace limit.
Example from the GC logs
Using the XX:MaxMetaspaceSize=201326592 limit, the following line appears in the GC logs:
Metaspace used 124862K, capacity 137964K, committed 154240K, reserved 325632K
So reserved: 325632K, committed: 154240K, capacity: 137964K. As mentioned, the flag MaxMetaspaceSize limits the committed memory, which fullfils the XX:MetaspaceSize=201326592 limit, sice it is at 154240K, less than the limit.
Extract the exact values
To investigate the exact values one can use the tools: Content from docs.oracle.com is not included.jstat and Content from docs.oracle.com is not included.jcmd. Examples:
Example with jcmd:
This option will give summarized information on the Metaspace:
$ jcmd 28654 GC.heap_info
28654:
 PSYoungGen      total 389632K, used 69309K [0x00000000e4d80000, 0x0000000100000000, 0x0000000100000000)
  eden space 334336K, 20% used [0x00000000e4d80000,0x00000000e912f4d0,0x00000000f9400000)
  from space 55296K, 0% used [0x00000000fca00000,0x00000000fca00000,0x0000000100000000)
  to   space 55296K, 0% used [0x00000000f9400000,0x00000000f9400000,0x00000000fca00000)
 ParOldGen       total 890368K, used 60589K [0x00000000ae800000, 0x00000000e4d80000, 0x00000000e4d80000)
  object space 890368K, 6% used [0x00000000ae800000,0x00000000b232b4c0,0x00000000e4d80000)
 Metaspace       used 88888K, capacity 98974K, committed 99200K, reserved 1134592K <--- Metaspace
  class space    used 11878K, capacity 14883K, committed 14976K, reserved 1048576K <--- class space
For detailed information of the Native Memory, which includes the Metaspace, use jcmd PID VM.native_memory, which will show the Metaspace data under the Class part. The enable this, the flag -XX:NativeMemoryTracking=detail should be used:
JDK8/bin/jcmd 7658 VM.native_memory`
Native Memory Tracking:

Total: reserved=2929697KB, committed=1664309KB

-                     Class (reserved=1154644KB, committed=120916KB)
                            (classes #19452)
                            (malloc=11860KB #26406)
                            (mmap: reserved=1142784KB, committed=109056KB)
In JDK 11, it was introduced the VM.metaspace option that provides a complete detailed information about Metaspace, including the chunks, the size, the InitialBootClassLoaderMetaspaceSize, UseCompressedClassPointers, and CompressedClassSpaceSize. But also the detailed information on the chunks:
### $ jcmd PID VM.metaspace or VM.info:
$JDK11_HOME/bin/jcmd 27689 VM.metaspace
27689:

Total Usage ( 1490 loaders): <--- number of loaders

  Non-Class: 4312 chunks,     98.45 MB capacity,    91.95 MB ( 93%) used,     6.23 MB (  6%) free,     4.60 KB ( <1%) waste,   269.50 KB ( <1%) overhead, deallocated: 28367 blocks with 4.26 MB
      Class: 2402 chunks,     17.00 MB capacity,    13.64 MB ( 80%) used,     3.21 MB ( 19%) free,   328 bytes ( <1%) waste,   150.12 KB ( <1%) overhead, deallocated: 1753 blocks with 919.75 KB
       Both: 6714 chunks,    115.45 MB capacity,   105.60 MB ( 91%) used,     9.44 MB (  8%) free,     4.92 KB ( <1%) waste,   419.62 KB ( <1%) overhead, deallocated: 30120 blocks with 5.16 MB

Virtual space <--- virtual space size
  Non-class space:      100.00 MB reserved,      98.75 MB ( 99%) committed
      Class space:      248.00 MB reserved,      17.15 MB (  7%) committed
             Both:      348.00 MB reserved,     115.90 MB ( 33%) committed

Chunk freelists:
   Non-Class:

 specialized chunks:    2, capacity 2.00 KB
       small chunks:   54, capacity 216.00 KB
      medium chunks: (none)
   humongous chunks: (none)
              Total:   56, capacity=218.00 KB
       Class:

 specialized chunks: (none)
       small chunks:   14, capacity 28.00 KB
      medium chunks: (none)
   humongous chunks: (none)
              Total:   14, capacity=28.00 KB

Waste (percentages refer to total committed size 115.90 MB):
              Committed unused:    212.00 KB ( <1%)
        Waste in chunks in use:      4.92 KB ( <1%)
         Free in chunks in use:      9.44 MB (  8%)
     Overhead in chunks in use:    419.62 KB ( <1%)
                In free chunks:    246.00 KB ( <1%)
Deallocated from chunks in use:      5.16 MB (  4%) (30120 blocks)
                       -total-:     15.46 MB ( 13%)


MaxMetaspaceSize: 256.00 MB <------------------------------------------------ Max Metaspace Size
InitialBootClassLoaderMetaspaceSize: 4.00 MB <-- initial boot class
UseCompressedClassPointers: true
CompressedClassSpaceSize: 248.00 MB <----------------------------------------- Compressed Class size
Example with jstat:
With jstat -gc PID example and see the MC (Metaspace capacity) and MU (Metaspace utilization) CCSC (Compressed class space capacity) and CCSU (Compressed class space used):
$ jstat -gc 30315
 S0C    S1C    S0U    S1U      EC       EU        OC         OU       MC     MU    CCSC   CCSU   YGC     YGCT    FGC    FGCT     GCT
55296.0 55296.0  0.0    0.0   334336.0 147272.4  890368.0   64743.3   98304.0 87776.9 15104.0 11922.6      4    0.163   1      0.150    0.313
Metaspace Organization Diagram
The diagram below shows a segment of memory with two Virtual Spaces1, one at the top and one at the bottom. The first Virtual Space has one used Metachunk and one free chunk. The occupied chunk has some used blocks of data. The second one has no chunks.
Metaspace organization:
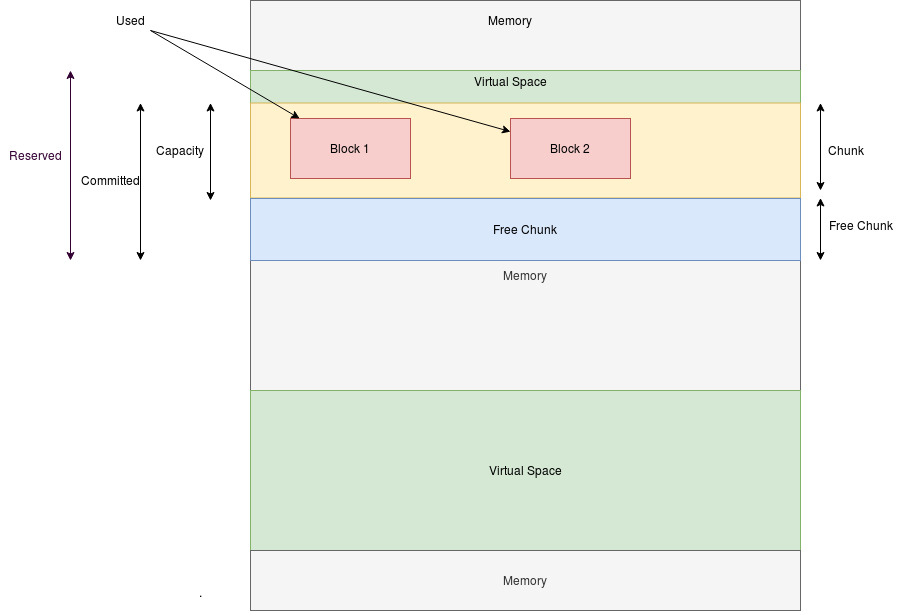

This is an oversimplification for explanation purposes. In reality, the heap memory is composed of granules and cells which are much more spread and complex than the diagram.
Root Cause
Regarding the Metaspace flag: it sets the initial threshold for GC sizing. In case the metaspace crosses this value, it will be re-caped and continue to be recaped until the Max size (or no upper limit).
Regarding MaxMetaspace, by default, without setting MaxMetaspace flag, the Metaspace has no upper limit in OpenJDK and this is done by setting the value to 18446744073709547520 (decimal), meaning 0xFFFFFFFFFFFFF000 (hexadecimal), which means the maximum possible 64-bit integer:
java -XX:+PrintFlagsFinal -version | grep MaxMetaspaceSize
    uintx MaxMetaspaceSize                          = 18446744073709547520
Diagnostic Steps
- Verify the
jcmd $PID VM.infoORjcmd $PID VM.metaspace - Verify any OOME Metaspace
This solution is part of Red Hat’s fast-track publication program, providing a huge library of solutions that Red Hat engineers have created while supporting our customers. To give you the knowledge you need the instant it becomes available, these articles may be presented in a raw and unedited form.