Visualizing system performance data of PCP in Grafana
Environment
- Red Hat Enterprise Linux 8
- Red Hat Enterprise Linux 9
- Performance Co-Pilot
- Grafana
- Redis
Issue
- How to plot the system performance data captured by PCP (Performance Co-Pilot) in Grafana ?
- How to monitor the system performance graphically ?
- How to monitor the historical or live PCP performance data in Grafana ?
- How to configure the Grafana to plot the PCP data ?
- How to feed PCP performance data to Grafana ?
Resolution
Preparing a system
Install PCP, grafana and redis
# dnf install pcp-zeroconf grafana redis
Start and enable the required services
# systemctl start pmcd pmlogger grafana-server redis pmproxy
# systemctl enable pmcd pmlogger pmproxy redis grafana-server
As soon as the 'grafana-server' is started its services will be made available on the '3000' port and can be accessed through the Content from localhost is not included.Content from localhost is not included.http://localhost:3000/:

The default username and password for grafana is 'admin'.
Configuring Grafana
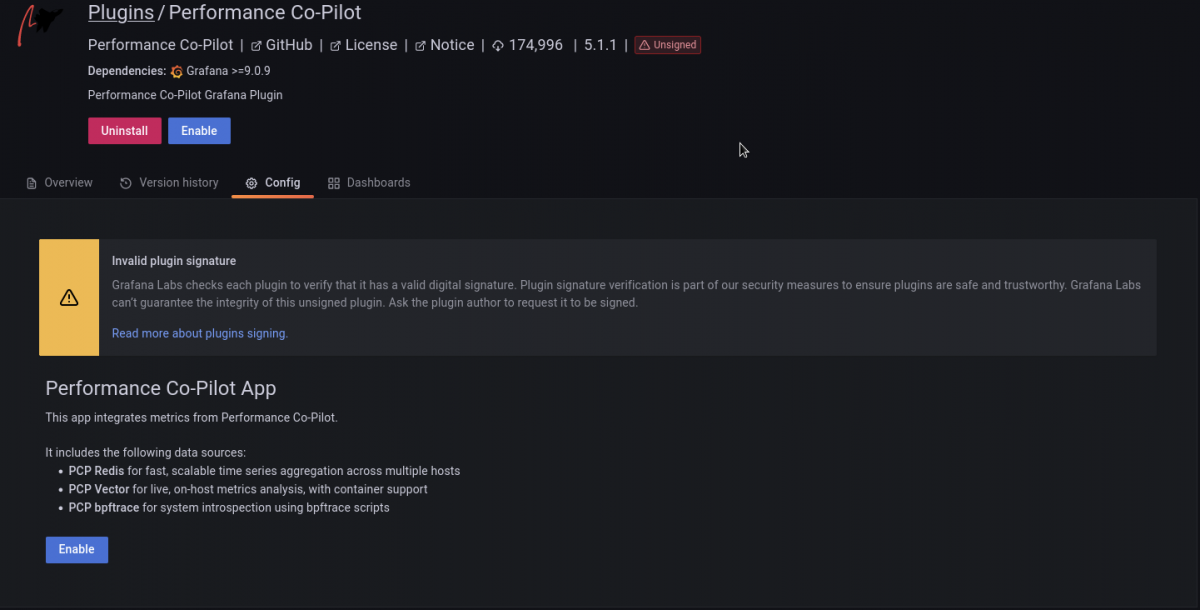
- The first thing is to make Grafana aware of PCP by enabling the Performance Co-Pilot plugin (the necessary 'grafana-pcp' package has already been pulled and installed as a dependency of a 'grafana' package).
- Go to settings (gear icon) -> Plugins -> Search 'Performance Co-Pilot' plugin -> Enable:
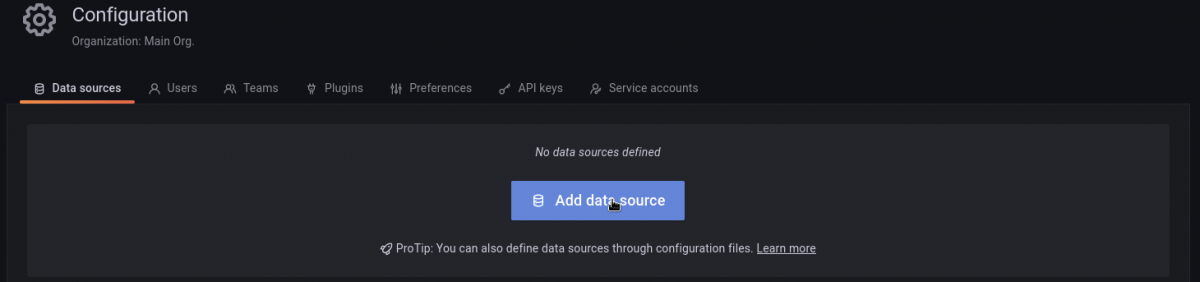
- Upon enabling the PCP plugin its time to add the data source.
- Go to settings (gear icon) -> Data Sources -> Add data source:
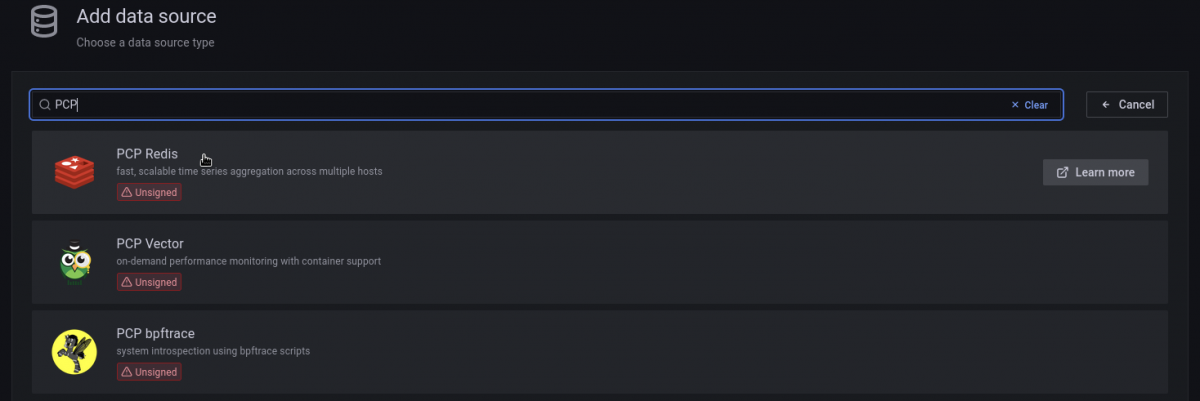
- Search and Select 'PCP Redis':
- Add URL - http://localhost:44322 -> save & test the connection:
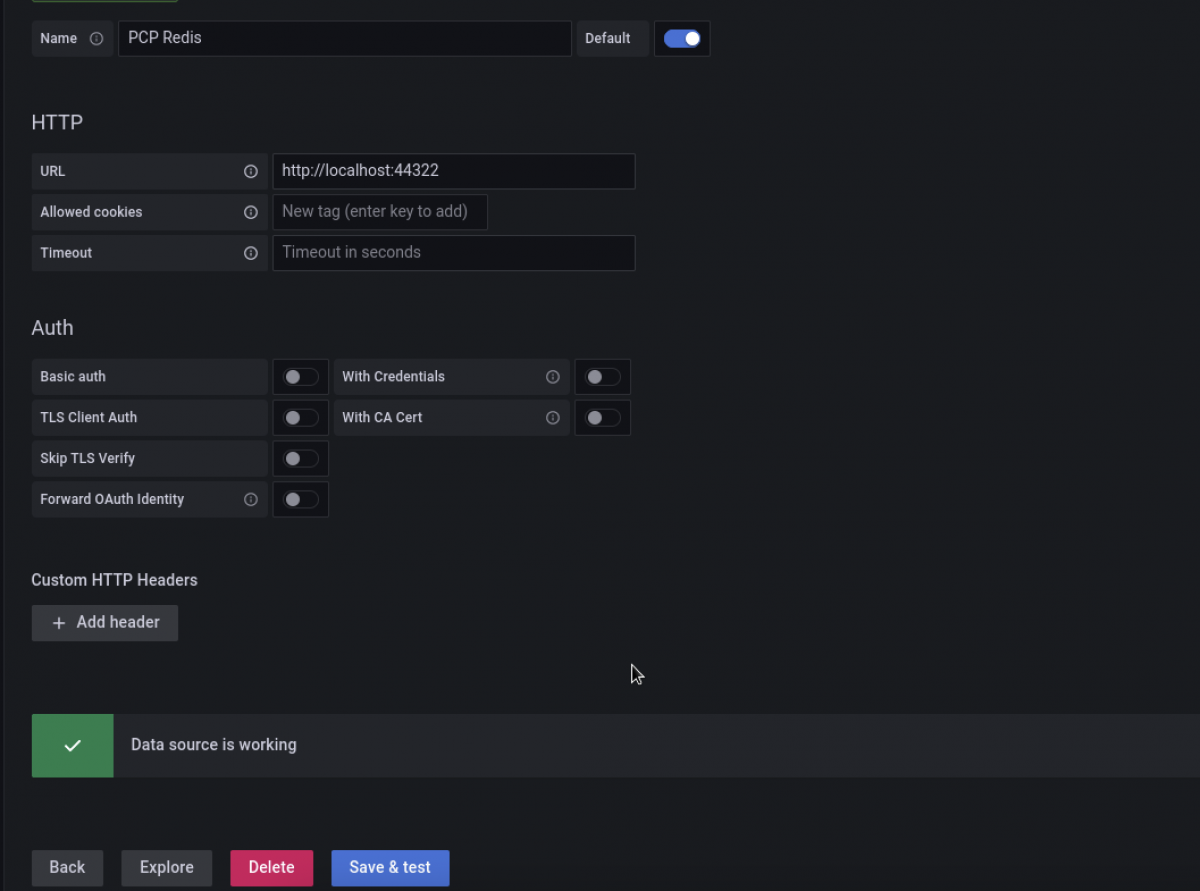
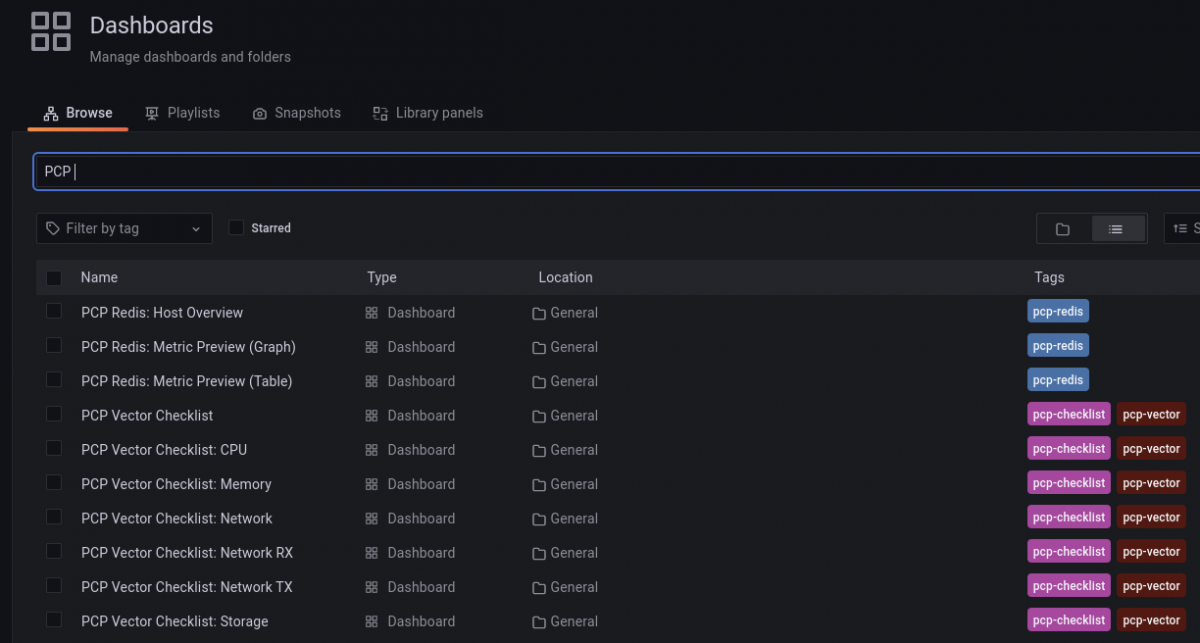
If the connection fails then make sure the 'pmproxy' service of pcp is enabled and running. Next dashboard has to be added so that grafana will start plotting the graphs accordingly: - Go to Dashboards -> Browse -> PCP Redis -> choose 'PCP Redis: Host Overview':


Plotting the performance graphs of Live System
As soon as the dashboard is loaded, Grafana will start plotting the live systems performance data (every subsystem) captured by PCP in graphs, bars and charts.

Plotting the performance graphs from PCP archive
In order to visualize (plot graphs and charts) the historical performance data one has to feed the PCP archive to redis. PCP has a separate tool called as 'pmseries' designed and implemented for the same purpose:
# pmseries --load <provide_the_absolute_path_of_the_PCP_archive>

For example:

# pmseries --load /var/log/pcp/pmlogger/<hostname>/20230430.0.xz

- Please note that 'pmseries' would fail if the provided archive file does not have its supporting '.index' and '.meta' files in the same directory. Upon successfully feeding the PCP archive to the redis; Grafana will start plotting the data:
- If the data is not visible then make sure the timeline and hostname are set correctly. For example - The archive used in this example is 1 year old so 'Last 1 year' timeline and correct hostname has to be chosen.
- You can use any other systems PCP archive as well to visualize the performance data.
- One can also use the grafana container to achieve what has been explained in this article. Please follow the instructions listed in this Knowledge Base Article.
Additional Information:
In RHEL-10, instead of redis, valkey is used as datasource. Check Visualizing system performance data of PCP in Grafana RHEL-10 using valkey for more information.
Diagnostic Steps
- Performance Co-Pilot collects the actual performance data.
- Redis is a data source for Grafana.
- PCP feeds the performance data to redis and redis sends it further to Grafana.
- Redis sits in between of Grafana & PCP.
- Grafana is a visualizer / plotter of charts and graphs of performance data.
- Similar to redis grafana supports many other data sources such as vector, influx etc.
- In general terms these data sources are nothing but the databases or fast caches.
This solution is part of Red Hat’s fast-track publication program, providing a huge library of solutions that Red Hat engineers have created while supporting our customers. To give you the knowledge you need the instant it becomes available, these articles may be presented in a raw and unedited form.