Visualizing PCP system performance data in Grafana on RHEL-10 using Valkey
Environment
- Red Hat Enterprise Linux 10
- Performance Co-Pilot(PCP)
- Grafana
- Valkey
Issue
- How to plot the system performance data captured by PCP (Performance Co-Pilot) in Grafana using Valkey in RHEL-10 ?
- How to monitor the system performance graphically in RHEL-10?
- How to monitor the historical or live PCP performance data in Grafana ?
Resolution
1. Install PCP, grafana and valkey
# dnf install pcp-zeroconf grafana valkey
2. Start and enable the required services
# systemctl start pmcd pmlogger grafana-server pmproxy valkey
# systemctl enable pmcd pmlogger grafana-server pmproxy valkey
Once the services are started access the Grafana web UI from Content from localhost is not included.Content from localhost is not included.http://localhost:3000/.
- Replace localhost with your machine IP to access Grafana web UI from a remote machine.
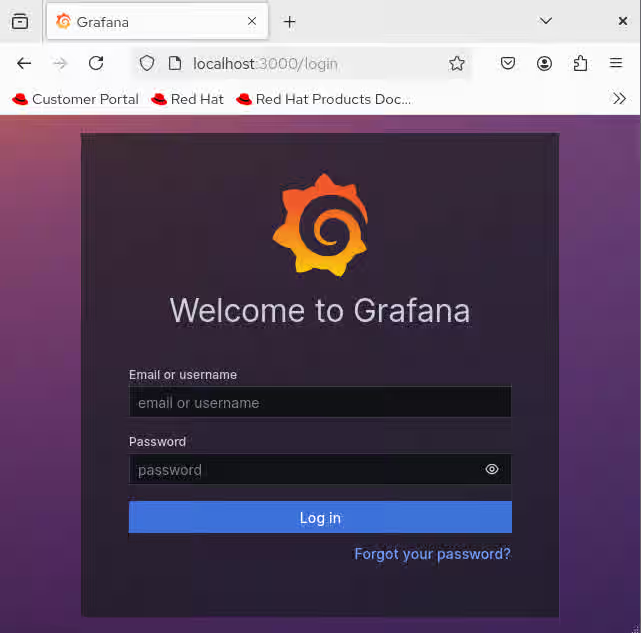
Enter the default username and password as admin. Choose skip to continue default password or change it as per your requirement.
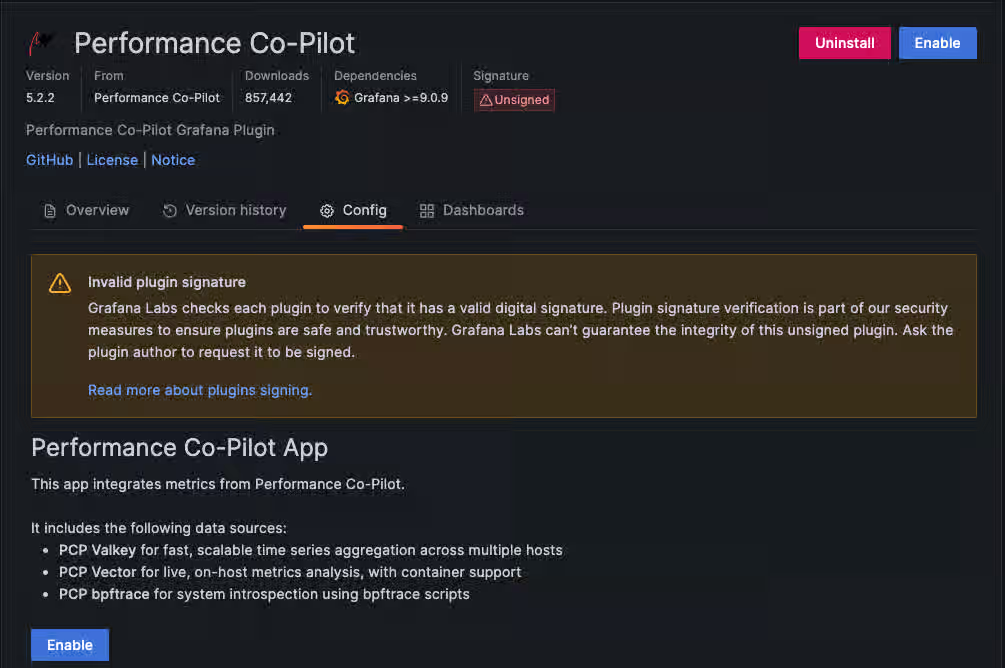
3. Enable PCP Plugin
- From menu (three horizontal lines) choose
Administration->Plugins and data->Plugins - Search and Enable
Performance Co-PilotPlugin.- Else you can also open Content from localhost is not included.Performance Co-Pilot plugin page directly.
- Add data source from
Connections->Data sources- Or directly open the Content from localhost is not included.Data Source Page link.
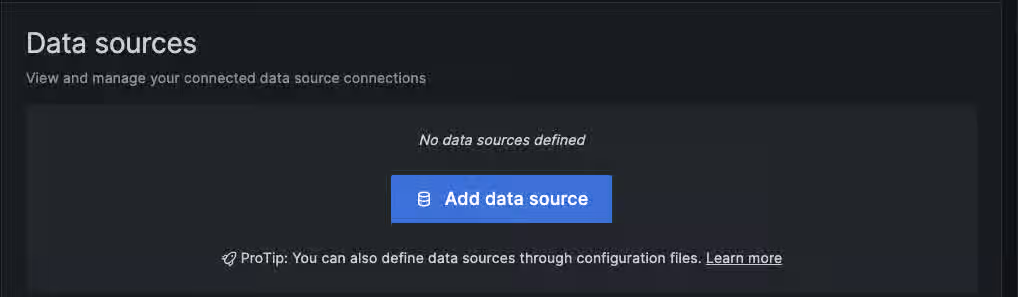
- Search and select
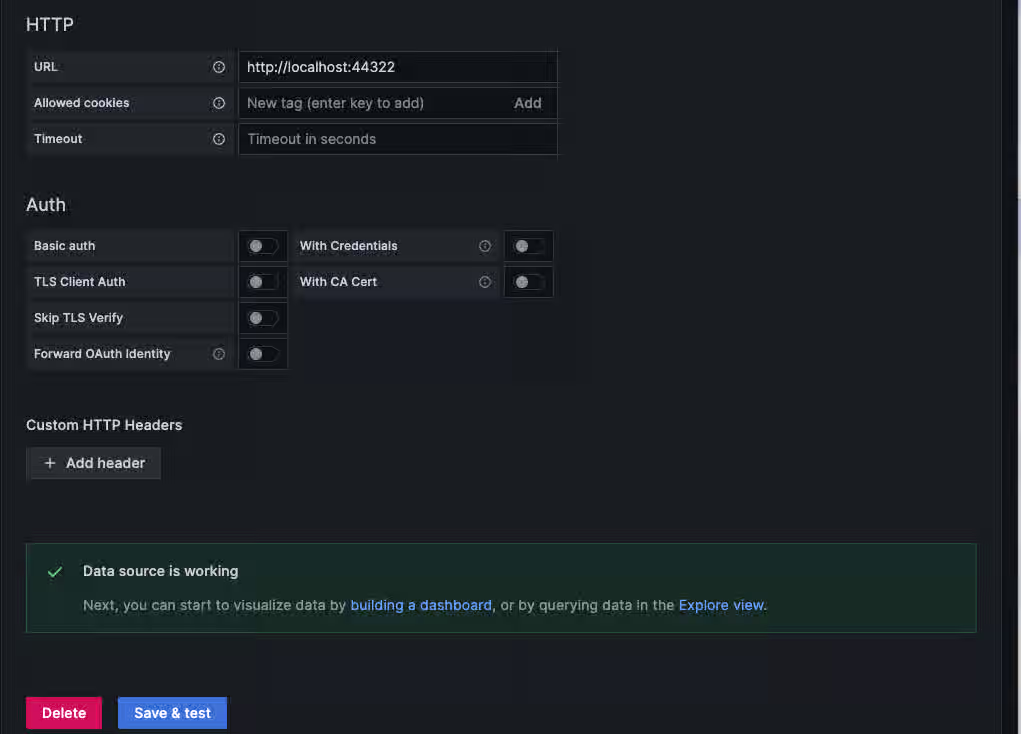
PCP Valkey - Enter the
http://localhost:44322URL underHTTPand clickSave & test - You can add other PCP data sources as well such as
PCP bpftraceandPCP Vectorto visualise different metrics.
- Open the
Dashboardstab under Valkey datasource and ImportPCP Valkey: Host Overview
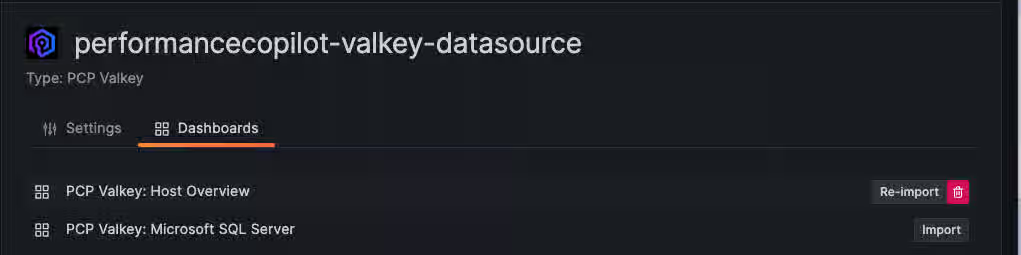
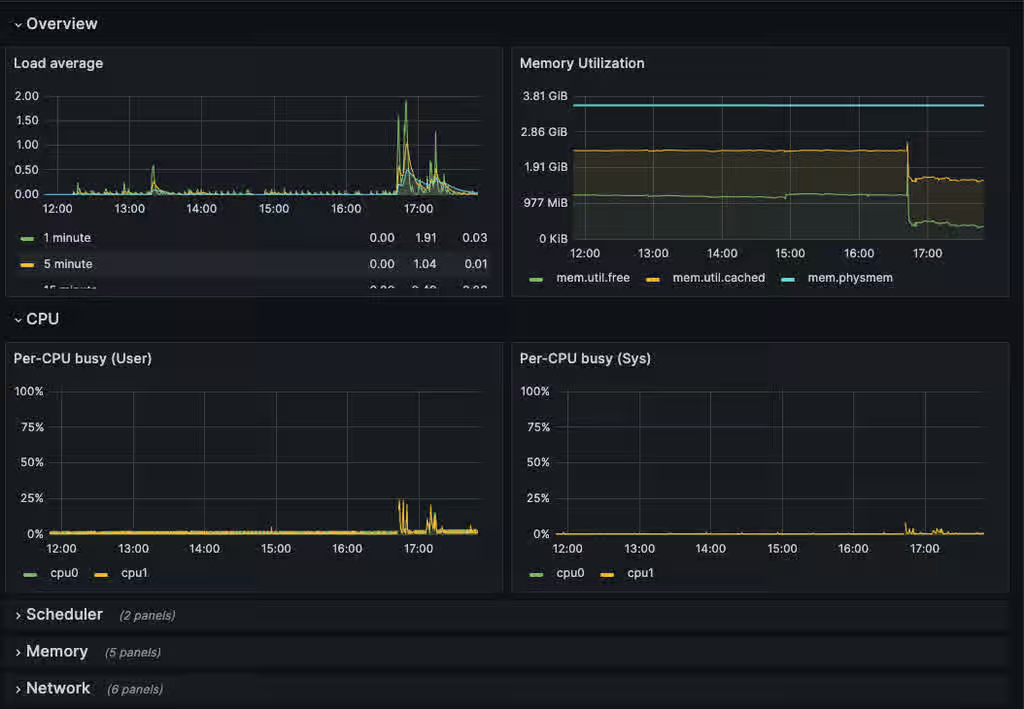
- Goto
Home->Dashboardsand click onPCP Valkey: Host Overview
Additional Information:
To use PCP on RHEL-8 and RHEL-9 with Redis check Visualizing system performance data of PCP in Grafana
Product(s)
Components
Category
This solution is part of Red Hat’s fast-track publication program, providing a huge library of solutions that Red Hat engineers have created while supporting our customers. To give you the knowledge you need the instant it becomes available, these articles may be presented in a raw and unedited form.